
Water Electrolysis Market Size and Share
Market Overview
| Study Period | 2021 - 2031 |
|---|---|
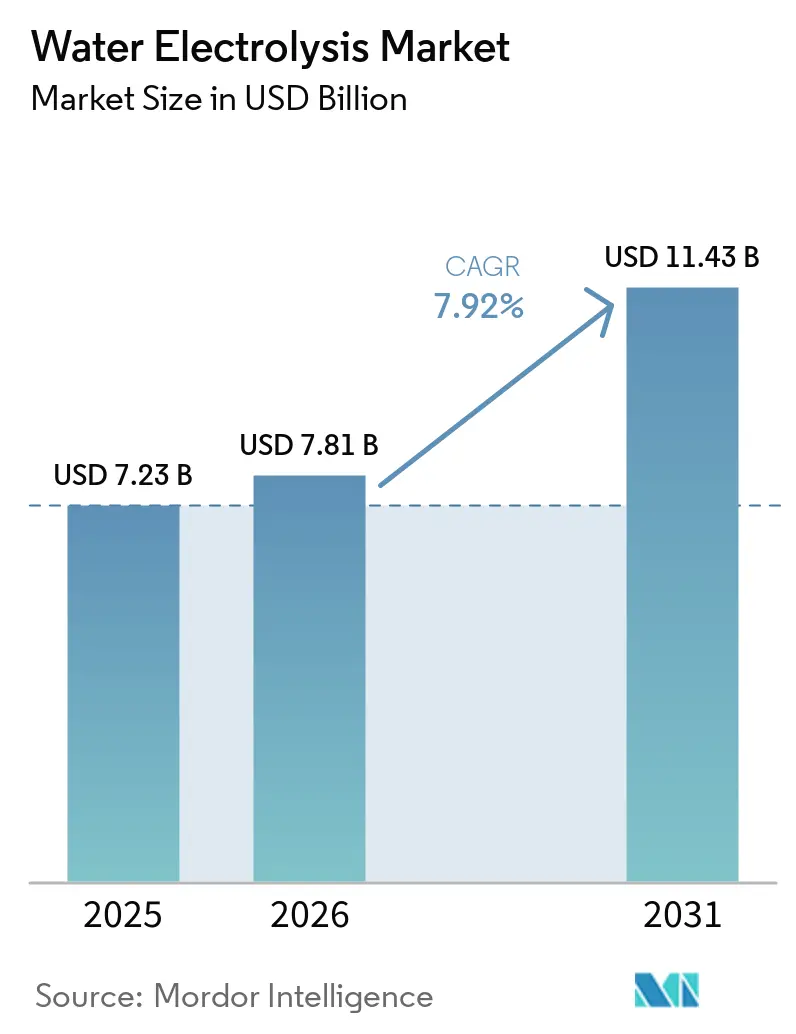
| Market Size (2026) | USD 7.81 Billion |
| Market Size (2031) | USD 11.43 Billion |
| Growth Rate (2026 - 2031) | 7.92 % |
| Fastest Growing Market | Asia-Pacific |
| Largest Market | Europe |
| Market Concentration | Medium |
Major Players *Disclaimer: Major Players sorted in no particular order Image © Mordor Intelligence. Reuse requires attribution under CC BY 4.0. | |
Water Electrolysis Market Analysis by Mordor Intelligence
The Water Electrolysis Market size is projected to expand from USD 7.23 billion in 2025 and USD 7.81 billion in 2026 to USD 11.43 billion by 2031, at a CAGR of 7.92% between 2026 and 2031. The water electrolysis market is supported by industrial demand for lower-emissions hydrogen, a growing pipeline of renewable-power projects, and a need to replace conventional hydrogen at established industrial sites. Low-emissions hydrogen investment reached nearly USD 7 billion in 2025, and electrolysis accounted for a growing share of committed project spending[1]International Energy Agency, “Investment and Innovation,” Global Hydrogen Review 2026, iea.org.. The water electrolysis market also benefits when developers combine equipment supply, renewable generation, and long-term offtake arrangements. This approach can improve financing conditions for projects that must manage power prices, utilization, output commitments, construction schedules, and the allocation of performance risk among project participants. Competition is becoming more focused on cost, delivery capability, performance guarantees, regional manufacturing capacity, and access to industrial hubs that can support domestic use or export-oriented hydrogen derivatives.
Key Report Takeaways
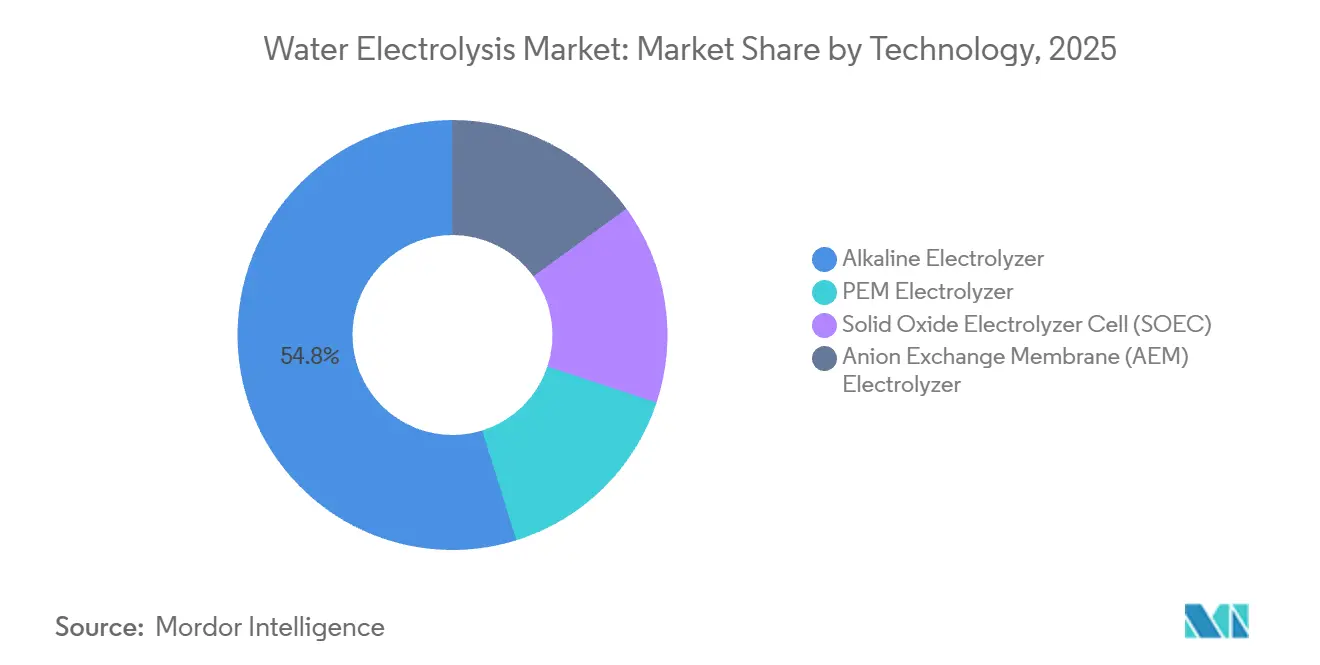
- By technology, alkaline electrolyzers held 54.8% of water electrolysis market share in 2025, while PEM is projected to grow at a 9.4% CAGR through 2031.
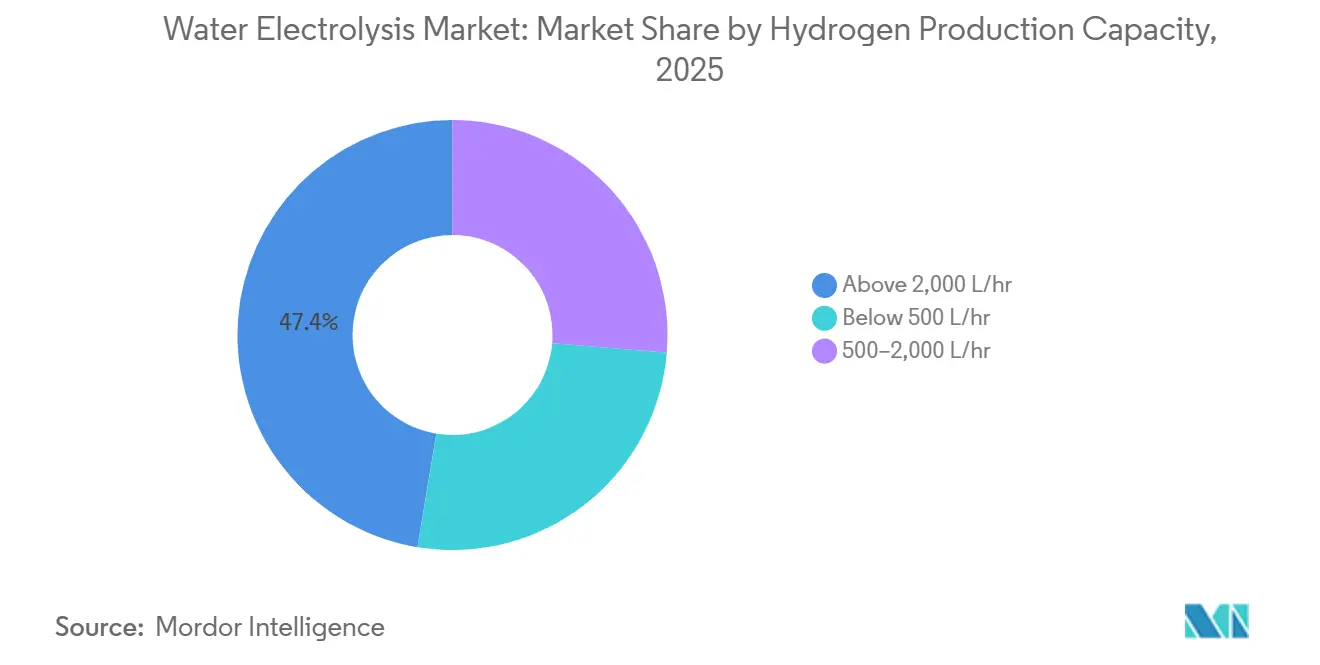
- By hydrogen production capacity, above-2,000 L/hr systems accounted for 47.4% of water electrolysis market share in 2025, while the 500-2,000 L/hr category is forecast to expand at an 8.7% CAGR through 2031.
- By end use, chemicals held 33.2% of water electrolysis market share in 2025, while oil & gas and refining is forecast to grow at a 9.1% CAGR through 2031.
- By geography, Europe held 31.5% of water electrolysis market share in 2025, while Asia-Pacific is forecast to grow at a 9.2% CAGR through 2031.
Note: Market size and forecast figures in this report are generated using Mordor Intelligence’s proprietary estimation framework, updated with the latest available data and insights as of January 2026.
Global Water Electrolysis Market Trends and Insights
Drivers Impact Analysis*
| Driver | (~) % Impact on CAGR Forecast | Geographic Relevance | Impact Timeline |
|---|---|---|---|
| Industrial Decarbonization and Green-Hydrogen Demand | +2.50% | Global, concentrated in EU, China, India, Middle East | Long term (≥ 4 years) |
| Renewable-Power Integration and Long-Duration Energy Storage | +1.40% | APAC core, spill-over to EU and North America | Medium term (2–4 years) |
| Hydrogen Mandates, Incentives and Carbon-Reduction Policies | +1.20% | EU, India, Japan, Middle East | Short to Medium term (≤ 4 years) |
| Demand Growth from Ammonia, Methanol, Refining, Steel and E-Fuels | +1.50% | Global, with early gains in India, Middle East, EU | Long term (≥ 4 years) |
| Co-Located Hydrogen Production in Industrial and Port Clusters | +0.60% | EU, APAC, South America | Medium term (2–4 years) |
| Digital Stack Monitoring and Predictive Maintenance | +0.30% | Global | Short term (≤ 2 years) |
| Source: Mordor Intelligence | |||
Industrial Decarbonization Driving Electrolyzer Demand Beyond the Chemicals Sector
Industrial decarbonization supports the water electrolysis market because many processes need hydrogen as a feedstock, and these users already understand hydrogen quality requirements, handling practices, and operating risks. Oil refining used 37 million tons of hydrogen in 2024, while ammonia production used 33 million tons[2]International Energy Agency, “Executive Summary,” Global Hydrogen Review 2025, iea.org.. Most of this demand has historically been supplied through fossil-based production routes, creating a defined replacement opportunity where renewable electricity, water supply, and project finance can be brought together. The U.S. Inflation Reduction Act Section 45V credit can improve the economics of renewable hydrogen for steel and ammonia production in selected locations[3]National Renewable Energy Laboratory, “Techno-Economic Analysis of Low-Carbon Hydrogen Production Pathways for Decarbonizing Steel and Ammonia Production,” NREL, nrel.gov.. The water electrolysis market, therefore, has a route into established industrial sites where hydrogen handling systems, demand patterns, technical specifications, and operating staff are already present.
Renewable-Power Integration Turning Electrolyzers Into Grid Assets
Renewable power integration is changing the role of electrolyzers within the water electrolysis market. Electrolyzers can act as flexible loads when wind and solar output would otherwise be curtailed, which can give project developers another source of value beyond hydrogen sales alone. This capability is particularly relevant where renewable additions have outpaced grid capacity and where power systems need flexible demand that can respond to changing generation conditions. Germany had 193 MW of operational electrolysis capacity in 2026, but high grid-power costs meant many projects still required public support. Developers that link electrolyzer supply with dedicated renewable assets and power agreements can present a more complete project case to lenders, customers, and public funding bodies.
Hydrogen Mandates and Carbon-Reduction Policies Anchoring Long-Term Demand
Policy rules are making the demand case for the water electrolysis market more specific by linking renewable-hydrogen use to transport, industrial consumption, procurement rules, and decarbonization targets. RED III establishes renewable fuel requirements for industry and transport in the European Union, which gives developers a clearer policy framework for renewable fuels of non-biological origin. Only 4 of 27 member states had fully or partly transposed the directive by August 2025, which leaves an implementation risk[4]Hydrogen Europe, “Clean Hydrogen Monitor 2025,” Hydrogen Europe, hydrogeneurope.eu.. India’s National Green Hydrogen Mission targets 5 million tons of annual renewable hydrogen production by 2030 and supports a procurement pipeline that extends beyond local demand toward export-oriented production. John Cockerill secured a 1.3 GW electrolyzer order from AM Green in October 2024, demonstrating the scale of procurement being planned in India.
E-Fuels, Ammonia, and Steel Creating Industrial-Scale Electrolyzer Pull
Ammonia, refining, steel, and hydrogen-based fuels give the water electrolysis market access to large industrial demand centers. More than 85% of committed low-emissions hydrogen investment targets existing industrial uses, refineries, chemicals, or hydrogen-based fuels. These uses have clearer offtake needs than projects developed only for future demand because the hydrogen is tied to an existing process, customer base, and product value chain. Large installations are increasingly designed in modules, allowing capacity to increase when customer contracts expand and allowing developers to stage capital commitments as project economics become clearer. This lowers the commitment required at the first investment decision and reduces the risk that an oversized facility will operate without sufficient contracted demand. It also gives suppliers with delivery and engineering capabilities an advantage in large project tenders.
Restraints Impact Analysis*
| Restraint | (~) % Impact on CAGR Forecast | Geographic Relevance | Impact Timeline |
|---|---|---|---|
| High Electricity Cost and Low-Cost Renewable Availability | -0.90% | EU, Japan, South Korea; lower impact in APAC renewable zones | Medium term (2–4 years) |
| High Upfront Capital and Project-Finance Risk | -0.70% | Global, most severe in emerging markets lacking blended-finance instruments | Medium to Long term (2–4 years) |
| Water, Cooling and Brine-Management Constraints in Arid Locations | -0.20% | Middle East, North Africa, northern India, parts of China | Long term (≥ 4 years) |
| Iridium, Platinum-Group Metals and Membrane Durability Bottlenecks | -0.30% | Global (PEM-specific; most constraining where PEM uptake is fastest) | Medium to Long term (2–4 years) |
| Source: Mordor Intelligence | |||
Electricity Costs Limiting Green Hydrogen Competitiveness Across Most Markets
Electricity costs remain a central restraint on the water electrolysis market because they shape the cost of hydrogen production, the hours that equipment can operate, and the price that industrial customers must pay. The IEA reported that lower natural gas prices since 2025 had widened the cost difference between renewable and fossil hydrogen in several markets. This can delay final investment decisions where grants or contracted low-cost power are unavailable, particularly where developers cannot pass higher hydrogen costs through to their customers. Project development is consequently concentrated in regions with favorable renewable resources, workable offtake conditions, suitable infrastructure, and a policy environment that can reduce early project risks. The Iberian Peninsula, southern India, the Middle East, and northern Chinese wind regions have characteristics that can support lower-cost supply.
High Capital Requirements and Project-Finance Risk Deferring Investment Decisions
Large systems need significant upfront capital, and standardized long-term offtake contracts remain limited, leaving developers to negotiate project-specific terms for power, output, delivery, and risk allocation. New final investment decisions for low-emissions hydrogen production fell below 0.8 Mtpa in 2025 after 2 years above 1 Mtpa. Electrolyzer assets may operate for 15-20 years, while supply contracts often run for 10-15 years. This leaves a residual-value issue for project financiers, who must assess equipment value after the initial customer contract ends and before any replacement contract is secured. The water electrolysis market is therefore likely to favor suppliers that can support performance guarantees, engineering delivery, credible project partnerships, and evidence that systems can meet contracted output requirements over time.
*Our forecasts treat driver/restraint impacts as directional, not additive. The impact forecasts reflect baseline growth, mix effects, and variable interactions.
Segment Analysis
By Technology: Alkaline Holds the Base; PEM Redefines the Growth Frontier
Alkaline electrolyzers held 54.8% of the water electrolysis market size in 2025, while PEM is expected to record a 9.4% CAGR through 2031. Alkaline technology remains widely used because it has an established industrial record, does not rely on iridium, works with nickel-based catalysts, and has been used for decades in industrial applications such as chlor-alkali production. Its lower capital requirements also support its position in large industrial projects, especially where buyers prioritize proven equipment, cost discipline, standardization, and rapid availability over the operating flexibility of newer technologies. PEM systems respond rapidly to variable renewable electricity and can deliver high-purity hydrogen, which is important when hydrogen production must follow changing wind and solar generation without compromising the quality required by specialized end users. These attributes support use in fuel-cell applications and semiconductor-related production, where compact equipment, dynamic operation, and stringent purity specifications can matter more than the lower initial cost associated with alkaline technology.
Research published in 2025 demonstrated a tunnel-structured IrOx catalyst that reduced iridium loading in PEM anodes. The result addresses a material constraint that affects wider PEM deployment because global iridium supply is limited and iridium is largely produced as a by-product of platinum mining rather than as a primary material. Nel ASA approved an investment decision in December 2025 to industrialize a pressurized alkaline platform at Herøya, Norway. SOEC technology retains an efficiency case where industrial waste heat is available, particularly in steel and ammonia settings, but it is earlier in commercialization and carries greater development, manufacturing, and customer adoption risk than established alkaline systems. AEM systems are also moving from demonstrations toward industrial applications without the same iridium exposure as PEM systems, giving developers another possible technology route where flexible operation and lower material dependency are central procurement considerations.



By Hydrogen Production Capacity: Large Systems Anchor Revenues; Mid-Range Grows Fastest
Above-2,000 L/hr systems accounted for 47.4% of the water electrolysis market size in 2025. The 500-2,000 L/hr category is projected to grow at an 8.7% CAGR from 2026 to 2031. Mid-range systems allow industrial buyers to start with phased deployments rather than make a single large commitment, which can be useful when offtake contracts are still being negotiated or when facilities are adding renewable hydrogen in several stages. These systems can be assembled in standard containers and commissioned more quickly than custom projects, helping customers limit site work, reduce scheduling uncertainty, and match commissioning with the availability of renewable power and industrial demand. This model helps buyers manage technology, timing, and customer-contract risks while retaining the option to add equipment once operating performance, electricity supply, and the strength of the customer base have been demonstrated.
Large systems still attract the largest individual contracts and provide the revenue base for established suppliers because refineries, ammonia producers, and industrial parks may require substantial hydrogen volumes from a single coordinated installation. thyssenkrupp nucera signed a contract in March 2026 to supply 300 MW of alkaline equipment for Moeve’s Onuba facility in Huelva, Spain. Below-500 L/hr systems serve remote sites, electronics applications, and demonstration installations, where local production can avoid transport constraints, establish certification pathways, or test technical and commercial arrangements before larger procurement decisions. Enapter’s AEM Nexus 2500 was selected for a Rotterdam demonstration that combines electrolysis, renewable generation, and battery storage. Across capacity bands, customers are placing greater weight on guaranteed hydrogen output rather than equipment supply alone, which raises the importance of engineering partners, operating support, performance warranties, and clearly defined responsibility for delivery outcomes.
By End Use: Chemicals Anchor the Market; Oil & Gas Refining Is the Strategic Growth Bet
Chemicals held 33.2% of the water electrolysis market share in 2025. The segment is supported by captive demand for ammonia, methanol, and specialty chemical production, where hydrogen is already a necessary production input and demand is closer to the point of use than in emerging merchant-hydrogen projects. Existing sites can replace conventional hydrogen while using established handling infrastructure, established operating procedures, and specifications that are already known to the project owner, which can simplify the commercial basis for investment. BASF commissioned a 54 MW green hydrogen plant at Ludwigshafen in early 2025 for use in its integrated chemical complex. This type of project has an identifiable customer and defined hydrogen specifications, so investment decisions can be tied to a specific operating need rather than depending entirely on the future development of a new hydrogen distribution network.
Oil & gas and refining is forecast to grow at a 9.1% CAGR through 2031. Refining requires hydrogen for hydrotreating and desulfurization, which gives the segment a direct process need and limits the scope for substituting another feedstock when refiners must meet fuel-quality and emissions requirements. The sector offers a near-term path for large systems when renewable power and offtake can be aligned, because refinery locations already have hydrogen users, industrial utilities, technical personnel, and established connections to energy and chemical supply chains. Power and utilities, transportation, manufacturing, energy storage, and electronics have different operating needs and project sizes, ranging from flexible conversion of renewable electricity to local hydrogen supply for vehicles, manufacturing processes, and high-purity applications. Fuel-cell transport demand is developing in Japan and South Korea, while energy storage projects are relevant in wind-heavy power systems where hydrogen can provide a longer-duration option than electrochemical batteries for certain uses.
Geography Analysis
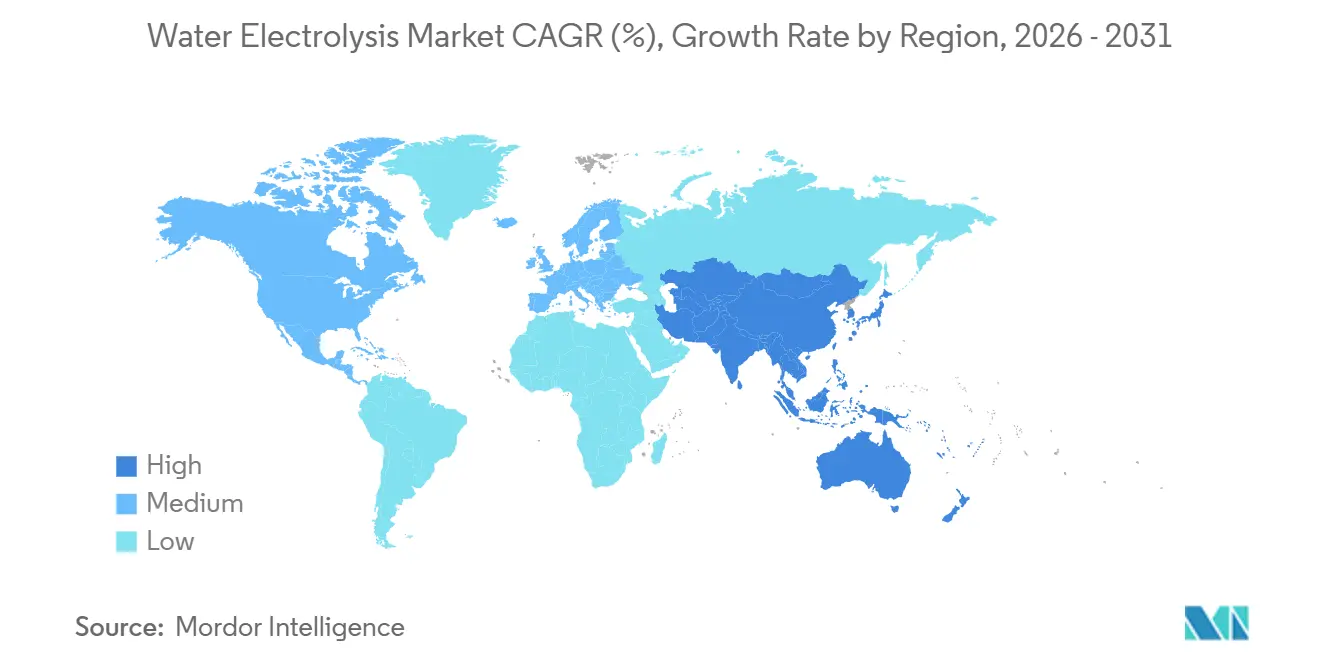
Europe held 31.5% of the water electrolysis market share in 2025. The region combines industrial demand, policy support, and public funding, and European installed electrolysis capacity reached 571 MWel by mid-2025. Average project size increased from 2.9 MWel in 2023-2024 to 18 MWel in 2024-2025. This indicates a move beyond small demonstrations toward larger industrial facilities.
Germany had 193 MW of operational capacity and 993 MW under construction in mid-2026. High electricity costs make public funding and lower-cost supply routes important to the country’s project pipeline. Germany’s Hydrogen Acceleration Act, approved in October 2025, covered permitting across production, terminals, storage, and pipelines. The planned 9,700 km Kernnetz network is expected to connect northern production areas with industrial demand centers by 2032, while Spain is gaining relevance through Moeve’s Huelva facility.
Asia-Pacific is the fastest-growing regional water electrolysis market at a 9.2% CAGR through 2031. China accounted for nearly three-quarters of new global electrolyzer installations in 2025. Its alkaline manufacturing scale supports a cost-led model but also increases competitive pressure. India is developing export-oriented hydrogen projects, including AM Green’s planned 1.3 GW electrolyzer deployment in Kakinada. North America is shaped by the U.S. Section 45V credit, while Canadian projects can draw on lower-carbon electricity grids and South American port locations such as Pecém and Suape are pursuing export opportunities. The Middle East and Africa combine low-cost solar resources with ammonia export programs and large alkaline project proposals.

Competitive Landscape
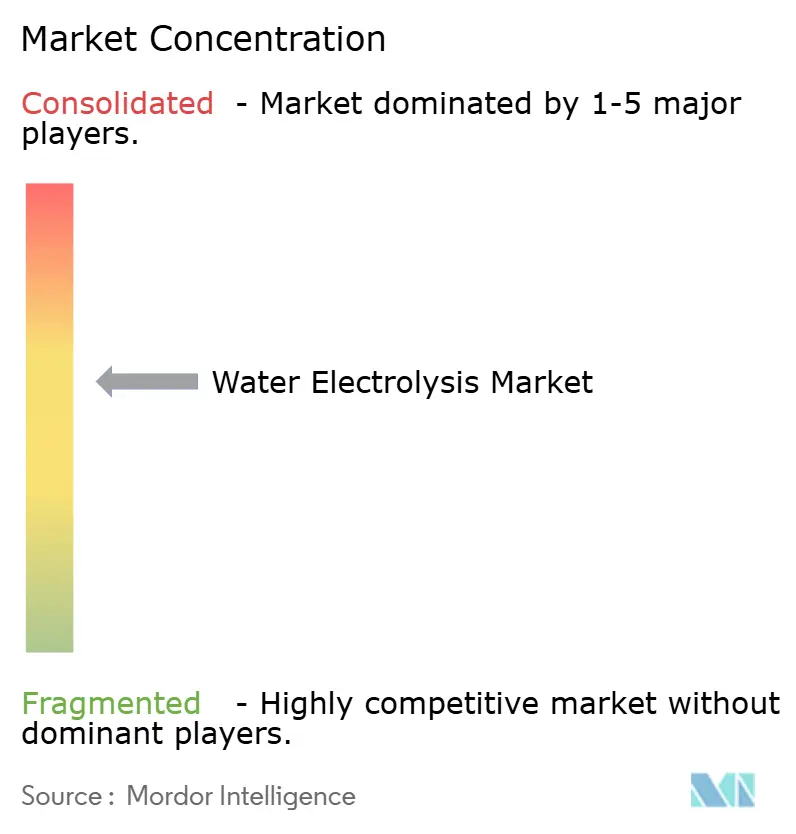
The water electrolysis market is moderately concentrated and has a cost-led alkaline supply base and a technology-led PEM and SOEC supply base. Chinese manufacturers compete strongly on price and delivery scale in alkaline systems, where cost engineering, large-scale production, and the ability to meet short equipment delivery schedules remain important factors in vendor selection. European and other international suppliers seek differentiation through efficiency, reliability, engineering capability, project support, and the ability to integrate equipment with wider plant design, power arrangements, and customer performance commitments. No company was reported to hold more than a mid-teens global revenue share, which means procurement decisions can still be contested by several credible vendors despite the growing advantage held by manufacturers with larger production capacity. Larger manufacturing capacity can improve procurement leverage and reduce unit costs, making it more difficult for small suppliers to compete for large projects.
OEM and engineering partnerships have become an important competitive response in the water electrolysis market. Nel ASA entered a collaboration agreement with Samsung E&A in March 2025, and Samsung E&A acquired a 9.1% interest in Nel. The arrangement links electrolyzer technology with plant engineering and project delivery, responding to buyer demand for a coordinated package that can address equipment performance, site integration, construction execution, and the conditions required for financing. thyssenkrupp nucera’s 300 MW contract for Moeve shows the value of standardized industrial modules for large facilities. John Cockerill’s 1.3 GW order from AM Green also shows that suppliers with local manufacturing and execution plans can secure large commitments.
Technology development remains important alongside manufacturing scale, and PEM suppliers must reduce exposure to iridium constraints as deployment grows because material availability can affect both future system cost and the practicality of very large deployment plans. AEM developers are pursuing flexible applications without using iridium, and Enapter’s Rotterdam project provides an example of this route to industrial validation. Nel’s planned industrialization of a next-generation pressurized alkaline platform is another example of suppliers pursuing lower cost and a smaller physical footprint. The water electrolysis industry is moving toward equipment innovation, project execution, regional manufacturing presence, and commercial models that provide industrial buyers with clearer output commitments and fewer unmanaged delivery risks.
Water Electrolysis Industry Leaders
thyssenkrupp nucera AG and Co. KGaA
Siemens Energy AG
John Cockerill
Nel ASA
Cummins Inc.
- *Disclaimer: Major Players sorted in no particular order

Recent Industry Developments
- April 2026: John Cockerill completed the installation of four 25 MW alkaline electrolyzers at the HyOffWind project in the Port of Zeebrugge, Belgium, expected to produce up to 3,700 tons of green hydrogen annually and reduce CO₂ by 25,000 tons per year.
- March 2026: thyssenkrupp nucera signed an engineering, procurement, fabrication, and supply contract with Moeve for 300 MW of alkaline electrolyzer equipment at Onuba, Huelva, Spain. The project is designed to produce 45,000 tons of green hydrogen and reduce CO₂ by 250,000 tons annually.
- December 2025: Nel ASA’s board approved the investment decision to industrialize its next-generation pressurized alkaline platform at Herøya, Norway. Initial annual capacity is 1 GW and is planned to scale to 4 GW.
- March 2025: Nel ASA and Samsung E&A signed a collaboration agreement. Samsung E&A also acquired a 9.1% stake in Nel and will integrate Nel technology into its CompassH2 hydrogen plant offering.


Global Water Electrolysis Market Report Scope
Water electrolysis is an electrochemical process that uses electricity to split water (H₂O) into hydrogen (H₂) and oxygen (O₂). The process takes place in an electrolyzer containing electrodes and an electrolyte or membrane. When electricity is applied, water molecules undergo oxidation and reduction reactions, producing hydrogen at the cathode and oxygen at the anode.
The Water Electrolysis Market is segmented by technology, hydrogen production capacity, end use, and geography. By technology, the market is segmented into alkaline electrolyzers, PEM electrolyzers, solid oxide electrolyzer cells (SOEC), and anion exchange membrane (AEM) electrolyzers. By production capacity, the market is segmented into below 500 L/hr, 500–2,000 L/hr, and above 2,000 L/hr. By end use, the market is segmented into chemicals, oil & gas and refining, power & utilities, transportation, industrial manufacturing, and other end uses. The report also covers the market size and forecasts for the global water electrolysis market across 26 countries in key regions. For each segment, the market sizing and forecasts have been provided on the basis of value (USD).
| Alkaline Electrolyzer |
| PEM Electrolyzer |
| Solid Oxide Electrolyzer Cell (SOEC) |
| Anion Exchange Membrane (AEM) Electrolyzer |
| Below 500 L/hr |
| 500–2,000 L/hr |
| Above 2,000 L/hr |
| Chemicals |
| Oil & Gas and Refining |
| Power & Utilities |
| Transportation |
| Industrial Manufacturing |
| Electronics & Semiconductors |
| Energy Storage |
| Other End Users |
| North America | United States |
| Canada | |
| Mexico | |
| Europe | Germany |
| France | |
| Italy | |
| Spain | |
| United Kingdom | |
| Poland | |
| Russia | |
| Rest of Europe | |
| Asia-Pacific | China |
| India | |
| Japan | |
| South Korea | |
| Australia | |
| Indonesia | |
| Vietnam | |
| Thailand | |
| Rest of Asia-Pacific | |
| South America | Brazil |
| Argentina | |
| Chile | |
| Rest of South America | |
| Middle East and Africa | Saudi Arabia |
| United Arab Emirates | |
| Egypt | |
| South Africa | |
| Morocco | |
| Rest of Middle East and Africa |
| By Technology | Alkaline Electrolyzer | |
| PEM Electrolyzer | ||
| Solid Oxide Electrolyzer Cell (SOEC) | ||
| Anion Exchange Membrane (AEM) Electrolyzer | ||
| By Hydrogen Production Capacity | Below 500 L/hr | |
| 500–2,000 L/hr | ||
| Above 2,000 L/hr | ||
| By End Use | Chemicals | |
| Oil & Gas and Refining | ||
| Power & Utilities | ||
| Transportation | ||
| Industrial Manufacturing | ||
| Electronics & Semiconductors | ||
| Energy Storage | ||
| Other End Users | ||
| By Geography | North America | United States |
| Canada | ||
| Mexico | ||
| Europe | Germany | |
| France | ||
| Italy | ||
| Spain | ||
| United Kingdom | ||
| Poland | ||
| Russia | ||
| Rest of Europe | ||
| Asia-Pacific | China | |
| India | ||
| Japan | ||
| South Korea | ||
| Australia | ||
| Indonesia | ||
| Vietnam | ||
| Thailand | ||
| Rest of Asia-Pacific | ||
| South America | Brazil | |
| Argentina | ||
| Chile | ||
| Rest of South America | ||
| Middle East and Africa | Saudi Arabia | |
| United Arab Emirates | ||
| Egypt | ||
| South Africa | ||
| Morocco | ||
| Rest of Middle East and Africa | ||


Key Questions Answered in the Report
What is driving demand for water electrolysis?
Industrial users need lower-emissions hydrogen for refining, ammonia, chemicals, and hydrogen-based fuels. Public policy and renewable-power integration also support project development.
How large is the water electrolysis market in 2026?
The market is estimated at USD 7.81 billion in 2026 and is projected to reach USD 11.43 billion by 2031.
Which electrolyzer technology is used most widely?
Alkaline electrolyzers held 54.8% share in 2025 because of their established industrial use and lower capital requirements.
Which electrolyzer technology is growing fastest?
PEM technology is projected to grow at a 9.4% CAGR through 2031, supported by flexible operation and high-purity hydrogen output.
Which end use is growing fastest for electrolytic hydrogen?
Oil & gas and refining is forecast to grow at a 9.1% CAGR through 2031 because refining processes require hydrogen for hydrotreating and desulfurization.
Which region is growing fastest through 2031?
Asia-Pacific is expected to grow at a 9.2% CAGR, supported by China’s manufacturing scale and India’s hydrogen procurement pipeline.
Page last updated on:


 Your data is secure and never sold or shared.


