Washing Machine Market Size and Share
Market Overview
| Study Period | 2020 - 2031 |
|---|---|
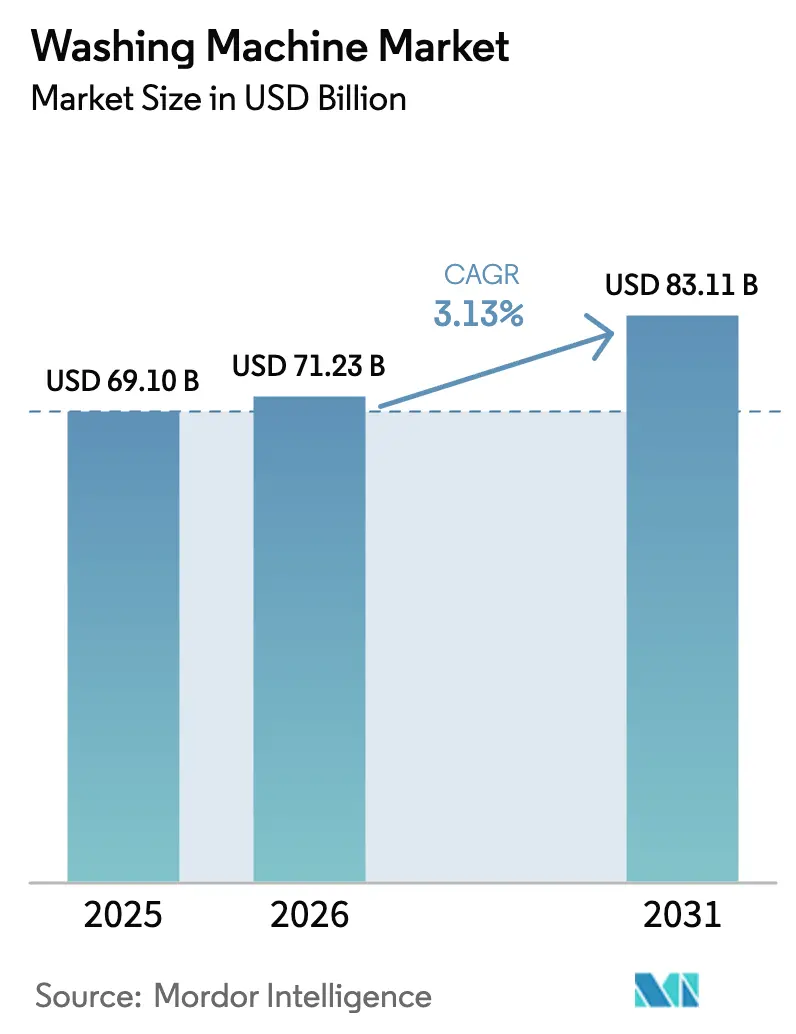
| Market Size (2026) | USD 71.23 Billion |
| Market Size (2031) | USD 83.11 Billion |
| Growth Rate (2026 - 2031) | 3.13% CAGR |
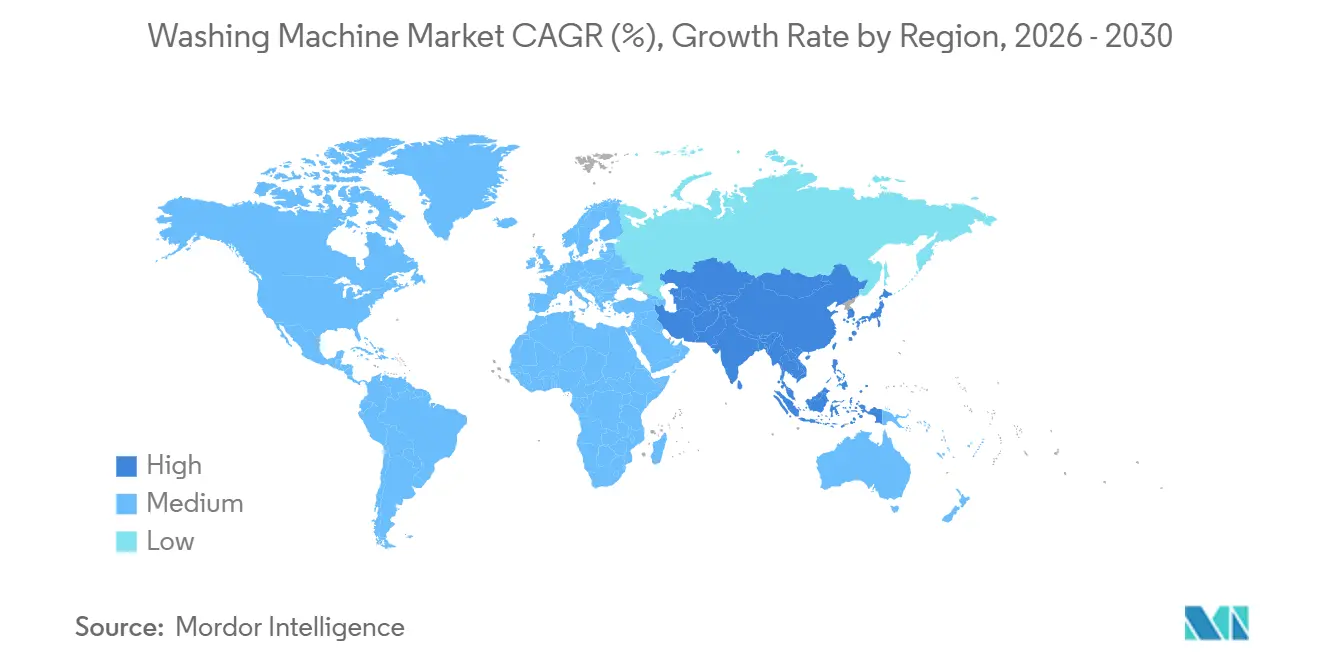
| Fastest Growing Market | Asia Pacific |
| Largest Market | Asia Pacific |
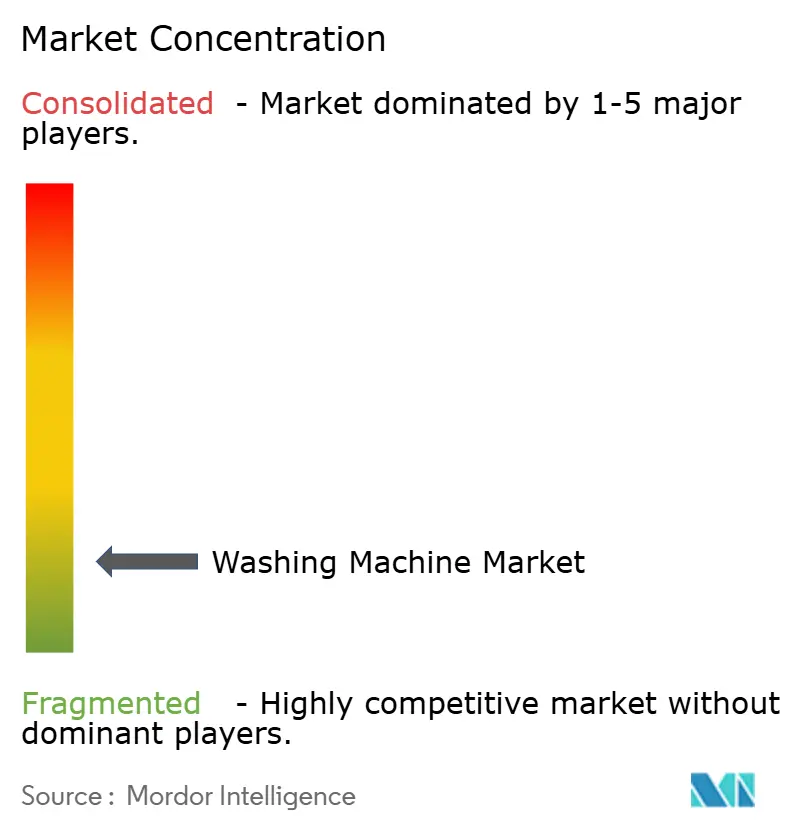
| Market Concentration | Low |
Major Players *Disclaimer: Major Players sorted in no particular order Image © Mordor Intelligence. Reuse requires attribution under CC BY 4.0. | |
Washing Machine Market Analysis by Mordor Intelligence
The global washing machine market size is expected to grow from USD 69.10 billion in 2025 to USD 71.23 billion in 2026 and is forecast to reach USD 83.11 billion by 2031, growing at a CAGR of 3.13% over 2026–2031. Front-loaders continue to hold the lead on installed base and resource efficiency, while top-loaders gain momentum on faster cycles and price positioning in value-conscious segments. Demand is shaped by rule-tightening in energy and water performance, microfibre filtration policies that nudge compliant designs, and right-to-repair frameworks that extend lifecycles and shift value into after-sales services. Digital features that automate dosing, sense fabrics, and schedule around dynamic tariffs reinforce premiumization, particularly when tied to brand ecosystems. Omnichannel distribution broadens reach in Asia-Pacific, where online sales scale quickly, encouraging localized inventory and faster order-to-install timelines to close the last-mile gap for bulky appliances. Compliance-led differentiation and smart-grid integration are strengthening the upgrade case for advanced models in the global washing machine market.
Key Report Takeaways
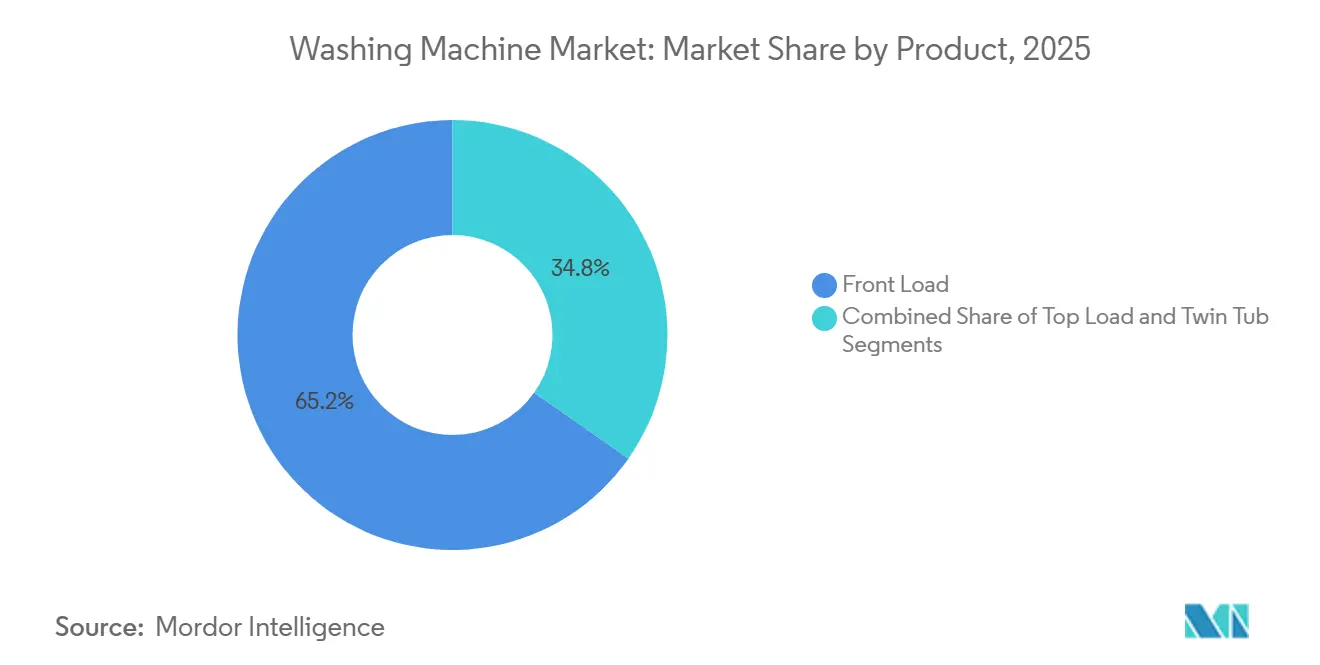
- By product type, front-load machines led with 65.92% share of the washing machine market in 2025. Top-load washers are projected to expand at a 4.62% CAGR through 2031.
- By capacity, the 6–8 kg segment accounted for 45.81% share of the washing machine market in 2025. The same 6–8 kg segment is projected to grow at a 4.91% CAGR through 2031.
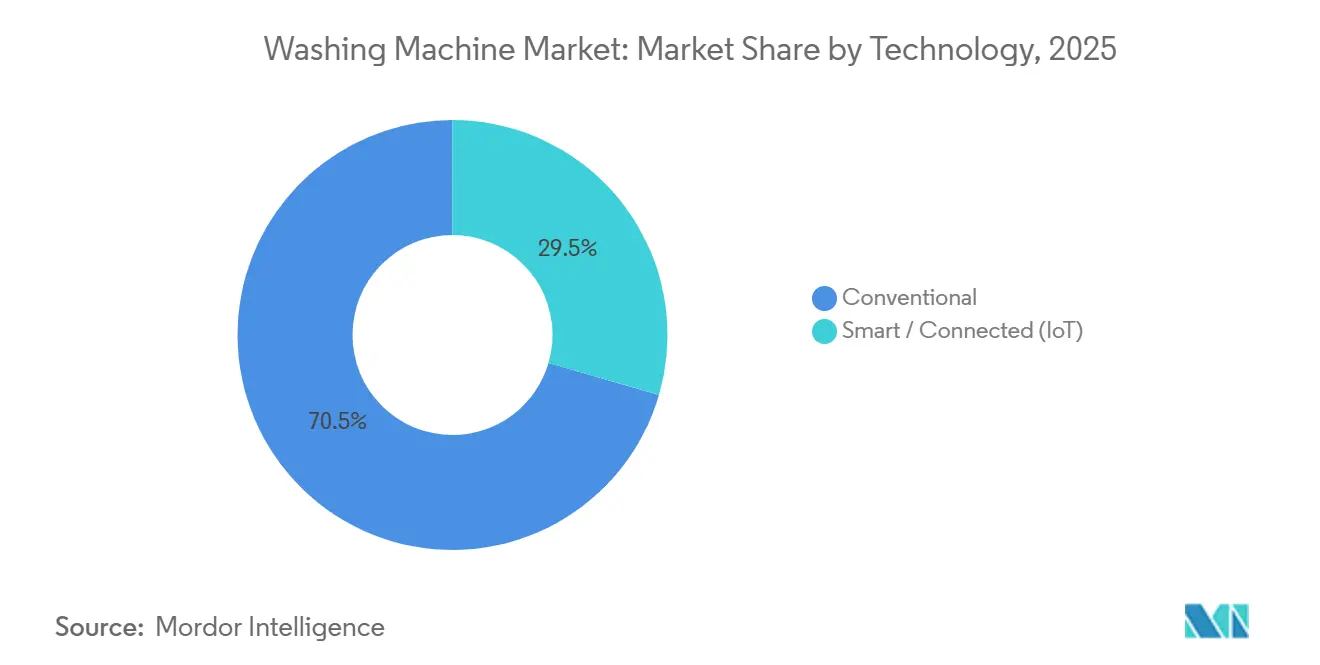
- By technology, conventional washers held a 70.54% share of the washing machine market in 2025 and are projected to advance at a 5.16% CAGR through 2031
- By end-user, residential applications represented a 69.74% share of the washing machine market in 2025. Commercial applications are projected to grow at a 5.38% CAGR through 2031.
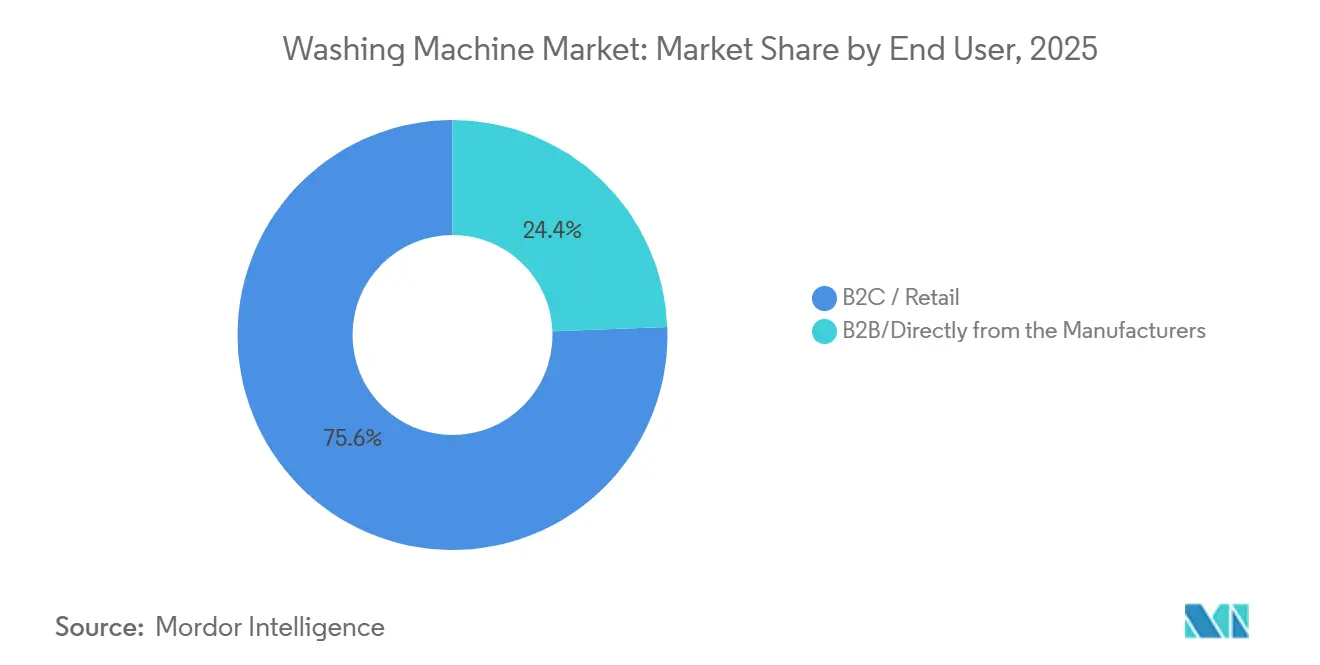
- By distribution channel, B2C retail captured a 75.61% share of the washing machine market in 2025. Online channels are projected to record a 5.91% CAGR through 2031.
- By geography, Asia-Pacific led with a 40.71% share in 2025. Asia-Pacific is projected to grow at a 3.39% CAGR through 2031.
Note: Market size and forecast figures in this report are generated using Mordor Intelligence’s proprietary estimation framework, updated with the latest available data and insights as of January 2026.
Global Washing Machine Market Trends and Insights
Drivers Impact Analysis*
| Driver | (~) % Impact on CAGR Forecast | Geographic Relevance | Impact Timeline |
|---|---|---|---|
| Regulatory-Driven Replacement Toward High-Efficiency, Low-Water Washers | +0.8% | Global, with early gains in the European Union, California, and New York | Medium term (2–4 years) |
| First-Time Adoption Among Expanding Middle-Class Households in the Asia-Pacific | +1.2% | Asia-Pacific core (India, Indonesia, Vietnam), spill-over to Middle East and Africa | Long term (≥ 4 years) |
| Premiumization Via Smart/Connected Features and Ecosystem Bundling | +0.6% | North America, Western Europe, urban Asia-Pacific | Short term (≤ 2 years) |
| Omnichannel And Online Retail are Accelerating Access and Price Discovery | +0.5% | Global, particularly tier-2 and tier-3 cities in India and China | Medium term (2–4 years) |
| Emerging Microfibre Filtration Mandates Favoring Compliant Designs | +0.3% | New York, California, Oregon (2030), France (2025), Australia (2030) | Long term (≥ 4 years) |
| Grid-Interactive, Demand-Response Capable Washers Unlocking Incentives | +0.2% | North America and the European Union with active demand response programs | Medium term (2–4 years) |
| Source: Mordor Intelligence | |||
Regulatory-Driven Replacement Toward High-Efficiency, Low-Water Washers
Standards and labeling frameworks are aligning toward lower energy and water footprints, which is bringing forward the replacement of older models and favoring premium, efficient designs. In the European Union, the rescaled A–G energy label and associated product requirements continue to ratchet down consumption, with the 2030 benchmark guiding new product development and marketing claims toward measurable household savings. This is expanding the addressable pool for efficient front-loaders that meet strict test procedures and verified performance documentation. In the United States, state-level initiatives on microfibre filtration, such as New York’s enacted bill requiring high-capture filters for fibers of defined size thresholds, increase compliance costs yet differentiate early movers that integrate proven filtration designs. As brands align product portfolios with these requirements, consumers see clearer life-cycle value from energy and water savings, which supports higher average selling prices without stalling adoption. These policy signals are translating into clearer upgrade pathways across price tiers in the global washing machine market[1]European Commission, “Rescaled A–G Energy Labels and 2030 Efficiency Benchmarks,” European Commission, ec.europa.eu.
Premiumization via Smart/Connected Features and Ecosystem Bundling
Feature sets that automate detergent dosing, identify fabric type, and schedule cycles around off-peak tariffs are expanding the price-to-value equation for connected washers and combos. Samsung’s Bespoke AI Laundry lineup ties AI Energy Mode and fabric-sensing logic to SmartThings, enabling automated energy optimization and cycle orchestration within a broader home ecosystem. Whirlpool has introduced a FreshFlow venting approach and advanced sealing to limit odors, while pairing with app features that reduce manual interventions and minimize rewash scenarios. LG’s AI Direct Drive 2.0 and ThinQ bring fabric detection, motion-control logic, and remote cycle control to multiple form factors, which is positioning connected washers as a clear step-up path from conventional models. Ecosystem bundling across laundry, refrigeration, and air conditioning strengthens lock-in effects for brands that harmonize software, accessories, and optional subscriptions. These premium attributes underpin a durable upgrade narrative in the global washing machine market as connectivity becomes an expected capability in higher-tier SKUs[2]Samsung Electronics, “Bespoke AI Laundry and AI Energy Mode,” Samsung Global Newsroom, news.samsung.com.
Omnichannel and Online Retail Accelerating Access and Price Discovery
Digital channels are compressing search and fulfillment frictions, especially in Asia-Pacific, where online penetration in washing machines already accounts for a large share and continues to grow at a double-digit rate. As more journeys blend online discovery with store visits and scheduled installations, brands can localize inventory and reduce order-to-install times to raise customer satisfaction in bulky appliances. Financing tools, live configuration help, and energy label cross-comparisons are easier to deploy online, which smooths the adoption of premium features beyond metro cores. Showroom formats that integrate QR-linked energy labels and guided demos have helped physical retail defend relevance with higher attach rates for extended warranties and accessories. This omnichannel architecture improves price transparency and lowers acquisition friction across urban and semi-urban markets, supporting wider reach for the global washing machine market.
Emerging Microfibre Filtration Mandates Favoring Compliant Designs
Textile-shedding awareness is rising, and early-adopter jurisdictions are moving toward filtration rules intended to curb the discharge of synthetic fibers. New York has enacted requirements for microfibre filtration that define capture performance, which is now a reference point for product roadmaps and retailer assortment planning across the United States. In Europe, heightened environmental scrutiny coexists with stringent energy labeling, encouraging brands to combine efficient wash action with fiber-capture solutions that are user-friendly and durable. Manufacturers have begun integrating reusable mesh elements or modular filter cartridges that are easy to maintain, and some companies now report filtration readiness in product literature to signal compliance preparedness. This positioning supports modest price premiums for compliant SKUs while reducing the risk of stranded inventory as effective dates approach. The shift is creating an additional layer of product differentiation in the global washing machine market, especially where public procurement or retailer standards prefer compliant designs[3]Samsung Electronics, “Bespoke AI Laundry and AI Energy Mode,” Samsung Global Newsroom, news.samsung.com.
Restraints Impact Analysis*
| Restraint | (~) % Impact on CAGR Forecast | Geographic Relevance | Impact Timeline |
|---|---|---|---|
| Price sensitivity and informal/used appliance competition in emerging markets | -0.6% | Asia-Pacific excluding Japan and South Korea, Sub-Saharan Africa, and parts of South America | Medium term (2–4 years) |
| Input cost volatility and supply chain disruptions are pressuring margins | -0.4% | Global, acute in semiconductor-reliant smart models | Short term (≤ 2 years) |
| Water scarcity constraints and wastewater fees are dampening usage | -0.2% | Middle East and Africa, parts of India, and Australia | Long term (≥ 4 years) |
| Right-to-repair and longevity policies elongating replacement cycles | -0.3% | European Union, California, and potential federal United States adoption | Long term (≥ 4 years) |
| Source: Mordor Intelligence | |||
Input Cost Volatility and Supply Chain Disruptions Pressuring Margins
Electronics content in connected washers makes them sensitive to component lead times and logistics, which can swing sharply during tight supply conditions. Manufacturers with deeper integration in controls and boards, or with localized board production, can shorten procurement cycles and curb air freight exposure, which stabilizes unit economics. Where original equipment makers diversify production footprints and supplier bases, they mitigate tariff and freight volatility that can otherwise erode gross margins. Large players that disclose on-time-in-full metrics and resilience actions note more predictable throughput for launch cycles that rely on specific motor controllers, sensors, and connectivity modules. Such measures help maintain consistent availability of premium SKUs while defending price points during component cost spikes. The net effect is a sustained incentive to localize critical subassemblies and spread risk in the global washing machine market.
Right-to-Repair and Longevity Policies Elongating Replacement Cycles
Durability and repairability rules that lock in spare-part availability and documentation are extending service lives, which lowers the natural replacement rate for residential washers. These measures increase long-run value for consumers and shift margins into parts and service, which favors brands with robust service networks. Product managers must balance sturdier builds and modular assemblies against cost targets to avoid pricing out mainstream shoppers. Retailers adjust inventory toward repair-ready models to reduce warranty disputes and to align selection with after-sales capacity. Over time, such rules reward vertically integrated brands that can monetize extended lifecycles across authorized service and refurbished channels. The global washing machine market will continue to adapt product and channel playbooks to align with longevity objectives while sustaining innovation and price competitiveness.
*Our forecasts treat driver/restraint impacts as directional, not additive. The impact forecasts reflect baseline growth, mix effects, and variable interactions.
Segment Analysis
By Product Type: Top-Loads Propel Omnichannel Volume Amid Heat-Pump Combo Ascent
Front-load washers commanded 65.92% of the global washing machine market share in 2025, driven by superior resource efficiency and higher final spin speeds that reduce residual moisture before drying. Top-loaders are projected to post a 4.62% CAGR through 2031 as value buyers seek shorter cycles and easier mid-cycle access, especially in markets where water costs and floor space are less constraining. The global washing machine market is channeling product development into washer-dryer combos with ventless heat-pump systems that cut energy use and eliminate the need for external vents in apartments. Flagship models from leading brands now integrate AI features that detect soil level and fabric type, which helps reduce rewash rates and strengthens the upgrade story in mid-to-premium price bands. In showrooms, transparent energy-label comparisons and live spin-speed demos help articulate differences between front-load and top-load designs for buyers who want performance clarity at the point of sale. Compliance with water and energy thresholds is easier with front-load designs, while top-loaders are improving via impeller redesigns, higher spin speeds, and smarter cycle logic. The global washing machine market benefits as both formats modernize to meet efficiency and convenience goals.
Cycle-speed expectations and form-factor constraints are reshaping assortments, with washer-dryer combos emerging as a space-saving path to premium energy performance. Samsung’s combo line illustrates how a single-drum product with heat-pump drying can achieve significant energy reductions while fitting urban apartments, and pricing strategies that include periodic discounts and financing lower adoption barriers for first-time buyers of combo systems. Brands are also building use-case features, such as enhanced odor control or pet-hair cycles, to address specific household needs without requiring add-on equipment. Regulatory expectations remain a key design anchor, with front-loaders natively aligned to stricter water factors and top-loaders catching up via mechanical and software refinements. Proposed recalibrations of water-use standards in the United States could create more room for cycle-time optimization, which would support the resurgence of top-load adoption where speed and simplicity matter most. Across formats, integrated AI that tunes dosage and motion patterns by fabric class is becoming a baseline differentiator, which continues to shape premium product positioning in the global washing machine market[4]Federal Register, “Energy and Water Standards Rulemaking Dockets,” Federal Register, federalregister.gov.


By Capacity: Mid-Range 6–8 kg Anchors Volume, Above-8-kg Captures Commercial Upside
The 6–8 kg capacity bracket accounted for 45.81% of 2025 sales, balancing space efficiency and family load flexibility at accessible price points. The segment is projected to grow at a 4.91% CAGR through 2031 as more dual-income households consolidate laundry time into fewer cycles, and as urban floor plans favor 24–27-inch platforms that fit standard closets and laundry alcoves. The global washing machine market size for the 6–8 kg segment is set to rise with this steady volume expansion and consistent upgrade to automatic dosing and faster spins near the segment’s mid-tier. Compact formats below 5 kg remain a niche for dorms and single-occupancy homes, valued for portability but constrained by lower spin performance and manual fill trade-offs. At the high end, above-8-kg units have increased traction among larger households and light-commercial environments that benefit from one-and-done loads and robust motors.
Feature upgrades are cascading down into the 6–8 kg tier, including dosing reservoirs sized for multiple washes and mobile apps that simplify maintenance prompts and cycle selection. Bosch’s 24-inch compact portfolio demonstrates how connected features and auto-dosing can be adapted for small-space use, which widens premium appeal in dense cities. Water-scarce regions steer toward front-load designs within the 6–8 kg tier due to lower consumption per kilogram, while water-abundant or price-sensitive markets still mix in higher-capacity top-loaders. Australia’s updated energy-rating requirements are raising the visibility of cycle time and power draw on labels, which nudges makers toward higher spin speeds to reduce drying time without compromising wash quality. As OEMs localize more components and testing, lead times keep improving for private-label and regional brands that rely on stable 6–8 kg volumes as their core. The global washing machine industry continues to size and tune this segment for mainstream adoption while reserving specialized features for super-capacity and combo models.
By Technology: Conventional Consolidates Despite Smart Ascent; Price-Performance Gaps Persist
Conventional non-connected washing machines, which include fully automatic and semi-automatic units without IoT or app-based controls, commanded 70.54% of the global washing machine market share in 2025 and are projected to grow at a 5.16% CAGR through 2031 as value-focused buyers in tier-two and tier-three cities in India, Indonesia, and Vietnam prioritize upfront affordability over connectivity. This pattern reflects the large installed base across underserved geographies where small gains in penetration create sizable absolute volume, which can exceed the unit additions from smart models that are scaling from a smaller base. In India, trade-in subsidies and ongoing price compression have supported the shift toward fully automatic conventional units as inverter motors and load-sensing logic spread without requiring Wi-Fi. The resulting price-performance profile keeps conventional formats attractive for households that want dependable cycles, predictable running costs, and straightforward controls.
Conventional machines continue to add practical intelligence at accessible prices. LG’s India-focused Essential Series uses dual-inlet valves and resin-coated drums to manage hard water and low inlet pressure, which helps address infrastructure constraints without adding connectivity or cloud features. Mainstream top-loaders in Southeast Asia pair inverter direct-drive motors with familiar pre-set cycles that handle common fabrics and soil levels with minimal setup. These additions improve efficiency and wash consistency while keeping the bill of materials in check. The result is a clear value story for buyers who want durability and ease of use over remote control or app-based scheduling. In markets where broadband coverage, data costs, or app adoption remain uneven, this balance of capability and cost sustains the momentum of conventional formats within the global washing machine market.
Smart and IoT-connected washers remain a minority of the installed base but are growing quickly from a smaller foundation in the global washing machine market. Samsung’s AI OptiWash and AI Energy features center on sensing soil levels, tuning water and time, and shifting operation to off-peak windows, while Whirlpool’s Load & Go dosing is designed to reduce detergent waste and improve wash consistency across cycles. Policy context also matters. In May 2025, the U.S. Department of Energy proposed rescinding amended water-use standards for residential clothes washers, which would revert to the statutory 9.5 water-factor and lessen pressure to pair efficiency positioning with connected features that add cost. As interoperable standards expand, BSH’s early work with Matter demonstrates how multi-platform control can feel universal, which may compress the connectivity premium over time and shift competition back to hardware performance, service quality, and total cost of ownership.
By End-User: Residential Anchors, Commercial Outpaces on Hygiene and Throughput Needs
Residential applications represented 69.74% of 2025 demand for steady replacement cycles and expanding upgrade paths into dosing automation and connectivity. Commercial applications are projected to grow at a 5.38% CAGR through 2031 as hotels, healthcare facilities, and multi-housing operators refresh fleets to enhance hygiene, uptime, and energy savings. The global washing machine market benefits from commercial buyers that prioritize throughput and reliability, which supports larger-capacity units, robust drive systems, and connected diagnostics. In many cities, multi-housing developers use centralized laundry rooms to cut plumbing costs per unit and to create ancillary revenue streams from cashless, app-based payment systems.
Commercial buyers often prefer service-level agreements that guarantee rapid technician response and access to loaner equipment, which lifts fleet uptime and stabilizes operating margins. Smart diagnostics and predictive maintenance reduce unplanned downtime and spare-parts inventory, which is especially valuable for 20–50 kg machines that anchor daily operations. Healthcare and hospitality applications reinforce the case for barrier designs and enhanced disinfection cycles that audit logs can verify. Across both residential and commercial uses, the migration to fully automatic drives continued, while connectivity features scaled faster in commercial due to clearer payback tied to energy and labor. These differences shape roadmaps that tune motor control, user interfaces, and serviceability to each setting in the global washing machine market.
By Distribution Channel: Online Surges, B2C Retail Defends via Experience
B2C retail captured 75.61% of 2025 sales on the strength of live demos, noise comparisons, and same-day or next-day installation that eases buyer concerns. Online channels are projected to grow at a 5.91% CAGR, leveraging rapid delivery expansion, energy-label transparency, and financing offers that pull premium models into reach for value buyers. The global washing machine market size for online channels is set to rise as marketplaces refine last-mile services and as brand stores invest in direct-to-consumer models with tight control over pricing and bundles. In-store showrooms remain important for tactile checks and cross-brand comparisons, and brands are enhancing retail with QR-linked energy data and tailored consultations that personalize cycle settings.
Exclusive branded outlets scale footprint to deliver consistent experiences around AI features and to extend warranty coverage when bundled at checkout. Leading retailers pair assortment breadth with private-label financing to smooth purchase decisions for mid-tier and premium SKUs. Brands also tie trade-in credits and refurbishment programs to their own channels, recovering value from old appliances while strengthening the path to new sales. Samsung’s large-format experiences and online stores coordinate with promotions that highlight combo units and connectivity features, and this tightens control over the product narrative. This balanced omnichannel mix continues to support share stability across formats in the global washing machine industry.
By Distribution Channel: Online Growth Reshapes Retail Landscape
B2C retail captured 75.61% of 2025 sales on the strength of live demos, noise comparisons, and same-day or next-day installation that eases buyer concerns. Online channels are projected to grow at a 5.91% CAGR, leveraging rapid delivery expansion, energy-label transparency, and financing offers that pull premium models into reach for value buyers. The global washing machine market size for online channels is set to rise as marketplaces refine last-mile services and as brand stores invest in direct-to-consumer models with tight control over pricing and bundles. In-store showrooms remain important for tactile checks and cross-brand comparisons, and brands are enhancing retail with QR-linked energy data and tailored consultations that personalize cycle settings.
Exclusive branded outlets scale footprint to deliver consistent experiences around AI features and to extend warranty coverage when bundled at checkout. Leading retailers pair assortment breadth with private-label financing to smooth purchase decisions for mid-tier and premium SKUs. Brands also tie trade-in credits and refurbishment programs to their own channels, recovering value from old appliances while strengthening the path to new sales. Samsung’s large-format experiences and online stores coordinate with promotions that highlight combo units and connectivity features, and this tightens control over the product narrative. This balanced omnichannel mix continues to support share stability across formats in the global washing machine industry.
Geography Analysis
Asia-Pacific led with 40.71% share in 2025 and is projected to grow at a 3.39% CAGR through 2031 as urbanization, digital commerce, and localized manufacturing capacity align across major economies. China remains the region’s largest country market and is transitioning from volume replacement toward premium-connected features as households trade up to AI-enabled models. India’s strong consumption momentum supports broader adoption of fully automatic washers and localized product lines that address variable water pressure and hard water, aided by investments in domestic component manufacturing and printed circuit board capacity to reduce lead times. Online shares across key Asia-Pacific markets are high and rising, which prompts brands to localize inventory and partner for installation to maintain delivery speed and quality. Australia’s updated GEMS framework elevates the visibility of energy and water performance and program time on labels, which supports broader adoption of front-loaders and heat-pump combos in water-stressed regions. The global washing machine market benefits from scale effects across Asia-Pacific as component ecosystems and logistics densify.
Europe is the second-largest region by contribution and is one of the fastest-growing developed markets due to stringent energy labeling and rising repairability expectations that redefine premium value. The European Union’s rescaled A–G labels set a clear hierarchy for energy performance, and the 2030 benchmark for energy use guides engineering targets for next-generation washers. Western Europe’s retailer assortments are moving early toward compliant SKUs to avoid stranded inventory risk, which rewards early movers that pre-comply with upcoming rules on filtration or repairability. The United Kingdom and Nordic countries show strong momentum for heat-pump drying and efficient laundry solutions where electricity tariffs favor reduced consumption, and households increasingly consider life-cycle costs when selecting appliances. Large European makers disclose alignment with repairability and longevity goals, while assembling connected features that integrate with common smart-home platforms. This policy and retailer structure sustains steady premiumization in the global washing machine market across Europe.
North America maintains a balanced growth profile at roughly the global pace, with steady replacement cycles and rising expectations for smart-home compatibility. Leading brands have announced capacity and technology investments in United States plants to strengthen supply resilience and support product lines tied to renewable energy sourcing at sites. Demand-response ready features are gaining visibility as utilities expand dynamic tariffs and rebate eligibility for connected appliances that automate off-peak operation. In Canada and the United States, brand stores and multi-brand retailers continue to anchor the path to purchase for larger capacity models, while direct-to-consumer channels layer in flexible financing and accelerated fulfillment. Mexico’s role in North American manufacturing networks has expanded, offering tariff-resilient options and shorter logistics legs for regional demand. This regional ecosystem supports the long-run installed base and upgrade cadence in the global washing machine market.

Competitive Landscape
Competition remains broad-based across multinational brands and regional challengers, with differentiation moving beyond hardware toward AI-enabled care, dosing accuracy, and energy optimization. Samsung’s latest laundry lineup deploys AI Energy Mode and fabric sensing to refine cycle control and reduce energy consumption during peak windows, which complements smart-home ecosystems that include air conditioning and refrigeration. LG continues to scale AI Direct Drive across formats, integrating motion control and fabric detection with the ThinQ app to elevate ease of use and care outcomes. Whirlpool invests in United States operations that reinforce vertical integration and capacity for high-demand lines, while extending features like advanced venting and dosing reservoirs to maintain premium positioning. These moves converge on lifecycle savings and convenience that resonate with connected-home buyers in the global washing machine market.
Compliance positioning is an active lever as brands seek to secure retailer floor space with SKUs that meet or exceed upcoming rules on energy performance, filtration, and repairability. Early compliance lowers assortment risk for large chains and simplifies messaging to shoppers by aligning labels and claims across models. European makers with early Matter connectivity emphasize interoperability and privacy assurances, while planning for durability features that enable module-level repair rather than whole-unit swaps. In the United States, filtration policy momentum and demand-response eligibility strengthen the argument for connected washers that integrate with utility programs and home energy management systems. The pattern supports gradual convergence toward smart, repairable, and efficient designs that hold value beyond the initial purchase. This alignment is now central to premium-tier competition in the global washing machine market.
Channel strategies are adapting to a hybrid world where physical retail and digital journeys reinforce each other. Branded stores deliver curated demos for AI cycles and filtration elements, while online channels streamline comparisons and scheduling, and reduce friction with financing that broadens access to premium features. Service networks are a larger piece of the value proposition in markets with stronger repair rights, which favors players with authorized technicians, parts logistics, and refurbishment programs that monetize the extended tail. With connected diagnostics proliferating, time to resolution is improving, and that increases customer satisfaction and repeat intent. These developments, combined with compliance readiness and ecosystem tie-ins, frame the current wave of competitive differentiation in the global washing machine market.
Washing Machine Industry Leaders
Haier Smart Home
Midea Group
Whirlpool Corporation
LG Electronics
Samsung Electronics
- *Disclaimer: Major Players sorted in no particular order

Recent Industry Developments
- January 2026: Whirlpool Corporation showcased its Maytag Pet Pro Top Load Laundry System and a new front-load tower with FreshFlow Vent System and UV Clean at KBIS 2026, underscoring the breadth of its United States manufacturing and product portfolio.
- January 2026: Samsung Electronics unveiled its AI-powered Bespoke AI Laundry lineup at CES 2026, including faster wash-to-dry cycles in combo models, enhanced heat exchangers, and a new LCD jog-dial variant positioned below touchscreen flagships on price.
- December 2025: LG Electronics launched ten new AI DD 2.0 washing machines across front-load, top-load, and washer-dryer categories with enhanced fabric sensing, dedicated pet-care cycles, and up to 16 kg capacity.
- January 2025: Samsung highlighted an A-65% Bespoke AI Washer at IFA 2025, featuring reduced energy consumption relative to class minimums and a second-generation combo unit with higher drying capacity and faster cycles.


Research Methodology Framework and Report Scope
Market Definitions and Key Coverage
Our study defines the washing machine market as the worldwide sales value of newly manufactured household and light-commercial appliances that wash, rinse, and spin laundry, including front-load, top-load, twin-tub, and smart-connected models, but excluding aftermarket parts and professional laundromat equipment.
Scope exclusion: professional-grade tunnel washers and industrial washer-extractors are outside this study.
Segmentation Overview
- By Product Type
- Front Load
- With Dryers
- Without Dryers
- Top Load
- With Dryers
- Without Dryers
- Twin Tub
- Front Load
- By Capacity
- Below 5 kg
- 5 - 8 kg
- Above 8 kg
- By Technology
- Conventional
- Smart / Connected (IoT)
- By End-User
- Residential
- Commercial
- By Distribution Channel
- B2C/Retail
- Multi-brand Stores
- Exclusive Brand Outlets
- Online
- Other Distribution Channels
- B2B/Directly from the Manufacturers
- B2C/Retail
- By Geography
- North America
- Canada
- United States
- Mexico
- South America
- Brazil
- Peru
- Chile
- Argentina
- Rest of South America
- Europe
- United Kingdom
- Germany
- France
- Spain
- Italy
- BENELUX (Belgium, Netherlands, Luxembourg)
- NORDICS (Denmark, Finland, Iceland, Norway, Sweden)
- Rest of Europe
- Asia-Pacific
- India
- China
- Japan
- Australia
- South Korea
- South-East Asia
- Rest of Asia-Pacific
- Middle East & Africa
- United Arab Emirates
- Saudi Arabia
- South Africa
- Nigeria
- Rest of Middle East & Africa
- North America
Detailed Research Methodology and Data Validation
Primary Research
Mordor analysts interview appliance OEM planners, tier-1 component suppliers, regional distributors, and large electronics retailers across Asia-Pacific, North America, Europe, and MEA. These conversations validate average selling prices, replacement cycles, and smart-feature penetration that secondary sources only hint at.
Desk Research
We screen open datasets such as UN Comtrade customs codes (HS 8450), International Energy Agency appliance efficiency files, OECD household-appliance spending panels, and national statistics portals to size unit flows and price bands. Annual reports, investor decks, and 10-Ks supply brand-level revenue splits, which are reconciled in D&B Hoovers for consistent fiscal calendars. Trade journals, appliance associations, and Dow Jones Factiva news archives help trace technology shifts, tariff effects, and retail channel mixes. This list is illustrative; many additional sources underpin the desk research foundation.
Market-Sizing & Forecasting
A top-down model converts production, import, and export statistics into apparent consumption, followed by selective bottom-up cross-checks using sampled ASP x volume from retailer audits. Key variables include household penetration rates, average replacement interval, smart-connected share, steel and resin cost indices, and energy-efficiency regulations; their trajectories feed a multivariate regression that projects value through 2030. Where bottom-up estimates diverge, gap ratios are applied to align totals before final sign-off.
Data Validation & Update Cycle
Outputs pass a three-layer review: automated anomaly flags, senior-analyst peer review, and sector-head approval. Figures are compared with external price and shipment trackers, and any variance beyond two standard deviations triggers re-work. Reports refresh annually, with interim updates when tariffs, standards, or macro shocks materially shift inputs.
Why Mordor's Washing Machine Baseline Commands Reliability
Published market values often vary because firms pick different product scopes, price assumptions, and refresh cadences.
Major gap drivers include whether smart dryers are bundled, how gray-market imports are treated, which average price progression is used, and how frequently models are recalibrated for currency swings. Mordor's study fixes a single global scope, applies weighted regional ASPs, and updates every twelve months, which limits drift.
Benchmark comparison
| Market Size | Anonymized source | Primary gap driver |
|---|---|---|
| USD 69.10 B (2025) | Mordor Intelligence | - |
| USD 66.91 B (2025) | Global Consultancy A | Excludes twin-tub units; assumes flat ASP after 2027 |
| USD 87.25 B (2024) | Trade Journal B | Merges commercial laundromat equipment into total |
| USD 56.77 B (2024) | Industry Association C | Covers only conventional machines, omits smart-connected premium |
The comparison shows that when differing scopes and price curves are stripped away, our 2025 baseline offers a balanced middle ground, giving decision-makers a figure that is transparent, reproducible, and ready for scenario testing.


Key Questions Answered in the Report
What is the growth outlook for the global washing machine market through 2031?
The global washing machine market size is forecast to reach USD 83.11 billion by 2031, growing at a 3.13% CAGR over 2026–2031, supported by regulatory-driven efficiency upgrades and adoption of AI-enabled features.
Which product types and capacities are leading buyer preference today?
Front-loaders led with 65.92% share in 2025, while the 6–8 kg capacity band commanded 45.81% share on a balance of footprint and family load flexibility, with both segments supported by rising expectations for automated dosing and higher spin speeds.
Where is the fastest sales momentum by channel and end-user?
Online channels are projected to grow at a 5.91% CAGR on stronger logistics and financing, and commercial applications are projected at a 5.38% CAGR as hotels, healthcare, and multi-housing refresh fleets for hygiene, uptime, and energy savings.
How are policies shaping product roadmaps and pricing dynamics?
The European Union’s rescaled A–G labels and New York’s microfibre filtration rule are pushing compliant, efficient designs into assortments earlier, which raises per-unit value while clarifying life-cycle savings that justify premium pricing for compliant SKUs.
Which regions are expected to drive the largest share of demand?
Asia-Pacific led with 40.71% of 2025 demand and is projected to grow at a 3.39% CAGR through 2031 on urbanization, digital commerce, and localized manufacturing, while Europe remains a strong premiumization story under strict energy labeling.
Page last updated on:


