Market Overview
| Study Period | 2021 - 2031 |
|---|---|
| Forecast Data Period | 2026 - 2031 |
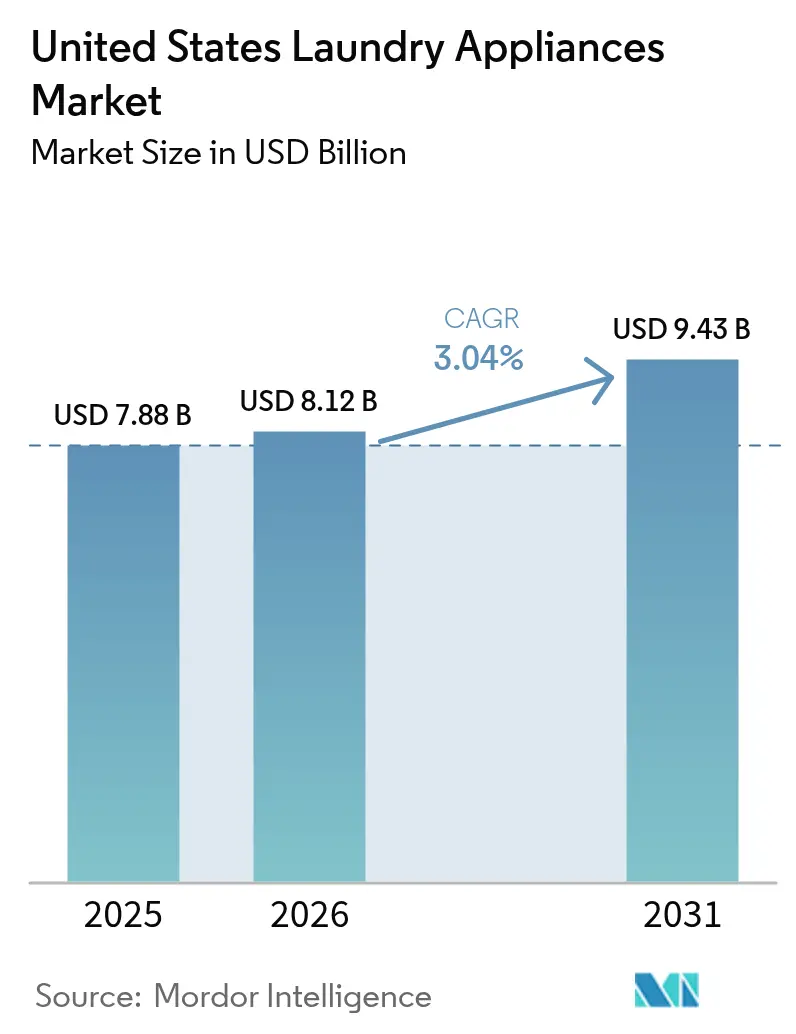
| Base Year Market Size (2025) | USD 7.88 Billion |
| Market Size (2026) | USD 8.12 Billion |
| Market Size (2031) | USD 9.43 Billion |
| Growth Rate (2026 - 2031) | 3.04% CAGR |
| Market Concentration | Medium |
Major Players *Disclaimer: Major Players sorted in no particular order Image © Mordor Intelligence. Reuse requires attribution under CC BY 4.0. | |
United States Laundry Appliances Market Analysis by Mordor Intelligence
The United States laundry appliances market size reached USD 7.88 billion in 2025, is expected to reach USD 8.12 billion in 2026, and is projected to reach USD 9.43 billion by 2031 at a CAGR of 3.04%. Measured growth masks a set of shifts now influencing how manufacturers price, source, and time product transitions in the United States laundry appliances market, led by the Department of Energy’s 2028 efficiency standards for washers and dryers and by the rising adoption of incentives targeting heat-pump dryer upgrades [1]Federal Register Editors, “Energy Conservation Standards for Residential Clothes Washers and Dryers,” Federal Register, federalregister.gov. Grid-interactive features, time-of-use rate plans, and local building codes that reward load shifting continue to tilt product design toward connected, high-efficiency platforms with quantifiable household savings. The policy mix is strongest in the West, where building codes and utility programs accelerate electrification and help explain the region’s 4.12% growth profile to 2031 in the United States laundry appliances market. On the supply side, domestic manufacturing footprints and near-term investments by leading brands aim to cushion input costs and logistics variability while positioning mid-priced heat-pump products for wider availability in the United States laundry appliances market by 2027.
Key Report Takeaways
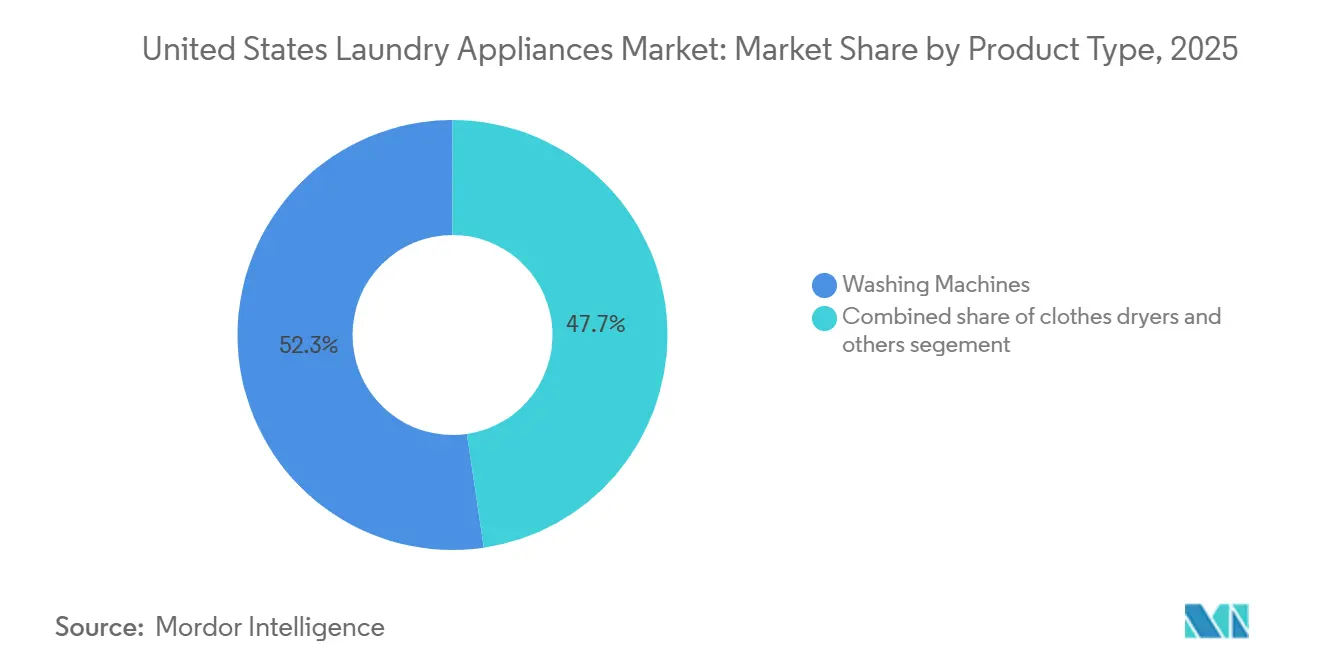
- By product type, washing machines led with 52.34% revenue share in 2025 in the United States laundry appliances market; clothes dryers are forecast to expand at a 3.71% CAGR through 2031.
- By technology, fully automatic machines commanded an 81.93% share in the United States laundry appliances market in 2025 and recorded the fastest projected CAGR of 3.14% through 2031.
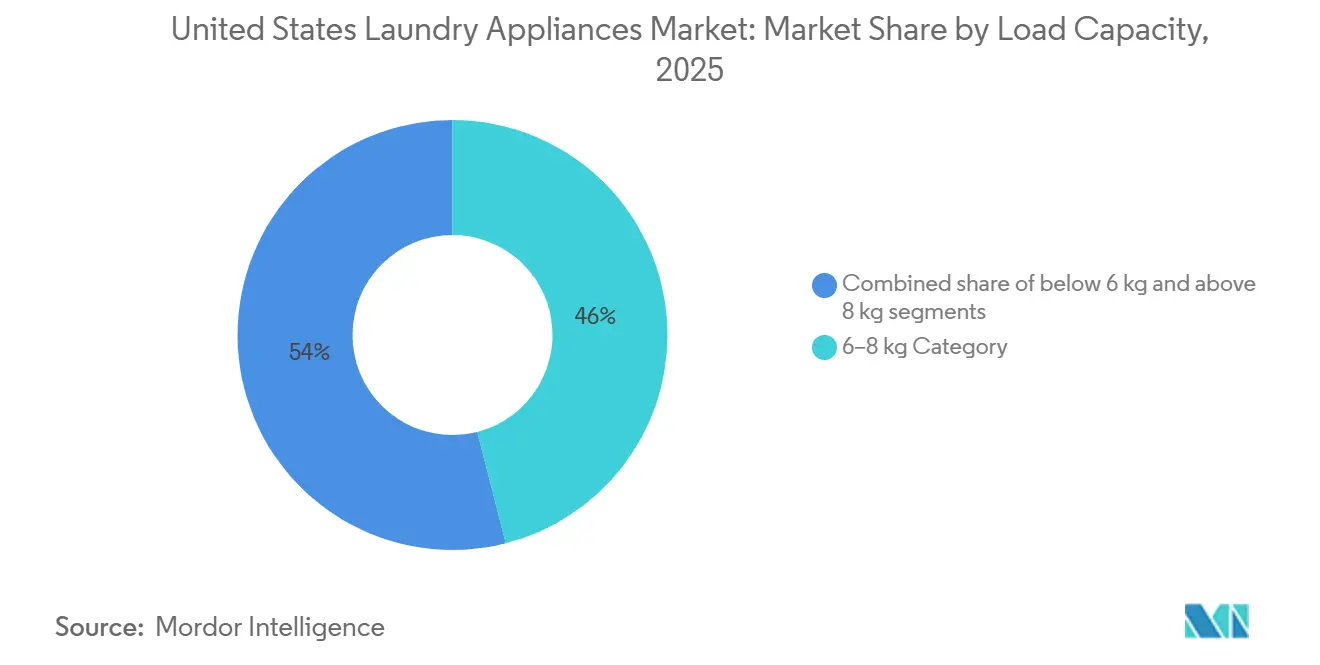
- By load capacity, the 6–8 kg segment accounted for 46.02% of the United States laundry appliances market in 2025; load capacities above 8 kg are projected to expand at a 3.42% CAGR through 2031.
- By distribution channel, multi-brand stores held 53.12% of the United States laundry appliances market share in 2025, while online channels recorded the highest projected CAGR at 3.12% through 2031.
- By geography, the South accounted for 38.46% of the United States laundry appliances market share in 2025, while the West is advancing at a 4.12% CAGR through 2031.
Note: Market size and forecast figures in this report are generated using Mordor Intelligence’s proprietary estimation framework, updated with the latest available data and insights as of 2026.
United States Laundry Appliances Market Trends and Insights
Drivers Impact Analysis*
| Driver | (~) % Impact on CAGR Forecast | Geographic Relevance | Impact Timeline |
|---|---|---|---|
| DOE 2028 washer/dryer efficiency standards catalyze upgrade cycles | +0.9% | National, strongest in California and the Northeast | Medium term (2-4 years) |
| Heat-pump dryers + federal/state rebates accelerate electrification | +0.8% | West, Northeast, early adoption in Washington, Oregon, California | Medium term (2-4 years) |
| Omnichannel fulfillment (big-box + online) lifts conversion | +0.3% | National, higher in the West and Northeast urban centers | Short term (≤ 2 years) |
| Smart/AI features raise ASPs and shorten replacement intervals | +0.5% | West, Northeast metros, spillover to Midwest suburbs | Medium term (2-4 years) |
| Multifamily rebate programs unlock stackable/ventless demand | +0.4% | West and Southeast metros, especially multifamily-dense cities | Medium term (2-4 years) |
| Front-load total cost of ownership advantage in high water-cost metros | +0.3% | California, Oregon, Washington, Alaska | Long term (≥ 4 years) |
| Source: Mordor Intelligence | |||


DOE 2028 Washer/Dryer Efficiency Standards Catalyze Upgrade Cycles
New federal efficiency standards due in March 2028 will change product mix and incentive design across the United States laundry appliances market by tightening Integrated Modified Energy Factor and Water Efficiency Ratio thresholds, which point retailers and OEMs toward compliant, higher-performing SKUs. DOE’s life-cycle analysis projects sizable consumer savings, and the update aligns with the direction of current motor and control technologies that are already widespread in mainstream price bands. Front-load designs benefit the most because their lower water use translates into faster paybacks in high-cost metros, a trend reinforced by municipal water rebates that further reduce upfront prices at the point of sale. Retail assortment strategies are adjusting as ENERGY STAR Most Efficient models and compliant capacities receive more floor space and promotional support before the 2028 deadline. The combined effect is a structured pre-upgrade window leading into 2027, followed by a post-compliance period when entry tiers standardize on inverter motors and sensor-driven controls in the United States laundry appliances market.
Heat-Pump Dryers + Federal/State Rebates Accelerate Electrification
Rebate-eligible heat-pump dryers are gaining traction in the United States laundry appliances market because closed-loop heat exchange cuts energy consumption compared with electric-resistance models, and federal programs provide up to USD 840 in support to qualifying households. Lower per-cycle energy use is amplified under time-of-use rates, and national electricity price data confirm that off-peak scheduling can further compress payback for high-use homes. West Coast and select Northeast cities are also pursuing electrification goals through local codes and retrofit programs that steer upgrades toward ventless or hybrid configurations that meet multifamily constraints. In Washington State, building performance requirements create compliance pathways that reward equipment with lower energy intensity, making heat-pump laundry systems part of a broader retrofit bundle in larger multifamily properties. Panel-capacity limits in older buildings are a gating factor, which is why utility-backed panel-upgrade pilots and technical assistance are integral to reaching deeper penetration over the next few years.
Omnichannel Fulfillment Lifts Conversion in a Fragmented Retail Landscape
Faster delivery and installation scheduling are lifting conversion rates as retailers align in-store consultation with online convenience in the United States laundry appliances market. Leading home improvement chains have narrowed installation windows and standardized fees, which supports emergency replacements and improves shopper confidence for high-consideration purchases. Retailers are also testing visualization and configuration tools to reduce returns due to fit issues, which is vital for front-load and stackable pairs where vibration and clearance are common objections. Manufacturer-direct sites and exclusive online assortments bring niche formats to national audiences, including compact ventless combos that fit space and electrical limits in multifamily housing. The ecosystem effect is a steady share for physical showrooms, combined with rising digital conversion as last-mile friction declines in the United States laundry appliances market.
Smart/AI Features Raise ASPs and Shorten Replacement Intervals
Connected platforms from leading brands are shifting value toward sensors, adaptive cycles, and energy orchestration, delivering tangible savings in the United States laundry appliances market. AI-enabled drum control, soil sensing, and detergent dosing reduce wear and resource use while keeping cycle times competitive, which sustains premium pricing at mid to upper tiers. These features integrate with home and utility platforms to automate off-peak scheduling and deliver user prompts, resulting in measurable electricity savings for households running multiple loads weekly. Energy orchestration matters more as time-of-use programs expand and homes add distributed solar power, creating midday windows with exceptionally low marginal costs in sunbelt and coastal markets [2]Solar Energy Industries Association Editors, “U.S. Solar Market Insight,” Solar Energy Industries Association, seia.org. The net effect is a gradual pull toward AI-rich models that justify their price premium through lower operating costs and better fabric care outcomes in the United States laundry appliances market.
Restraints Impact Analysis*
| Restraint | (~) % Impact on CAGR Forecast | Geographic Relevance | Impact Timeline |
|---|---|---|---|
| High prices and financing costs curb discretionary upgrades | -0.6% | National, pronounced in the Midwest and rural South | Medium term (2-4 years) |
| Saturated household penetration extends replacement cycles | -0.5% | National, particularly the suburban Midwest and Northeast | Long term (≥ 4 years) |
| Input cost/tariff volatility pressures retail pricing | -0.7% | National, acute for import-dependent brands | Medium term (2-4 years) |
| Uneven state rebate rollouts create demand uncertainty | -0.2% | Varies by state, with gaps in the Southeast and the Midwest | Medium term (2-4 years) |
| Source: Mordor Intelligence | |||
High Prices and Financing Costs Curb Discretionary Upgrades
Higher financing rates and elevated price points reduce early replacement intent in the United States laundry appliances market. Store and private-label card APRs have risen, increasing monthly payments and pushing households to defer non-critical upgrades. Commercial financing has also tightened, with variable-rate structures increasing costs for laundromats and multifamily operators that had relied on promotional offers during past cycles. Broader household budgeting trends show consumers shoring up savings, which weighs on durable goods demand when purchases are not failure-driven. The net result is longer replacement cycles in price-sensitive regions and a stronger focus on promotions or rebates to unlock discretionary upgrades in the United States laundry appliances market.
Saturated Household Penetration Extends Replacement Cycles
Penetration in United States households is already high, which leaves limited runway for first-time ownership growth in the United States laundry appliances market[3]U.S. Census Bureau Staff, “American Housing Survey and Household Appliance Data,” U.S. Census Bureau, census.gov. A large share of installed units is less than ten years old, which concentrates replacements in late-decade windows unless policy or incentives pull upgrades forward. Existing-home sales softness also removes move-in occasions that historically lifted early replacements, especially in metros with slower turnover. In the Midwest, purchaser preferences for robust mechanical-timer models and long warranties extend service life and dampen unit churn across value tiers. These patterns reinforce the need for compelling operating-cost savings and reliability features to shorten purchase intervals in the United States laundry appliances market.
*Our forecasts treat driver/restraint impacts as directional, not additive. The impact forecasts reflect baseline growth, mix effects, and variable interactions.
Segment Analysis
By Product Type: Dryers Outpace Washers on Electrification Incentives
Washing machines accounted for 52.34% of the United States laundry appliances market in 2025, while clothes dryers are projected to grow at a 3.71% CAGR through 2031, as incentive programs and energy savings drive upgrade timing. Heat-pump dryers qualify for federal rebates of up to USD 840 and deliver lower per-cycle energy use, which compresses payback when paired with off-peak scheduling under time-of-use rates. Local building codes and municipal electrification goals are driving demand for ventless and hybrid dryers in dense West Coast metros, where gas constraints and condo bylaws often favor electric options. The premium tier anchors innovation with Wi-Fi connectivity, sensor-dry algorithms, and closed-loop moisture management, which appeals to households that run frequent loads and value fabric care benefits. Manufacturer-direct and exclusive online assortments are expanding category awareness by showcasing compact, 120V-ready combos that bypass venting and panel-upgrade costs in multifamily footprints.
Washing machines continue to benefit from water-efficiency advantages in high-cost metros, with front-load platforms delivering consistent total-cost benefits where water and sewer charges are elevated. In the premium ranks, AI dosing, allergen cycles, and steam refresh functions differentiate value and nudge average selling prices higher when buyers can validate payback through detergent and water savings. Multifamily adoption is also rising for stackable washer-dryer combos that fit 24- to 27-inch widths and 120V constraints, positioning compact solutions for continued role expansion in urban cores. On the supply side, domestic manufacturing capacity additions are designed to shorten lead times for new heat-pump dryer models, which should help democratize the category as mid-tier price points arrive over the forecast window in the United States laundry appliances market. Taken together, product-type dynamics tilt toward dryers for growth and toward washers for durable water savings and AI-led gains in fabric care.


By Technology: Fully Automatic Dominance Persists Despite Semi-Automatic Niches
Fully automatic machines captured 81.93% of 2025 revenue and are projected to grow at a 3.14% CAGR as sensor-driven cycles, auto-dosing, and smartphone integration become standard expectations in the United States laundry appliances market. This arc aligns with ENERGY STAR Most Efficient 2026 criteria, which set minimum performance thresholds that many current SKUs already meet, reducing compliance risk and smoothing retail transitions. AI capabilities are increasingly central to differentiation, with drum-movement algorithms and fabric-detection systems tuning cycle speed and agitation to protect garments while conserving water and energy. Smart platforms integrate energy management features that automate off-peak operation, reinforcing financial savings for households on time-of-use plans and strengthening brand ecosystems built around app-led convenience. These product and policy alignments point to steady replacement intent in the fully automatic category within the United States laundry appliances industry.
Semi-automatic and manual machines maintain specific niches, including off-grid use, seasonal properties, and small hospitality installations that require lightweight, portable, 120V units at accessible price points. These products trade automation for upfront affordability and are less likely to qualify for efficiency incentives, which constrains growth relative to fully automatic models as standards tighten. Retailers prioritize fully automated assortments because they support higher attachment rates for pedestals, hoses, and extended warranties, thereby improving lifetime value in omnichannel settings. As smart platforms expand their role in diagnostics and maintenance alerts, semi-automatic volumes are anticipated to recede further as households and property owners emphasize long-term savings and connectivity features in the United States laundry appliances market [4]U.S. Environmental Protection Agency Staff, “ENERGY STAR Most Efficient Qualifications,” U.S. Environmental Protection Agency, epa.gov. The result is enduring category leadership for fully automatic machines and steady marginalization of manual and semi-automatic alternatives.
By Load Capacity: Larger Drums Capture Efficiency-Conscious Upgraders
The 6-8 kg segment held a 46.02% share of the United States laundry appliances market in 2025, reflecting a fit with average household sizes and space constraints in multifamily layouts. These mid-capacity models align with common closet dimensions and electrical-service limits in high-rise settings, which explains their share stability in major metros. Above-8-kg models are forecast to deliver the fastest category growth at a 3.42% CAGR through 2031, as suburban families consolidate loads and align cycles with off-peak windows under time-of-use rates. Product innovation spans both formats, with large-capacity top-loaders using load-sensing systems to moderate water use and front-loaders adding steam sanitize to meet hygiene preferences for bedding and athletic gear.
Below-6-kg machines fill secondary laundry and portable niches, including accessory dwelling units and RVs, where low weight, 120V operation, and compact form factors drive purchase decisions. Mid-capacity models benefit from performance standards that scale favorably with drum size, helping more SKUs qualify for ENERGY STAR Most Efficient and for utility rebates that reduce payback in water-expensive metros. In high-water-cost cities, larger drums can further reduce resource use by reducing total cycles, leveraging tiered pricing structures, and helping families quantify monthly savings from capacity upgrades. Regional housing stock profiles also play a role, with the South and West supporting larger footprints and dedicated laundry rooms that can accommodate 27- to 29-inch machines at favorable installation costs. Load-capacity choices will continue to reflect a balance between space, budget, and time-of-use optimization in the United States laundry appliances market.
By Distribution Channel: Online Gains Share as Installation Friction Eases
Multi-brand stores retained 53.12% of 2025 sales through in-person consultations, next-day delivery, and standardized installation fees, which support emergency replacements in the United States laundry appliances market. Leading home improvement chains operate dense store networks near households, enabling predictable scheduling and supporting high-consideration demos for front-load and stackable formats. In-store experiences are also tied to higher accessory and warranty attachment rates, which remain a margin lever for retailers even as online browsing expands. Digital channels are growing as manufacturer-direct sites and select retail partners bring exclusive compact and combo formats to national audiences, supplemented by guided configuration and installation content that lowers buyer friction. This tilt is reinforced by online-only launches and limited-time exclusives that generate early momentum while physical showrooms continue to serve as education hubs in the United States laundry appliances industry.
Exclusive brand outlets and showrooms target premium buyers with concierge installation and integrated smart-home configuration, thereby differentiating service depth from multi-brand environments. Builder-direct, hospitality, and commercial distributors complete the channel mix, with nationwide service networks and financing integrated into equipment purchases for property owners and laundromats. The balance between online convenience and showroom experience remains a defining feature, with omnichannel models proving effective at capturing both urgent and planned purchases in the United States laundry appliances market. Over the forecast period, delivery-speed gains and better installation coordination are expected to extend digital conversion while preserving in-store roles for complex, space-constrained purchases. Channel strategies that align with assortment, installation readiness, and financing options to meet buyer needs are set to outperform as features and incentives evolve.
Geography Analysis
The South held 38.46% of 2025 revenue, supported by robust single-family construction in Texas and Florida and by continued demand for reliable top-load formats in price-sensitive submarkets within the United States laundry appliances market. Housing starts in these states remained elevated in 2025, which sustains builder-direct and move-in driven purchases as developers equip laundry spaces in new communities. Lower average retail electricity rates in Texas compared with the national modestly extend payback periods for premium electric dryers, which tends to reinforce value-tier share unless rebates are stacked at the point of sale. Multifamily deliveries in Atlanta, Charlotte, and Nashville continue to include in-unit hookups at higher rates than earlier cycles, reflecting sustained renter preference for in-unit convenience and the corresponding rent premiums that owners can achieve. These economics positions mid-capacity stackable and reliable top-loaders as consistent performers in the South for the United States laundry appliances market.
The West is projected to grow at 4.12% through 2031, the highest among regions, driven by California Title 24 provisions for load shifting, municipal electrification policies, and water pricing that underscores front-load savings in the United States laundry appliances market. Utility rebates, including gas-to-electric dryer conversion offers in the Puget Sound region, are active levers for adoption in retrofits. High residential solar adoption creates midday windows of low marginal electricity cost, which grid-aware washers and dryers can target to reduce bills for households on time-of-use tariffs. Dense urban cores also see elevated penetration of compact ventless combos because they solve venting, space, and panel constraints in older multifamily buildings. Premium brands gain share in coastal metros where incomes and sustainability preferences align with long-life, high-efficiency machines in the United States laundry appliances market.
The Northeast and Midwest together account for a significant share of 2025 revenue, with older housing stock, basement installs, and narrower stair landings shaping format choices in the United States laundry appliances market. State climate plans in the Northeast promote electrification bundles that align with retailer cross-promotions, pairing efficient washers with smart thermostats and heat-pump water heaters. In the Midwest, durable mechanical-timer top-loaders maintain strong loyalty due to long service lives and extended warranties, which stretch ownership horizons and favor brands with nationwide service networks. Local manufacturing footprints in Kentucky and Ohio support supply resiliency and service responsiveness for the region’s retail base, which helps lead times and pricing consistency within the United States laundry appliances market. Across both regions, policy and building stock guide the mix toward stackable for tight spaces and toward robust top-loaders where basements and larger footprints allow flexibility.
Competitive Landscape
The United States laundry appliances market is led by established global and United States-based manufacturers that combine deep brand equity with extensive service networks and growing smart-platform ecosystems. Whirlpool’s domestic sourcing and continuing investment in United States plants reduce exposure to import frictions and enable faster product pivots into heat-pump platforms as mid-tier models scale. GE Appliances has expanded capacity for compact ventless combos, improving availability in apartment-heavy markets and extending its footprint in space-constrained segments. LG and Samsung differentiate through AI-based cycle optimization, app ecosystems, and design-led suites that lift average selling prices while reinforcing cross-category loyalty in connected homes. Electrolux and premium European brands remain influential at the upper end with quiet, efficient designs and advanced fabric-care features that appeal to longevity-minded buyers in coastal metros.
Product innovation in the United States laundry appliances market is increasingly defined by heat-pump adoption and energy orchestration features that complement expanding time-of-use programs. GE’s SmartHQ platform integrates with energy-pricing signals to schedule cycles in lower-cost windows, delivering measurable annual savings for high-usage households. LG and Samsung continue to refine sensor suites that detect load size and fabric movement to balance resource use, reduce wear, and enhance cleaning performance. ENERGY STAR Most Efficient criteria anchor retail messaging and merchandising, which supports consumer trust and helps explain why compliant SKUs receive prominent placement online and in stores. Compact ventless combos and 120V-ready dryers are widening the addressable base in older multifamily buildings, reflecting a shift from proof-of-concept to scaled offerings in the United States laundry appliances market.
New entrants and strategic partnerships are intensifying competition on both price and features. Midea America’s push into fully automatic washers at accessible price points has widened choice for first-time buyers and rental-property owners. Best Buy’s exclusive early window on GE’s compact ventless combo unlocked online demand that traditional floor traffic missed, underscoring the role of targeted digital launches in category expansion. Alliance Laundry Systems continues to strengthen its commercial and multifamily presence through financing, service, and distributor-led coverage that support retrofit programs in dense urban markets. Looking ahead, scaling domestic capacity for heat-pump dryers and broadening smart-feature sets across mid-priced tiers are set to define the next phase of competition in the United States laundry appliances market.
United States Laundry Appliances Industry Leaders
Whirlpool Corporation
LG Electronics USA
Samsung Electronics America
GE Appliances (Haier)
Electrolux (Frigidaire)
- *Disclaimer: Major Players sorted in no particular order

Recent Industry Developments
- October 2025: Whirlpool Corporation announced a USD 300 million expansion of its Clyde, Ohio, facility to build heat-pump dryer components, targeting mid-tier launches in 2027 and cutting import lead times while adding 480 jobs.
- June 2025: GE Appliances expanded production of its Profile UltraFast Combo at Appliance Park in Louisville, Kentucky, doubling annual capacity to 180,000 units after early batches sold out, with online-exclusive distribution through BestBuy.com and GEAppliances.com.
- May 2025: LG Electronics partnered with CSC ServiceWorks to integrate ThinQ-enabled washers and dryers into 2,400 multifamily common-area laundries across the Northeast and Mid-Atlantic, enabling smartphone reservations, monitoring, and payments for residents.
- March 2025: Bosch Home Appliances introduced its 800 Series heat-pump dryer in the United States with a self-cleaning condenser, eligible for up to USD 840 federal rebates and additional state incentives in select states.


United States Laundry Appliances Market Report Scope
A laundry appliance is a machine used for cleaning and rinsing textiles with water, but is not limited to washing. It can also be used for drying purposes. The United States laundry appliances market is segmented by product type (washing machines, clothes dryers, and others (garment steamers, electric irons, laundry dehumidifiers)), by technology (fully automatic and semi-automatic/ manual), by laod capacity (below 6 kg, 6-8 kg, and above 8 kh), by distribution channel (multi brand stores, exclusive brand outlets, online, and other distribution channels), and by geography (Northeast, Midwest, South, and West). The report offers market size and forecasts for the United States laundry appliances market in value (USD) for all the above segments.
By Product Type
| Washing Machines |
| Clothes Dryers |
| Others (Garment Steamers, Electric Irons, Laundry Dehumidifiers) |
By Technology
| Fully Automatic |
| Semi-Automatic / Manual |
By Load Capacity
| Below 6 kg |
| 6–8 kg |
| Above 8 kg |
By Distribution Channel
| Multi-brand Stores |
| Exclusive Brand Outlets |
| Online |
| Other Distribution Channels |
By Geography
| Northeast |
| Midwest |
| South |
| West |
| By Product Type | Washing Machines |
| Clothes Dryers | |
| Others (Garment Steamers, Electric Irons, Laundry Dehumidifiers) | |
| By Technology | Fully Automatic |
| Semi-Automatic / Manual | |
| By Load Capacity | Below 6 kg |
| 6–8 kg | |
| Above 8 kg | |
| By Distribution Channel | Multi-brand Stores |
| Exclusive Brand Outlets | |
| Online | |
| Other Distribution Channels | |
| By Geography | Northeast |
| Midwest | |
| South | |
| West |


Key Questions Answered in the Report
What is the current size and growth outlook for the United States laundry appliances market?
The United States laundry appliances market size is valued at USD 8.12 billion in 2026 and is projected to reach USD 9.43 billion by 2031 at a 3.04% CAGR.
Which product category will grow fastest in the United States laundry appliances market through 2031?
Clothes dryers are set to grow fastest with a 3.71% CAGR through 2031, supported by heat-pump incentives and energy savings.
Which technology format leads sales in the United States laundry appliances market?
Fully automatic machines lead with 81.93% of 2025 revenue and a projected 3.14% CAGR, driven by sensor-driven cycles and connectivity.
Which region is expected to post the highest growth in the United States laundry appliances market?
The West is the fastest-growing region, with a 4.12% CAGR through 2031, driven by Title 24 load shifting, electrification, and high-water costs.
How are incentives affecting heat-pump dryer adoption in the United States?
Federal rebates up to USD 840, along with select state and local programs, reduce upfront costs and improve payback, especially under time-of-use pricing.
What factors are extending replacement cycles in the United States laundry appliances market?
High household penetration, tighter financing conditions, and budget reallocation to savings are extending cycles, with regional differences based on preferences and housing stock.
Page last updated on:


