Market Overview
| Study Period | 2020 - 2031 |
|---|---|
| Forecast Data Period | 2026 - 2031 |
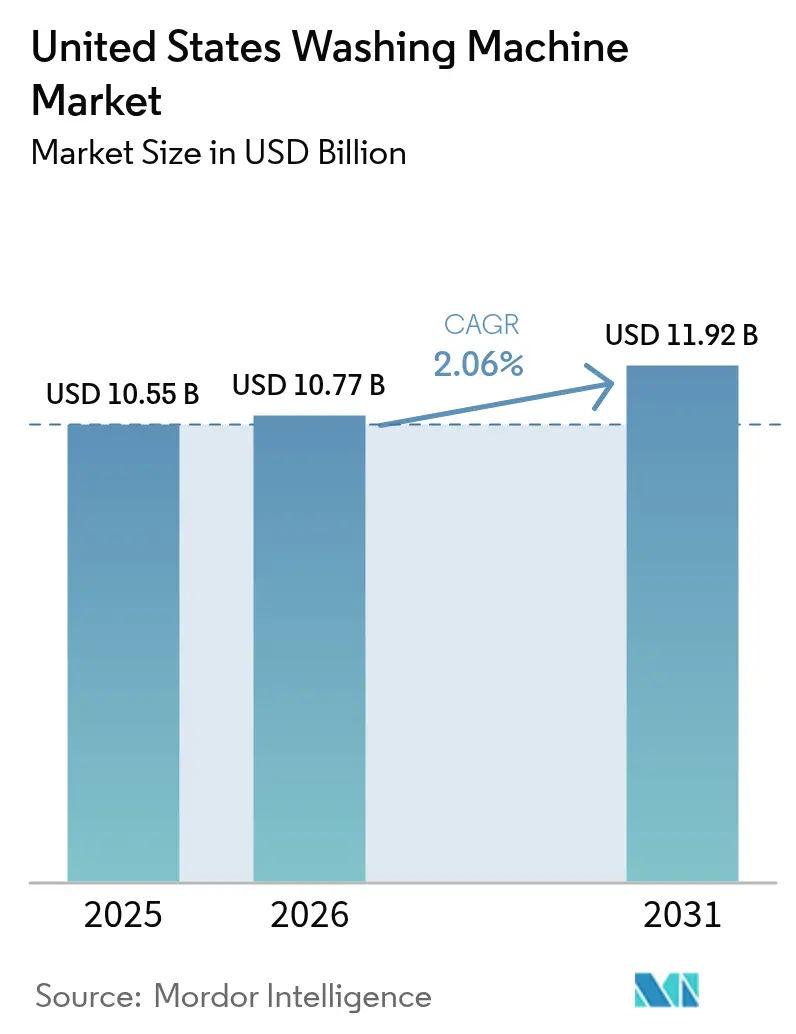
| Base Year Market Size (2025) | USD 10.55 Billion |
| Market Size (2026) | USD 10.77 Billion |
| Market Size (2031) | USD 11.92 Billion |
| Growth Rate (2026 - 2031) | 2.06% CAGR |
| Market Concentration | High |
Major Players *Disclaimer: Major Players sorted in no particular order Image © Mordor Intelligence. Reuse requires attribution under CC BY 4.0. | |
United States Washing Machine Market Analysis by Mordor Intelligence
United States washing machine market size in 2026 is estimated at USD 10.77 billion, growing from 2025 value of USD 10.55 billion with 2031 projections showing USD 11.92 billion, growing at 2.06% CAGR over 2026-2031. Replacement purchases dominate demand because household penetration is already near 85%, prompting manufacturers to court shoppers with premium features and energy savings rather than entry-level pricing. Tariff-driven raw-material cost spikes have pushed average retail prices up 18.8% year over year, but consumers have accepted the increase when it is paired with smart functions and regulatory-ready efficiency [1]U.S. Department of Energy, “DOE Finalizes Energy Standards for Residential Clothes Washers,” energy.gov. . Competitive intensity has shifted toward technology and service differentiation, as seen in Whirlpool’s FreshFlow™ Vent System and Samsung’s AI-powered wash cycles. Regional growth is strongest in the South and West thanks to population inflows, new housing starts, and state-level rebate programs that reward ENERGY STAR models. Online channels are reshaping distribution, growing more than five times faster than store-based sales as shoppers gravitate toward direct-to-consumer portals and marketplace platforms.
Key Report Takeaways
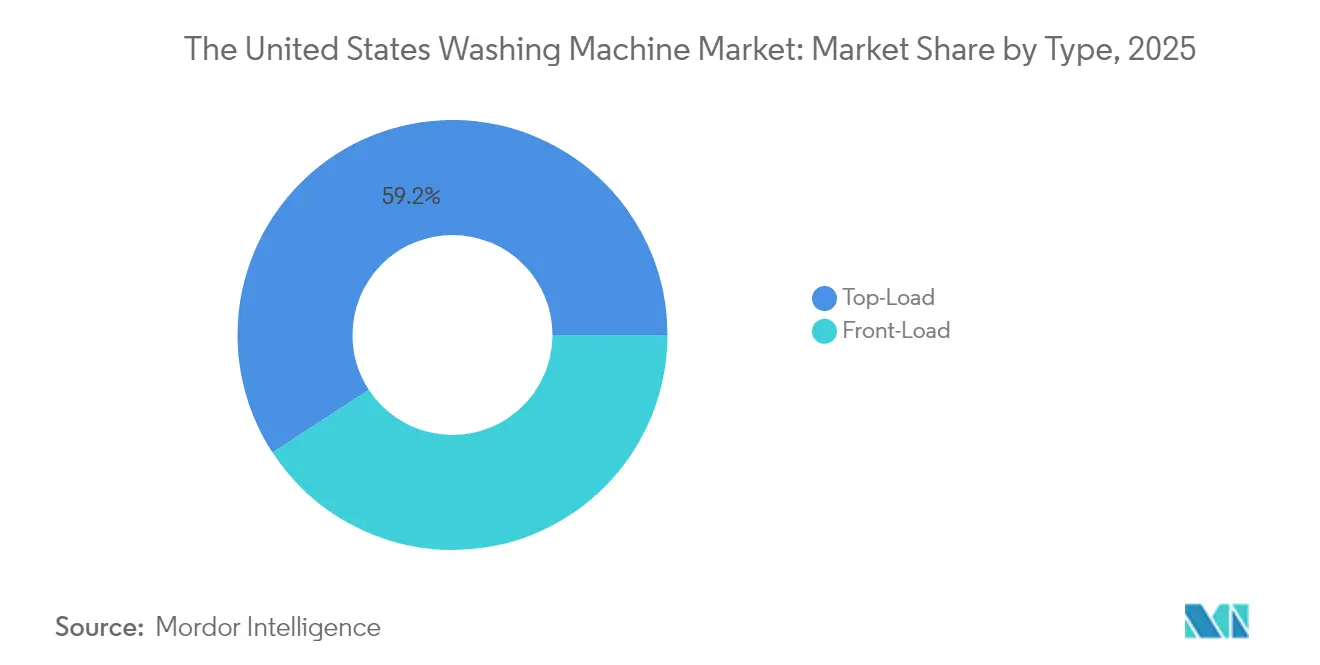
- By product type, top-loaders led with 59.21% of the United States washing machine market share in 2025, while front-loaders are projected to expand at a 6.62% CAGR through 2031.
- By technology, fully-automatic machines accounted for 94.22% share of the United States washing machine market size in 2025; they are also advancing at a 5.55% CAGR through 2031.
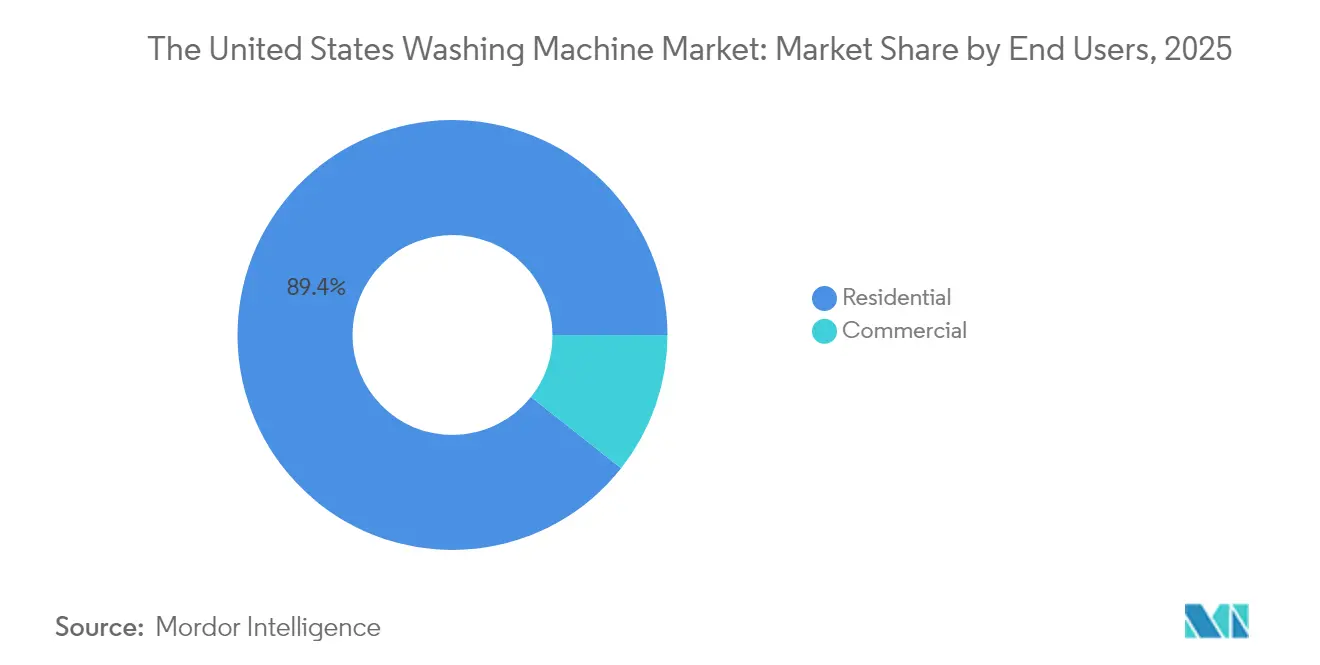
- By end user, the residential segment dominated with 89.35% of the United States washing machine market share in 2025, whereas the commercial segment is forecast to post a 4.82% CAGR to 2031.
- By distribution channel, multibrand stores captured 40.86% of the United States washing machine market share in 2025, whereas online sales are on track for an 10.95% CAGR through 2031.
- By region, the South held the largest 33.62% share in 2025; the West is the fastest-growing area, projected at a 5.18% CAGR through 2031.
Note: Market size and forecast figures in this report are generated using Mordor Intelligence’s proprietary estimation framework, updated with the latest available data and insights as of 2026.
United States Washing Machine Market Trends and Insights
Drivers Impact Analysis*
| Driver | (~) % Impact on CAGR Forecast | Geographic Relevance | Impact Timeline |
|---|---|---|---|
| Replacement demand from aging installed base | +0.8% | Northeast & Midwest | Medium term (2-4 years) |
| Energy-efficiency standards and rebates | +0.6% | National; strongest in CA, NY, TX | Long term (≥4 years) |
| Rising uptake of smart, connected washers | +0.4% | Urban West Coast markets | Medium term (2-4 years) |
| Expansion of single-person households | +0.2% | Urban centers nationwide | Long term (≥4 years) |
| Growth in multi-family housing developments | +0.3% | Urban and suburban areas | Medium term (2–4 years) |
| Increased consumer focus on sustainability trends | +0.5% | Coastal and progressive states (e.g., CA, WA, MA) | Long term (≥4 years) |
| Source: Mordor Intelligence | |||
High Replacement Demand From Aging Installed Base
More than 40 million units built between 2008 and 2015 are reaching end-of-life, and roughly 61% of 2025 washer purchases replace an existing machine. Replacement cycles are most intense in the Northeast and Midwest, where older housing stock and harsher winters shorten appliance life. Consumers adopting 2025-vintage models cut energy use by 25–30% compared with equipment a decade old, meeting both cost-savings needs and forthcoming federal standards. Whirlpool’s latest earnings call noted a tilt toward value-oriented models, but the brand is bundling extended warranties and app-based diagnostics to preserve margins. Retailers report that customers who initially target low prices often trade up once they see the long-term utility-bill savings. The steady churn of aging units thus anchors the United States washing machine market, preventing sharper volume declines even as overall household formation slows.
Energy-Efficiency Standards & Rebate Programs
The Department of Energy’s final rule effective March 2028 forces top-load washers to meet a 10% tighter energy ceiling, while front-load thresholds also rise. Roughly 15% of current SKUs will fail compliance, pushing brands to redesign line-ups or exit lower-volume niches. States such as California and New York supplement federal action with rebates up to USD 840 for qualifying models, effectively narrowing the price gap between basic and premium offerings. Manufacturers with scale and R&D muscle—LG and BSH among them—gain an edge because they can amortize compliance costs across global volumes. Up-front unit costs are projected to rise USD 50–80, but lifetime utility savings offset the premium within four years for most households. Dealers see an opportunity to upsell high-spin-speed front-loaders that already exceed proposed thresholds, accelerating the shift toward premium features and stabilizing average selling prices.
Growing Adoption of Smart, Connected Washers
Connected washers represent about 35% of new units sold in 2025 and carry USD 200–400 premiums [2]GE Appliances, “UltraFresh Line-Up Expansion,” geappliances.com.. Samsung’s Bespoke AI and Whirlpool’s Intelligent Wash enable fabric-specific cycles, voice commands, and over-the-air updates, which lift customer-satisfaction metrics. Predictive-maintenance alerts are reducing service calls for early adopters, lowering total cost of ownership and reinforcing subscription models such as LG’s usage-based laundry program. Urban professionals in the Pacific and Mountain states are earliest adopters because they already own smart thermostats and lighting systems. Privacy concerns remain a barrier for rural buyers, but Matter-standard interoperability is easing worries around vendor lock-in. As broadband and 5G coverage advances, connectivity will likely become table stakes rather than a premium, further segmenting the United States washing machine market into differentiated service ecosystems.
Rise in Single-Person Households Boosting Compact Washers
Single-person households climbed to 28% of all the United States homes in 2025, and urban apartments often lack space for full-size appliances [3]U.S. Energy Information Administration, “2020 Residential Electricity End-Use,” eia.gov. . Compact models from Danby and GE, with 2.0–2.5 ft³ drum capacity, meet strict size constraints while offering water-heat-pump technology that eliminates external venting. Developers of multifamily units increasingly specify compact washers during construction, shifting sales toward B2B project channels. Although compact units cost 20–30% more than standard top-loaders, renters value the integrated design and lower utility bills. Regulatory uncertainty around DOE proposals for compact washers has slowed product roadmaps, yet vendors remain committed because the demographic trend is unmistakable. Premium compact washers can therefore command higher margins, cushioning the wider market’s slower growth.
Restraints Impact Analysis*
| Restraint | (~) % Impact on CAGR Forecast | Geographic Relevance | Impact Timeline |
|---|---|---|---|
| Saturated household penetration rates | -0.5% | Suburban markets | Long term (≥4 years) |
| Steel and resin price volatility | -0.3% | National manufacturing footprint | Short term (≤2 years) |
| Supply chain disruptions and import delays | -0.4% | Ports and major distribution hubs | Short term (≤2 years) |
| High repair and maintenance costs deterring upgrades | -0.2% | Older housing stock regions (e.g., Northeast, Midwest) | Medium term (2–4 years) |
| Source: Mordor Intelligence | |||
Saturated Household Penetration Rates
Penetration has plateaued around 85% of households, and durability gains push replacement cycles out to 12–15 years. In dense metro areas, virtually every home already owns a washer, so volume must come from replacements, new construction, or immigration-driven household formation. Rural areas offer marginal headroom, but logistical barriers and alternative wash solutions, such as shared facilities, limit uptake. Manufacturers are responding by monetizing the installed base via extended warranties, remote diagnostics, and part subscriptions. For investors, the flattening unit trajectory elevates the importance of service revenue and cost efficiency because topline expansion by volume is increasingly elusive. Market incumbents enjoy scale advantages, thereby intensifying barriers for entrants seeking to carve out share in a stagnant replacement environment.
Steel & Resin Price Volatility
Steel accounts for up to 30% of bill-of-materials cost, and the June 2025 imposition of a 50% tariff on imported steel distorted budgets overnight [4]National Public Radio, “Appliances Face Steel Tariffs,” npr.org. . LG disclosed a 46.6% operating-profit hit in Q2 2025 attributable to tariff-inflated costs, while Samsung announced procurement diversification to minimize exposure. In response, GE is investing USD 490 million in a Kentucky plant that will on-shore production of 15 models by 2027. Manufacturers have resorted to long-term supply contracts, stockpiling, and selective price increases averaging 18.8%. Retail elasticity analysis suggests consumers tolerate mark-ups below 20% if accompanied by efficiency or smart-home value propositions. However, should commodity inflation persist, entry-level SKUs may see demand erosion, dampening the overall United States washing machine market outlook despite premium-tier resilience.
*Our updated forecasts treat driver/restraint impacts as directional, not additive. The revised impact forecasts reflect baseline growth, mix effects, and variable interactions.
Segment Analysis
By Type: Front-Load Models Gain Traction Amid Efficiency Push
Front-load washers held 40.79% share in 2025, while top-loaders remained dominant at 59.21%. Yet front-loaders’ superior 6.62% CAGR underscores a clear tilt toward designs that cut water use by up to 40% and trim energy by 15–20%. The Department of Energy’s 2028 thresholds favor front-load technology because high-spin-speed extraction lowers dryer-time energy. West-coast drought concerns and northeastern utility prices reinforce the shift, making front-loaders the aspirational choice in high-income ZIP codes. Innovation solves historical pain points: Whirlpool’s FreshFlow™ eliminates odor, and GE’s UltraFresh dispels humidity, addressing mildew fears that previously steered buyers away. Manufacturing complexity raises MSRP by 30–50%, but higher gross margins compensate. As rebates narrow the net price difference, the front-loaders’ premium positioning aligns with consumers’ growing willingness to pay for durability and lower lifetime costs when replacing older top-loaders.
Standard top-loaders remain indispensable, particularly in the South and Midwest where large households value faster wash cycles and familiar ergonomics. Manufacturers increasingly bundle agitator-free high-efficiency versions to maintain compliance and reduce water use, ensuring the segment stays relevant. Though top-load volume will stay above 50% by 2030, the value narrative increasingly shifts to front-loaders, particularly among environmentally conscious millennials and Gen Z households. Consequently, companies that balance both segments in their portfolio secure volume from price-sensitive shoppers while capturing margin from tech-seeking buyers, stabilizing revenue despite muted unit growth.


By Technology: Fully-Automatic Systems Dominate With Smart Add-Ons
Fully-automatic designs represented 94.22% of 2025 shipments, reflecting widespread consumer preference for one-button operation. The feature set now spans AI cycle optimization, smartphone pairing, and voice-assistant enablement, supporting a 5.55% CAGR even within a mature market. Brands differentiate through software rather than hardware, offering over-the-air updates that extend machine relevance and foster brand loyalty. LG’s subscription model underscores this shift, monetizing data analytics and predictive servicing rather than only hardware revenue.
Semi-automatic washers persist in certain commercial niches—such as laundry services requiring manual control or disaster-relief use cases where water pressure is unreliable. Nevertheless, as supply-chain efficiencies lower the cost delta between semi- and fully-automatic platforms, OEMs are phasing out semi-automatic SKUs from mainstream retail. Over time, automation will become ubiquitous, and differentiation will hinge on ecosystem services, nudging the United States washing machine market toward a software-plus-hardware paradigm akin to the smartphone sector.
By End Users: Residential Core With Commercial Upside
Residential buyers continued to account for 89.35% of unit volume in 2025, affirming the category’s household-centric nature. Within homes, feature bundles are bifurcating: entry models focus on affordability, while premium units tout AI and energy intelligence to mitigate higher tariffs. Apartment dwellers push landlords to install in-unit machines, boosting B2B sales to multifamily developers.
Commercial demand is accelerating at a 4.82% CAGR, led by hotels refreshing in-house laundries, laundromats expanding payment-app functionality, and universities upgrading to meet ESG targets. Alliance Laundry’s Speed Queen brand leverages rugged components and centralized management dashboards, offering owners predictive service alerts that lower downtime. Although commercial represents only 10.65% of volume, higher price points and service contracts amplify its revenue contribution, making it a strategic growth lever as residential growth plateaus.
By Distribution Channel: Digital Disruption Redraws the Path to Market
Multibrand stores still hold a 40.86% grip on 2025 revenue, with Home Depot and Lowe’s controlling over half that tally. Shoppers appreciate face-to-face advice, haul-away options, and bundled installation. Yet online purchases are climbing at an 10.95% CAGR as pandemic-era buying habits endure. Marketplace giants integrate AR visualization tools and next-day delivery, eroding the perceived risk of buying large appliances sight unseen.
Manufacturers are ramping direct-to-consumer portals, capturing data, and improving margins by bypassing retailer fees. Average e-commerce basket values trail store purchases by USD 50, indicating price-sensitive shoppers gravitate online. Logistics providers are scaling white-glove delivery services that include connection and old-unit removal, further lowering barriers. Exclusive brand stores cater to high-end buyers needing curated experiences, while warehouse clubs capture bulk-purchase households. Ultimately, omnichannel strategies that blend showroom experiences with digital ordering will define competitive success in the United States washing machine market.
Geography Analysis
The South generated 33.62% of 2025 revenue, propelled by population in-migration, affordable housing, and favorable tax climates. Florida and Texas underpin volume as new-home completions require appliance packages. Utility-sponsored rebates in Texas quicken replacement cycles, boosting front-load uptake in water-stressed areas. Despite interest-rate volatility, robust job creation sustains multi-family construction, underpinning a projected 5.01% CAGR to 2031.
The West secured 28.14% share in 2025 but leads growth at 5.18% CAGR, driven by California’s stringent water rules and higher disposable income. Drought conditions reinforce consumer preference for water-efficient front-loaders, while tech-savvy populations in Seattle and San Francisco set the pace for smart-appliance adoption. State rebates further sweeten payback periods, effectively narrowing the gap between basic and premium SKUs.
The Midwest held a 22.76% slice in 2025, reflecting its manufacturing heritage and colder climate that ages machines faster. Industrial laundries and institutional clients, including hospitals, fuel commercial sales. Still, slower population growth keeps overall expansion at 4.63% CAGR. Winter-related energy costs prompt households to upgrade to ENERGY STAR models that cut utility bills, supporting steady but unspectacular unit turnover.
The Northeast captured 15.48% share in 2025 with a 4.41% CAGR outlook. Dense urban housing and high real-estate costs extend replacement cycles, but state rebate programs—led by New York’s first-in-nation in-store scheme—amplify conversion to high-efficiency units. Compact washers gain traction as apartment dwellers seek space-saving solutions, offering manufacturers a profitable niche.
Competitive Landscape
The top players include Whirlpool, LG, Samsung, GE Appliances, and Electrolux dominate the market, highlighting a highly consolidated industry structure that benefits from economies of scale. Whirlpool holds the leading position, supported by a diverse product portfolio that caters to both mass-market and premium segments. LG and Samsung invest heavily in AI and cloud platforms that extend value beyond the physical machine. GE’s USD 490 million Kentucky plant will reshore capacity by 2027, insulating its supply chain against steel-import tariffs and reducing lead-times.
R&D intensity differentiates competitors: BSH plows 5.5% of revenue into innovation, while Samsung allocates substantial capital to Bespoke AI ecosystem integration. Supply-chain resilience has become a strategic pillar, with brands diversifying sources of rolled-steel and resin to mitigate input shocks. Subscription models and extended warranties create annuity streams, shifting focus from one-time sales to lifetime customer value. Niche vendors such as Danby exploit compact-appliance gaps overlooked by giants, but barriers to scale remain formidable given regulatory compliance costs and channel dominance by entrenched brands.
United States Washing Machine Industry Leaders
Whirlpool Corporation
LG Electronics
Samsung Electronics
GE Appliances (Haier)
Electrolux AB
- *Disclaimer: Major Players sorted in no particular order


Recent Industry Developments
- June 2025: GE Appliances committed USD 490 million to a Kentucky washer plant that will on-shore production from China beginning 2027.
- April 2025: Whirlpool closed its EMEA transaction to form Beko Europe, unlocking USD 200–300 million in incremental 2025 free cash flow.
- February 2025: DOE finalized energy standards that tighten top-load efficiency by 10% and elevate front-load thresholds, effective March 2028.


United States Washing Machine Market Report Scope
A washing machine is a home appliance used to wash laundry. The term mostly applies to machines using water instead of dry or ultrasonic cleaners. The user adds laundry detergent sold in liquid or powder form to the wash water.
The United States washing machine market is segmented by type, technology, end-user, and distribution channel. By type, the market is sub-segmented into front load and top load. By technology, the market is sub-segmented into fully automated and semi-automated. By end-user, the market is sub-segmented into commercial and residential. By distribution channel, the market is sub-segmented into multi-brand stores, exclusive stores, online, and other distribution channels. The report offers market sizes and forecasts for the washing machine market in the United States in terms of revenue (USD) for all the above segments.
By Type
| Front-Load |
| Top-Load |
By Technology
| Fully-Automatic |
| Semi-Automatic |
By End Users
| Residential |
| Commercial |
By Distribution Channel
| Multibrand Stores |
| Exclusive Stores |
| Online Stores |
| Other Distribution Channels |
By Geography
| Northeast |
| Midwest |
| South |
| West |
| By Type | Front-Load |
| Top-Load | |
| By Technology | Fully-Automatic |
| Semi-Automatic | |
| By End Users | Residential |
| Commercial | |
| By Distribution Channel | Multibrand Stores |
| Exclusive Stores | |
| Online Stores | |
| Other Distribution Channels | |
| By Geography | Northeast |
| Midwest | |
| South | |
| West |


Key Questions Answered in the Report
How large is the United States washing machine market in 2026?
It is valued at USD 10.77 billion, with projections indicating USD 11.92 billion by 2031.
Which product type is gaining share the fastest?
Front-load washers are advancing at a 6.62% CAGR due to superior water and energy performance.
Why are retail prices for washers rising in 2025?
A 50% tariff on imported steel and resin cost volatility have increased production expenses, pushing retail prices up 18.8%.
Where is regional demand strongest?
The South leads in volume, while the West posts the fastest growth owing to strict water-efficiency mandates and higher incomes.
What role do smart features play in buyer decisions?
Roughly 35% of new units sold in 2025 include connectivity, and consumers accept USD 200–400 premiums for AI-driven convenience and predictive maintenance.
How will the 2028 DOE standards affect manufacturers?
About 15% of current models will be discontinued or redesigned, favoring brands with strong R&D and potentially consolidating the competitive landscape.
Page last updated on:


