
Walking Assist Devices Market Size and Share
Market Overview
| Study Period | 2020 - 2031 |
|---|---|
| Market Size (2026) | USD 8.41 Billion |
| Market Size (2031) | USD 11.23 Billion |
| Growth Rate (2026 - 2031) | 5.97 % |
| Fastest Growing Market | Asia Pacific |
| Largest Market | North America |
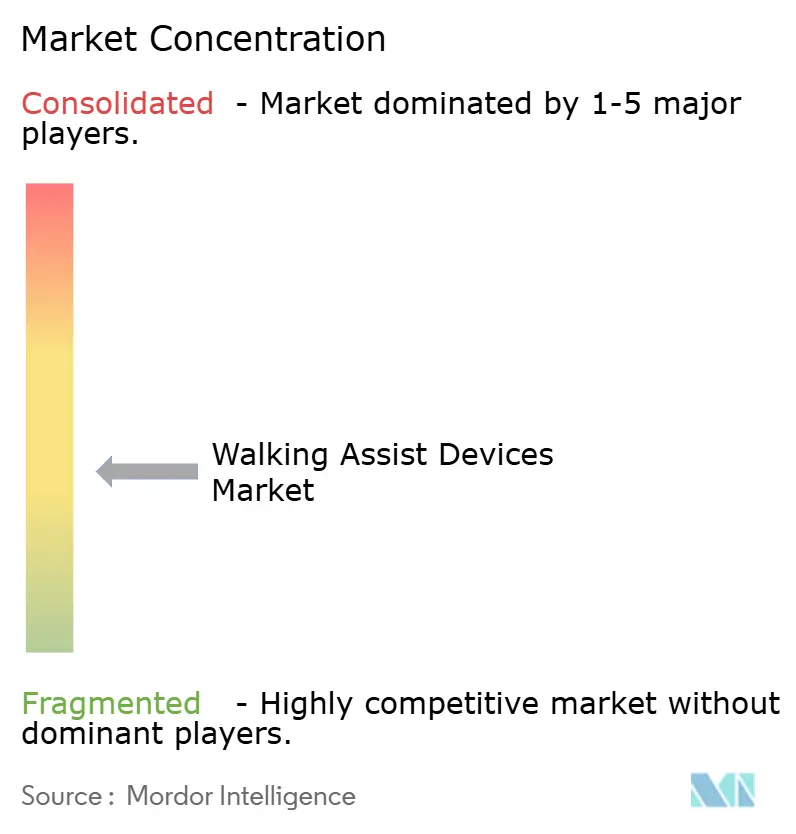
| Market Concentration | Medium |
Major Players *Disclaimer: Major Players sorted in no particular order Image © Mordor Intelligence. Reuse requires attribution under CC BY 4.0. | |
Walking Assist Devices Market Analysis by Mordor Intelligence
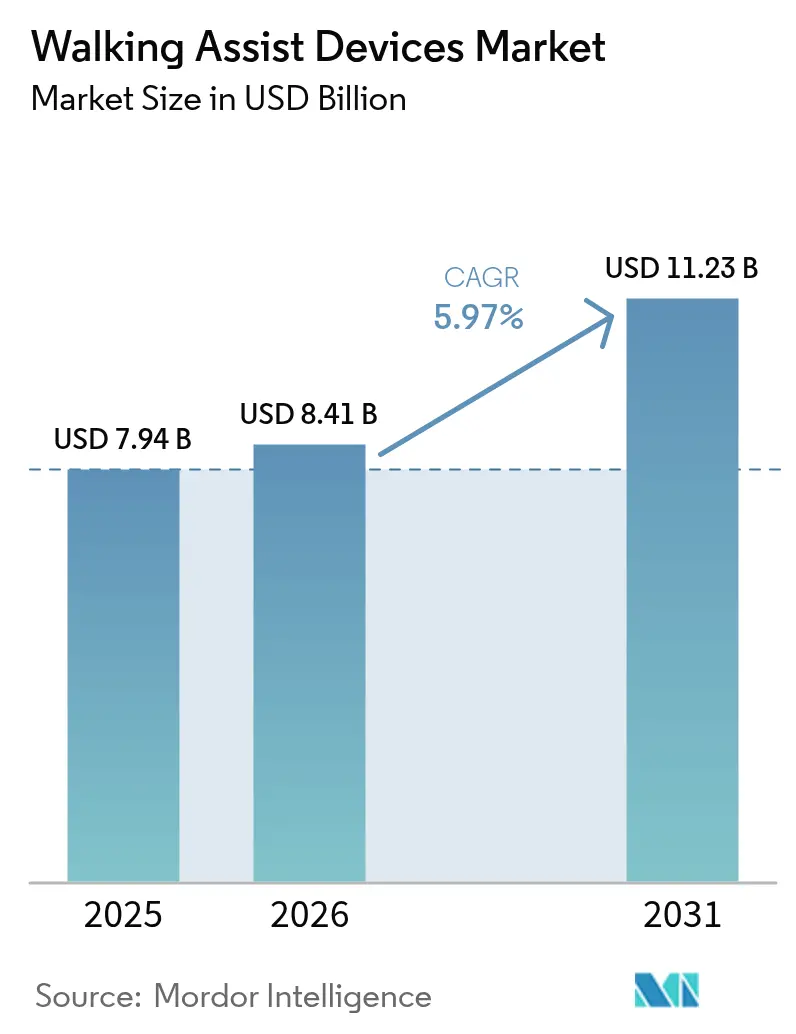
The walking assist devices market size is expected to grow from USD 7.94 billion in 2025 to USD 8.41 billion in 2026 and is forecast to reach USD 11.23 billion by 2031 at 5.97% CAGR over 2026-2031. Demand is shifting from purely clinical equipment toward solutions that restore autonomy, drawing investment from consumer electronics, automotive and insurance sectors. Population aging, the osteoarthritis burden, and rising survivorship after major surgery steadily lift baseline volumes, while smart sensors, lightweight materials and connectivity expand the functional range of devices. Competitive intensity is growing as incumbents acquire niche innovators, but regulatory amendments on quality and cybersecurity are likely to reshape cost structures. Taken together, these forces position the walking assist devices market for steady, technology-led growth while keeping entry barriers high for low-cost replicas.
Key Report Takeaways
- By product type, wheelchairs led with 47.12% revenue share in 2025, whereas gait belts and lift vests are projected to grow at a 7.03% CAGR to 2031.
- By technology, manual assist devices accounted for 56.20% of the 2025 walking assist devices market share; smart sensor-enabled devices are expanding at 7.74% CAGR through 2031.
- By end user, hospitals and clinics held 51.84% of the 2025 walking assist devices market size, while home-care settings are forecast to rise at 7.58% CAGR to 2031.
- By distribution channel, pharmacy and retail outlets captured 63.65% share in 2025; e-commerce platforms are advancing at 7.92% CAGR through 2031.
- By geography, North America represented 40.21% of global revenue in 2025, whereas Asia-Pacific is set to post the fastest 8.19% CAGR to 2031.
Note: Market size and forecast figures in this report are generated using Mordor Intelligence’s proprietary estimation framework, updated with the latest available data and insights as of 2026.
Global Walking Assist Devices Market Trends and Insights
Drivers Impact Analysis*
| Driver | (~) % Impact on CAGR Forecast | Geographic Relevance | Impact Timeline |
|---|---|---|---|
| Accelerating prevalence of osteoarthritis & rheumatoid arthritis | +1.8% | Global, with highest impact in North America & Europe | Long term (≥ 4 years) |
| Rising demand for post-operative rehabilitation equipment | +1.2% | Global, concentrated in developed healthcare systems | Medium term (2-4 years) |
| Rapidly expanding geriatric population base | +1.5% | Asia-Pacific core, spill-over to North America | Long term (≥ 4 years) |
| Increasing fall-related injuries prompting preventive walking aids | +0.9% | Global, with emphasis on developed economies | Medium term (2-4 years) |
| Commercialization of AI-enabled smart canes & sensor walkers | +0.7% | North America & EU early adoption, Asia-Pacific scaling | Short term (≤ 2 years) |
| Growth in long-COVID–linked mobility impairments | +0.6% | Global, with regional variation based on infection rates | Short term (≤ 2 years) |
| Source: Mordor Intelligence | |||
Accelerating prevalence of osteoarthritis & rheumatoid arthritis
The osteoarthritis burden is rising in tandem with obesity and sedentary lifestyles. In the United States, 32.5 million people live with osteoarthritis and direct medical costs reach USD 65 billion annually. Global prevalence now exceeds 606 million cases, and incidence climbs sharply after age 55, making assistive devices a routine component of long-term care. Rheumatoid arthritis follows a similar pattern, with 2024 data confirming smoking as a causal risk factor and showing higher rates among women in high socio-demographic regions. These trends sustain demand for wheelchairs, walkers and joint-offloading solutions.
Rising demand for post-operative rehabilitation equipment
Elective joint‐replacement volumes rebounded in 2024, and hybrid telerehabilitation programmes now support outpatient recovery pathways. Continuous-passive-motion devices, sensorised walkers and lightweight wheelchairs allow earlier discharge and reduce readmission risk. Neuromuscular electrical stimulation is increasingly embedded in walkers to counter ICU-acquired weakness.[1]Journal of Rehabilitation Medicine, “Post-COVID Neuromuscular Recovery,” jrm.medicaljournals.se
Rapidly expanding geriatric population base
Asia-Pacific will host 1.3 billion people over 60 years by 2050, equal to 25% of its total population. Worker-to-senior ratios are dropping to 2.4:1 in Japan and 4:1 in Singapore, creating care-delivery gaps that community-grade mobility aids help to close. Forty percent of older adults in the region lack pension coverage, prompting extended workforce participation that requires durable, occupationally acceptable devices.
Commercialization of AI-enabled smart canes & sensor walkers
The WeWalk Smart Cane 2.0 launched at CES 2025 integrates lidar-based obstacle detection, haptic feedback and Bluetooth mapping, turning a basic cane into a navigation appliance. Wheelchairs with detachable two-way propulsion allow both push and pull strokes, reducing shoulder load and doubling as exercise platforms.[2]Sensors MDPI, “Monit4Healthy: An IoT-Based Remote-Care System,” mdpi.com
Restraints Impact Analysis*
| Restraint | (~) % Impact on CAGR Forecast | Geographic Relevance | Impact Timeline |
|---|---|---|---|
| High acquisition & maintenance costs of powered devices | -1.4% | Global, with acute impact in developing economies | Medium term (2-4 years) |
| Limited reimbursement coverage in developing nations | -0.8% | Asia-Pacific, Latin America, Africa | Long term (≥ 4 years) |
| Product recalls due to safety / stability issues | -0.6% | Global, with regulatory focus in North America & EU | Short term (≤ 2 years) |
| Cyber-security & data-privacy risks in connected mobility aids | -0.4% | Global, concentrated in developed markets with high connectivity | Medium term (2-4 years) |
| Source: Mordor Intelligence | |||
High acquisition & maintenance costs of powered devices
Entry-level powered wheelchairs such as the WHILL Model Ci retail for USD 4,999, out of reach for many patients. Lithium-ion battery packs require replacement every five to seven years, adding up to 40% of initial cost. Recent recalls, including 781 SmartDrive units linked to unintended motor activation, underline the need for rigorous quality control. Such incidents amplify cost concerns by elevating insurance premiums and service fees.
Limited reimbursement coverage in developing nations
Many emerging economies fund only basic crutches or walkers, leaving advanced devices to out-of-pocket spending. Where coverage exists, reimbursement ceilings rarely match retail prices, creating grey markets for refurbished equipment. China’s 18% medical-device growth rate signals latent potential, yet insurance frameworks lag behind demographic need.
*Our forecasts treat driver/restraint impacts as directional, not additive. The impact forecasts reflect baseline growth, mix effects, and variable interactions.
Segment Analysis
By Product Type: Wheelchairs Retain Scale, Gait Belts Lead Growth
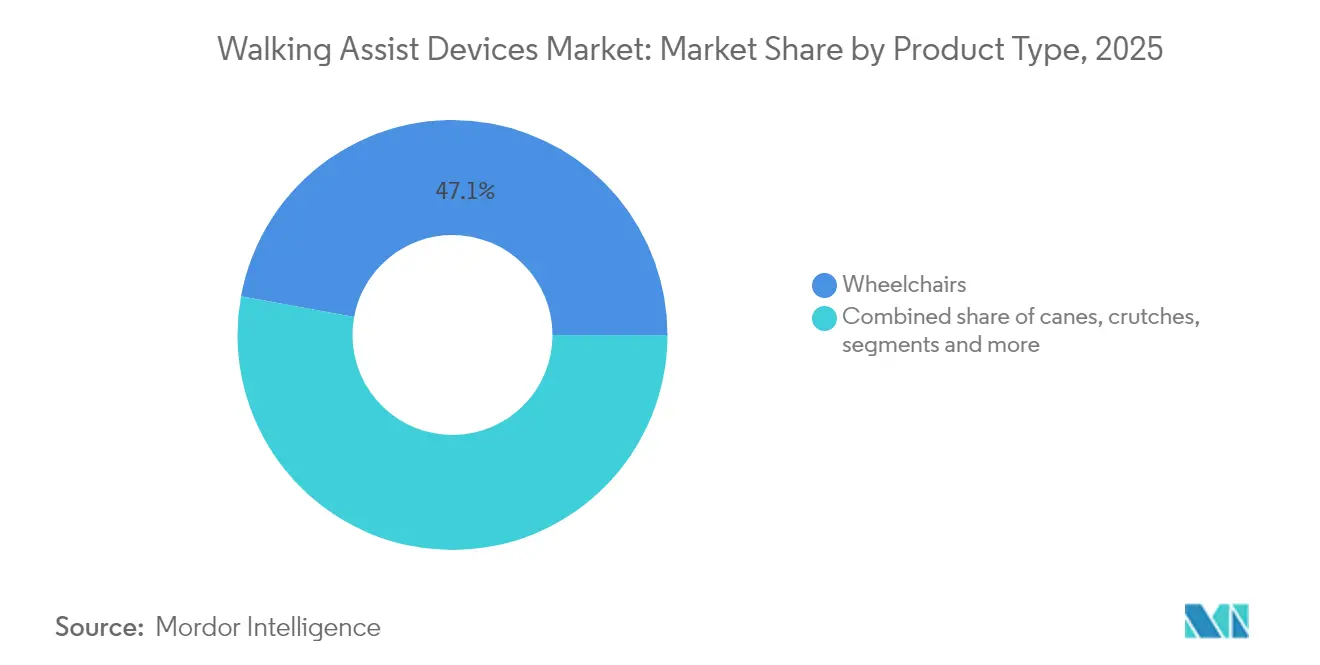
Wheelchairs held 47.12% of global revenue in 2025, confirming their central role in both acute and long-term settings. Manual models dominate today, but powered and smart variants are entering mainstream procurement as battery prices fall. Gait belts, lift vests and related transfer aids are projected to outpace other categories at 7.03% CAGR. Their rise reflects stricter worker-safety rules and the push to minimize caregiver injuries.
Regulatory clarity sustains baseline wheelchair demand, given their Class I or Class II designation under FDA and CE rules. Innovations such as the detachable two-way propulsion system improve ergonomics and widen use cases, keeping the walking assist devices market dynamic. Meanwhile, fall-prevention devices for Parkinson’s and post-stroke patients are blurring traditional boundaries, hinting at convergence with wearable technologies.



By Technology: Manual Reliability Meets Smart Expansion
The walking assist devices market size for manual devices remains the largest, yet smart sensor platforms are registering the fastest gains. Manual chairs, crutches and walkers are affordable, need no charging and carry minimal cyber-risk, explaining their 56.20% share in 2025. Smart devices, posting 7.74% CAGR, embed lidar, pressure sensors and real-time analytics to warn of obstacles or monitor vital signs. Powered chairs occupy a middle ground, benefiting from battery innovations and clearer test standards.
The Internet of Medical Things enables continuous monitoring through cloud dashboards, allowing clinicians to adjust therapy remotely. Still, cyber-security adds cost and complexity; FDA now requires software bills of materials and post-market patching plans for connected aids. In practice, users choose along a spectrum of price, maintenance capacity and information-sharing comfort.
By End User: Hospitals Command Volume, Home Care Scales Fast
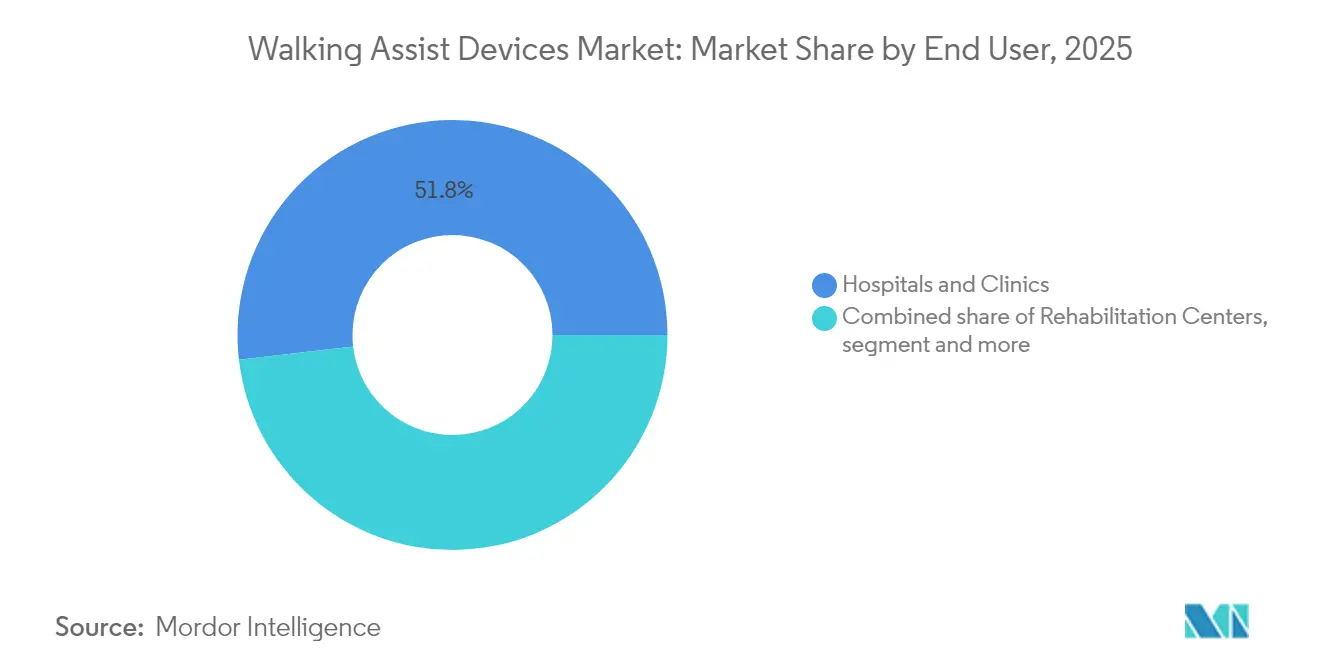
Hospitals and clinics represented 51.84% of 2025 demand, as they remain the first distribution node for mobility prescriptions. Ageing in place, however, is spurring a 7.58% CAGR in home-care uptake. Families prefer shorter inpatient stays and remote follow-up, putting a premium on foldable wheelchairs, adjustable walkers and devices that stand up to everyday use without on-site technicians.
Rehabilitation Centers see rising admissions of long-COVID and elective-surgery patients who need transitional aids. Elderly-care facilities in Japan, Germany and Italy face staffing shortages, prompting bulk purchases of easy-to-clean transfer belts and powered lifts. The walking assist devices market demonstrates that one device often migrates across settings during its lifecycle, so manufacturers now design for multi-environment performance.
By Distribution Channel: Brick-and-Mortar Dominates, E-commerce Widens Access
Pharmacies and retail stores own 63.65% of global sales because urgent needs and professional fitting still drive most purchases. E-commerce, advancing at 7.92% CAGR, bridges gaps for rural buyers and enables direct-to-consumer price transparency. High-value powered chairs and customised seating continue to flow through specialist dealers that offer measuring services and financing plans.
Omnichannel strategies are emerging. WHILL and Scootaround, for example, combine online rentals with airport pick-up, illustrating how service layers augment product sales. Stronger regulatory oversight of online vendors is expected as authorities tighten traceability rules, which may favour established healthcare retailers entering the digital arena.
Geography Analysis
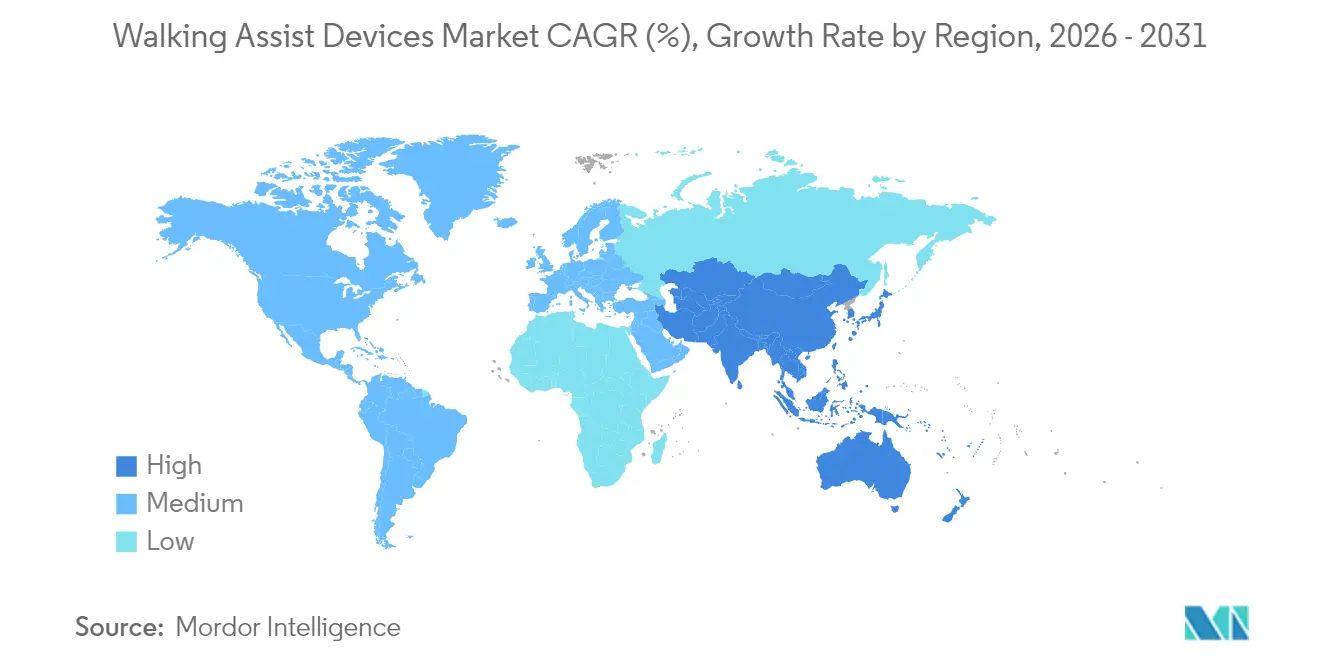
North America accounted for 40.21% of global revenue in 2025, anchored by robust insurance coverage and established clinical pathways. The region benefits from new FDA Quality System amendments effective in 2026, which simplify post-market surveillance and align supplier audits. Yet high list prices for powered chairs and complex coding for reimbursement can delay adoption. The recent USD 13.5 million settlement involving improper Medicare claims underscores ongoing billing scrutiny. Canada’s assistive-device programmes and Mexico’s growing private insurance sector add depth to regional demand.
Asia-Pacific is projected to deliver an 8.19% CAGR to 2031, the fastest worldwide. Demographic momentum, with the 80+ cohort quadrupling between 2016 and 2050, intersects with urban-density challenges that favour compact, lightweight aids. Japan’s long-term-care insurance reimburses high-end wheelchairs, while China’s domestic manufacturers scale up powered scooter lines for export. Approximately 40% of seniors lack pension coverage, making affordability essential; as a result, rental programmes and refurbished equipment exchanges are proliferating.
Europe maintains steady growth backed by universal healthcare and harmonised CE marking requirements. Germany and France drive volume through statutory insurance, whereas the United Kingdom adjusts post-Brexit conformity protocols. Sunrise Medical, headquartered in Germany, leverages in-region manufacturing and recent acquisitions such as Ride Designs to broaden its seating portfolio. The Medical Device Regulation (EU) 2017/745 imposes more stringent clinical evidence and post-market vigilance, benefiting suppliers with strong QA systems.

Regulatory Landscape
Walking assist devices span low-risk mechanical aids through software-enabled mobility platforms, and regulation increasingly differentiates between the two. In the United States, many walkers and rollators are treated as Class II devices that are commonly 510(k)-exempt under established product codes, but manufacturers still must meet FDA device controls, including Establishment Registration and Device Listing (renewed annually during the October 1 to December 31 window) and UDI requirements (21 CFR Part 830) for traceability. The FDA Quality Management System Regulation (QMSR), effective February 2, 2026, aligns quality-system expectations with ISO 13485:2016 and tightens supplier and documentation discipline across the ecosystem.
In Europe, the Medical Device Regulation (EU) 2017/745 governs walking aids, with many standard frames classified as Class I and supported by a Declaration of Conformity backed by technical documentation (Annex II/III) and risk management (EN ISO 14971). Harmonized performance standards such as EN ISO 11199-1:2021 (walking frames) and EN ISO 11199-2:2021 (rollators) anchor conformity testing, while MDR-linked traceability requirements increase emphasis on labeling and post-market vigilance. As smart sensor-enabled devices expand, FDA expectations for software lifecycle processes (IEC 62304) and AI/ML SaMD-style validation documentation raise compliance costs, favoring suppliers that can sustain ongoing cybersecurity patching and documentation updates.
Value Chain Analysis
The value chain starts with inputs such as aluminum and steel tubing, polymers, seating foams, casters, brakes, and (for powered and smart devices) batteries, motors, sensors, and embedded electronics. OEMs and brand owners design and validate products, then manufacture via in-house plants or contract manufacturers, with sourcing increasingly diversified across locations including Vietnam and Mexico to balance cost, lead times, and geopolitical exposure. Quality and regulatory documentation runs alongside physical goods, with EU MDR technical files and US QMSR-aligned quality systems shaping supplier qualification, incoming inspection, and change-control practices.
Downstream, products move through medical supply dealers, pharmacies and retail outlets, e-commerce platforms, and institutional tenders serving hospitals, rehabilitation centers, and long-term care. Service layers such as fitting, training, maintenance, and refurbishment affect total lifecycle economics, particularly for powered chairs and connected aids that require battery replacement and ongoing software support. Cross-cutting bottlenecks include limited capacity in specialized processes and compliance infrastructure, such as sterilization re-validation where applicable, as well as audit and documentation throughput under MDR, which can extend lead times and increase the role of distributors and service providers that can manage traceability, recalls, and post-market surveillance obligations.
Competitive Landscape
The walking assist devices market shows moderate fragmentation: the top brands together hold a significant global share, yet consolidation is underway. Sunrise Medical posted EUR 636 million revenue in 2023 after adding Ride Designs and pediatric specialist Leckey to its stable, highlighting a build-and-integrate strategy. Permobil and Max Mobility focus on powered solutions but faced quality setbacks following the SmartDrive recall, prompting fresh investment in risk-engineering systems.
Invacare’s North American business was acquired by MIGA Holdings in late 2024, securing capital for R&D while streamlining supply chains. Meanwhile, AI-centric newcomers such as WeWalk target niche user groups, relying on collaborative manufacturing and cloud-based feature updates. Contract manufacturers in Vietnam and Mexico gain share as OEMs re-shore away from single-country exposure, especially for aluminum frames and lithium-battery packs.
Intellectual-property filings reveal priorities: Sunrise Medical’s spherical-joint back supports enhance seating ergonomics, while Permobil’s drive-assist algorithms aim at curb climbing and hill descent. To defend margins, leading brands bundle extended-warranty service, IoT dashboards, and financing schemes, turning devices into subscription-ready platforms. Smaller regional firms concentrate on cost-optimized manual chairs and walkers, serving public-procurement tenders in Africa and South Asia.
Walking Assist Devices Industry Leaders
Invacare Corporation
GF Health Products Inc
Ossenberg Gmbh
Drive DeVilbiss Healthcare (Medical Depot, Inc. )
Sunrise Medical
- *Disclaimer: Major Players sorted in no particular order

Market Opportunities and Future Outlook
Smart mobility and wearable robotics create whitespace where conventional walkers and wheelchairs do not fully address navigation, safety monitoring, or neurologic gait rehabilitation. On the technology side, 2026 clinical research activity around AI-driven functional electrical stimulation (FES) and overground exoskeleton-assisted gait training supports product roadmaps that blend sensor fusion, adaptive assistance, and therapy-grade analytics into more portable form factors. Regulatory progress also broadens pathways for higher-acuity users, reinforced by the FDA 510(k) clearance expansion for the Atalante X to include individuals with high spinal cord injuries (C4 to L5) and multiple sclerosis, which widens clinical use cases for powered gait-assist systems.
In Asia-Pacific, government-backed industrialization is a tangible accelerator for rehabilitation assistive devices. In July 2026, a Three-Year Action Plan (2026-2028) issued by fourteen Chinese government agencies targeted core technological breakthroughs and flagship products spanning rehabilitation assistive devices, including healthcare robotics, while the NMPA standard YY/T 1973-2025 for medical powered lower extremity exoskeleton robots reached its implementation date on July 1, 2026. These initiatives support opportunities for manufacturers and component suppliers that can meet new testing and documentation requirements, localize production and after-sales service, and partner with distribution networks already serving hospitals, rehabilitation centers, and home-care channels.
Recent Industry Developments
- March 2026: Drive Medical launched WalkWise by Drive, a smart attachment for walkers and rollators that connects to a mobile app to track activity patterns. This product adds a digital layer to high-volume manual mobility aids, supporting differentiation through monitoring and engagement rather than frame-only features.
- February 2026: Invacare combined its Europe and Asia Pacific businesses with Direct Healthcare Group to create DHCare, headquartered in London and operating across multiple countries. The move reorganized manufacturing and commercial footprints under a single mobility and care-focused platform, strengthening scale in institutional and home-care channels.
- November 2024: MIGA Holdings completed the acquisition of Invacare's North American operations. The transaction provided a new ownership structure for a major supplier in wheelchairs and related mobility equipment, with implications for portfolio investment and channel strategy in the United States and Canada.


Research Methodology Framework and Report Scope
Market Definition and Coverage
This market is defined as revenue generated from devices that help a person stand, walk, transfer, or move safely when mobility is limited due to age, injury, or chronic conditions. It includes commonly used mobility support products sold through medical and consumer channels across major regions.
Scope exclusions: we exclude services, accessories sold separately, and home modification items such as ramps or grab bars.
Segmentation Overview
- By Product Type
- Canes
- Crutches
- Walkers/Rollators
- Wheelchairs
- Gait Belts & Lift Vests
- Power Scooters
- Others
- By Technology
- Manual Assist Devices
- Powered Mobility Devices
- Smart Sensor-Enabled Devices
- By End User
- Hospitals and Clinics
- Rehabilitation Centers
- Home-care Settings
- Elderly-care Facilities
- By Distribution Channel
- Pharmacy and Retail Stores
- E-commerce Platforms
- Medical Supply Dealers
- By Geography
- North America
- United States
- Canada
- Mexico
- Europe
- Germany
- United Kingdom
- France
- Italy
- Spain
- Rest of Europe
- Asia-Pacific
- China
- Japan
- India
- Australia
- South Korea
- Rest of Asia-Pacific
- Middle East and Africa
- GCC
- South Africa
- Rest of Middle East and Africa
- South America
- Brazil
- Argentina
- Rest of South America
- North America
Data Sources, Market Sizing, and Validation
Desk Research
Desk research starts with building a clean fact base on mobility impairment and device adoption, so the demand pool is realistic before any pricing is applied. We reference public sources such as the World Health Organization, the US CDC, the US Census Bureau age structure tables, OECD health statistics, and the World Bank population indicators to frame patient mix and aging trends.
We then check product availability, regulatory context, and sales signals using sources such as FDA device databases, publicly available HTA and reimbursement notes where applicable, company annual reports and investor decks, and reputed medical device press. A paid subscription for company financials and intelligence and a patent database are used selectively to validate active product pipelines and revenue exposure by mobility categories. These desk sources are illustrative only, and other public documents and data tables were also used for collection, validation, and clarification.
Primary Interviews and Surveys
Primary work is used to pressure test adoption, pricing, and channel assumptions that are not visible in public datasets, especially mix shifts between basic and premium mobility products. We speak with manufacturers, distributors, clinicians, and procurement and retail channel participants across the Americas, EMEA, and APAC, so regional reimbursement patterns and care setting differences are reflected in the model.
Distribution of primary research fieldwork respondents
| Company type | Respondent position | Region |
|---|---|---|
| Top tier: 29% | CXOs: 16% | APAC: 39% |
| Mid tier: 52% | Functional/Unit leaders: 25% | EMEA: 34% |
| Smaller Players: 19% | Managers: 59% | Americas: 27% |
Market-Sizing & Forecasting
Sizing is built using a top-down demand reconstruction where population aging, mobility-limiting prevalence, care setting mix, and penetration rates are translated into an addressable device demand pool by region. Once that pool is formed, average selling prices are applied using a mix view across key device categories, and the totals are converted into annual market value.
To keep the output grounded, the results are corroborated with selective bottom-up approximations such as sampled supplier revenue splits, distributor channel checks, and volume by ASP sanity checks for high-usage categories. When data is missing in certain countries, we bridge gaps using proxy indicators like elderly population share, health expenditure per capita, and device availability signals, and then recheck the implied per capita spend against nearby markets.
For forecasting, scenario analysis is used so drivers can be adjusted cleanly without overfitting, and assumptions are aligned to expert consensus gathered in interviews. Inputs commonly tracked include the 65+ population growth rate, post-acute and long-term care utilization trends, reimbursement coverage direction, average replacement cycles, and price movement between basic and premium designs (including powered mobility where relevant).
Data Validation & Update Cycle
Validation is done through multiple passes where modeled totals are compared with independent signals such as manufacturer commentary, trade flow directionality for mobility products, and region-level healthcare spending patterns. Outliers are investigated using variance checks on implied penetration, per user spend, and pricing, and then corrected only after the assumptions are traceable.
Before sign-off, the model and narrative go through stepwise analyst reviews, and experts are re-contacted when a data point materially changes the demand pool or ASP logic. Reports are refreshed annually, and interim updates are triggered when large regulatory moves, reimbursement changes, or major product launches materially shift adoption or pricing. Right before delivery, we run a fresh pass so clients receive the most current view available.
Mordor Intelligence's Walking Assist Device Market Size Compared With Other Published Estimates
Published market values for walking assist devices can differ even when they appear to cover the same topic, because scope lines and year mapping are not always consistent. Differences also come from how each publisher handles powered mobility, pricing progression, and how often assumptions are refreshed.
Wheelchairs and power scooters are counted inside Mordor Intelligence's scope for this market, which is a common reason the total sits above estimates that only total walkers, canes, crutches, rollators, and gait belts. Other gaps usually come from using different base years, applying a single global ASP without regional mix adjustments, or using an aggressive scenario that assumes faster adoption and shorter replacement cycles without enough channel validation.
Benchmark comparison
| Source | Market Size | Gaps in Research Methodology |
|---|---|---|
| Mordor Intelligence | USD 8.41 B (2026) | |
| Global Consultancy A | USD 7.39 B (2024) | Uses an earlier base year and a longer forecast window, and the published snapshot does not clearly show mix handling by device category and region, which can compress the total when powered mobility share is not explicit. |
| Industry Publisher B | USD 7.60 B (2026) | Excludes wheelchairs and mobility scooters from the definition and focuses on walking-only aids, which reduces the addressable value even if unit demand trends are similar for aging populations. |
The spread in the table is mainly explained by what is included as a walking assist device and how prices and mix are carried forward by year. Our approach keeps each device group tied to clear demand indicators and checkable pricing logic, which makes the total easier to reproduce and update when assumptions shift.


Key Questions Answered in the Report
What is the current valuation of the walking assist devices market?
The walking assist devices market is worth USD 8.41 billion in 2026 and is projected to reach USD 11.23 billion by 2031 at a 5.97% CAGR.
Which product category holds the largest share?
Wheelchairs dominate with 47.12% revenue share in 2025.
Which region is growing the fastest?
Asia-Pacific is forecast to expand at an 8.19% CAGR through 2031.
How are smart technologies influencing the market?
Smart sensor-enabled devices, including AI-driven canes and IoT-linked wheelchairs, are growing at 7.74% CAGR, outpacing manual aids.
Page last updated on:


 Your data is secure and never sold or shared.


