Virtual Laboratories Market Size and Share
Market Overview
| Study Period | 2020 - 2031 |
|---|---|
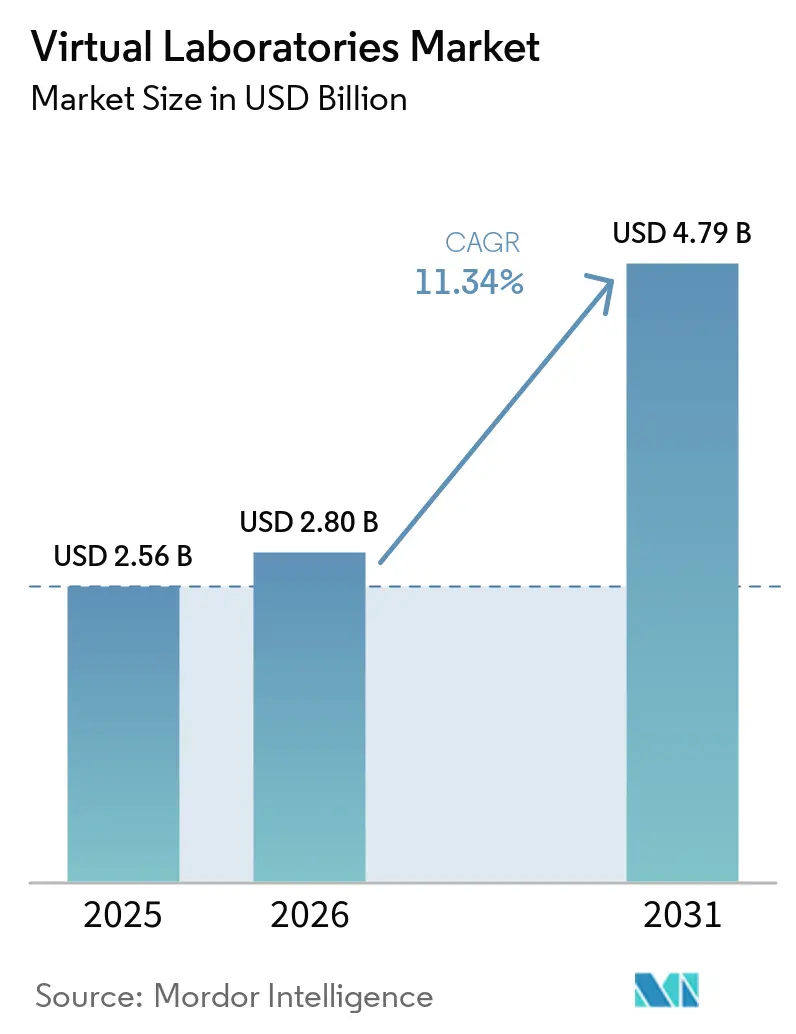
| Market Size (2026) | USD 2.80 Billion |
| Market Size (2031) | USD 4.79 Billion |
| Growth Rate (2026 - 2031) | 11.34% CAGR |
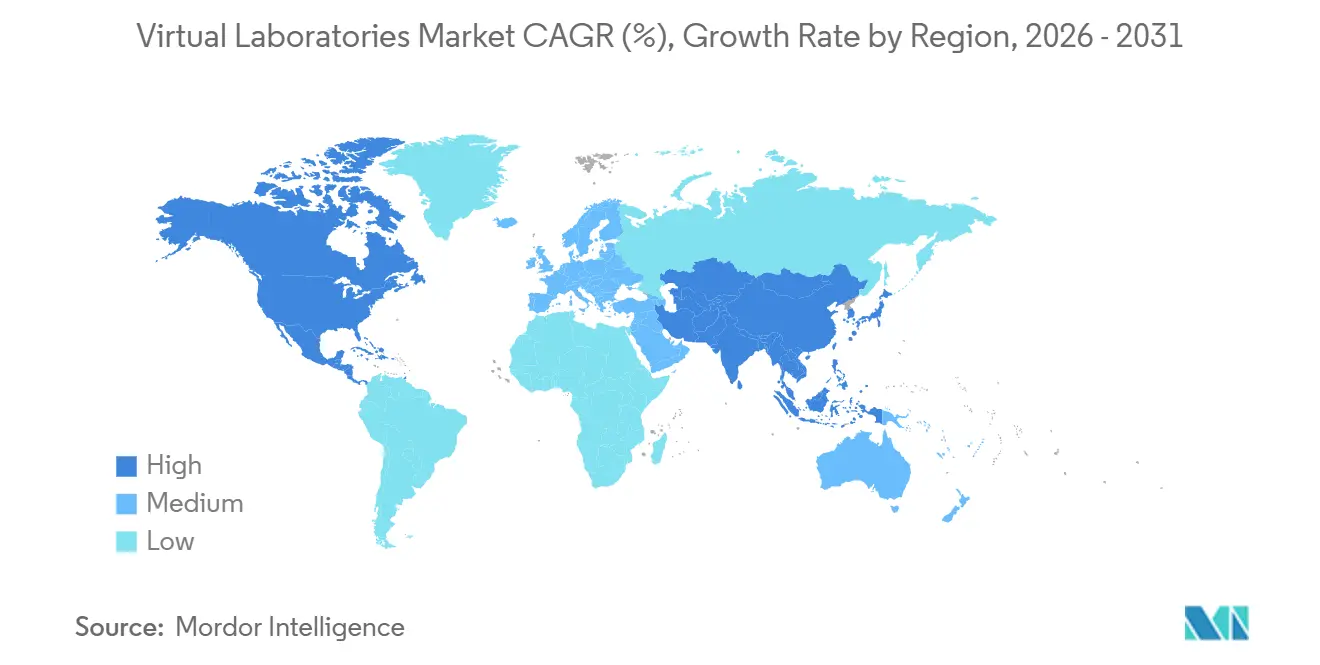
| Fastest Growing Market | Asia-Pacific |
| Largest Market | North America |
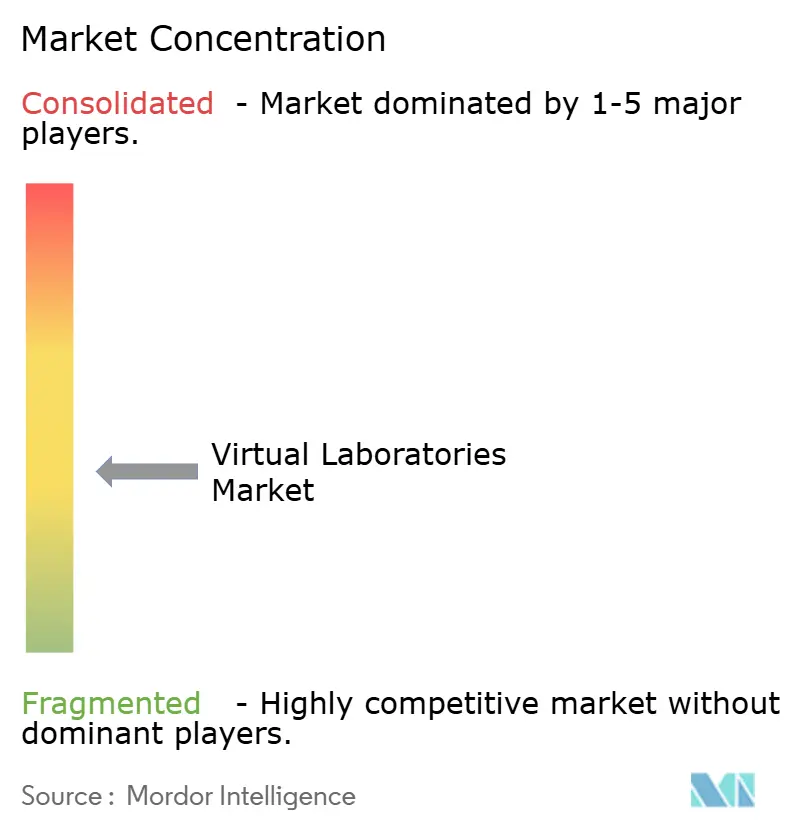
| Market Concentration | Medium |
Major Players *Disclaimer: Major Players sorted in no particular order Image © Mordor Intelligence. Reuse requires attribution under CC BY 4.0. | |
Virtual Laboratories Market Analysis by Mordor Intelligence
The virtual laboratories market size was valued at USD 2.56 billion in 2025 and is estimated to grow from USD 2.80 billion in 2026 to reach USD 4.79 billion by 2031, at a CAGR of 11.34% during the forecast period (2026-2031). The virtual laboratories market is gaining support from a clear shift in higher education, where institutions are replacing fixed physical lab capacity with digital platforms that can support more students at lower operating cost per learner. Evidence on student outcomes is also strengthening adoption, as a longitudinal Arizona State University study covering more than 4,000 students found that mandatory virtual reality biology labs were associated with lab grades of 90% or higher and a 5 percentage point improvement in STEM major retention versus the earlier cohort. That kind of proof has moved the virtual laboratories market beyond supplemental use, and it is now shaping enterprise licensing, curriculum redesign, and broader procurement across institutions that need online and hybrid science delivery at scale. Competition in the virtual laboratories market remains moderate to high because leading vendors still operate in different product lanes, yet rivalry is rising as platforms add authoring tools, analytics, cloud delivery, and broader subject coverage. The main risk remains uneven adoption, since leading universities are moving faster than the wider mid-tier, while bandwidth gaps in parts of Africa and rural South and Southeast Asia could reduce the forecast path by 100 to 150 basis points if low-bandwidth modes and faculty support programs do not scale.
Key Report Takeaways
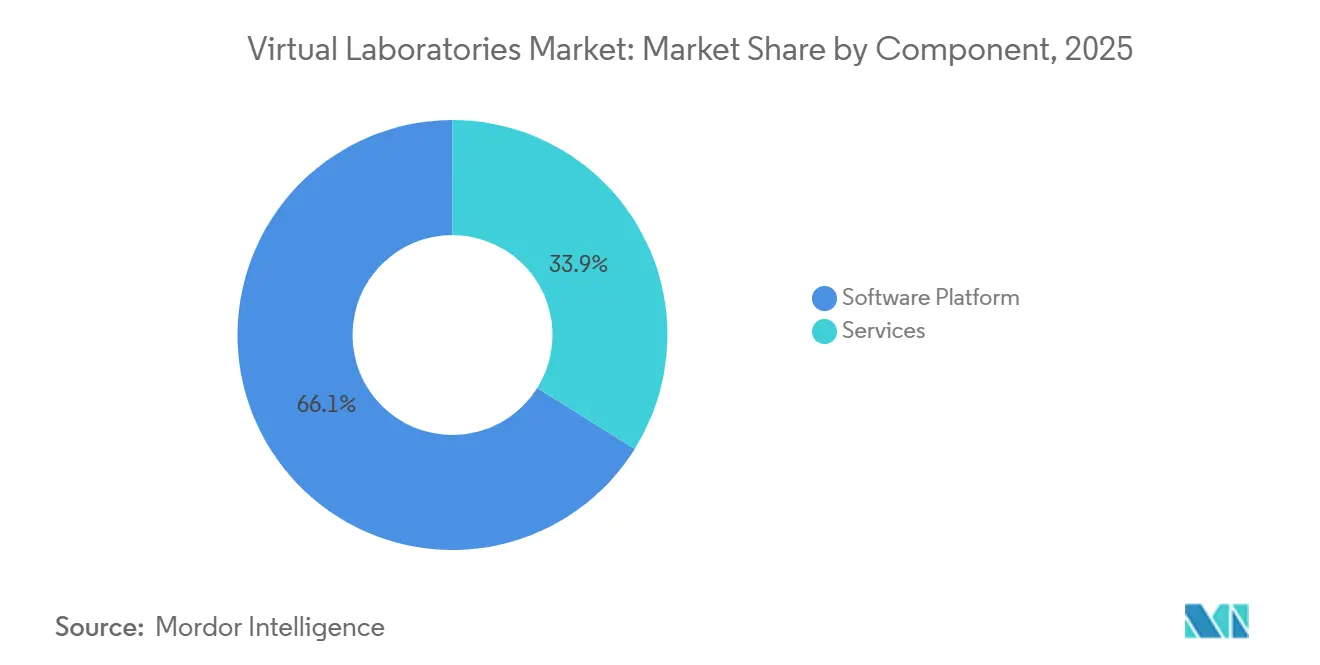
- By component, software platforms held 66.12% of 2025 revenue, while services are projected to grow at 11.87% CAGR through 2031.
- By deployment mode, cloud-based deployment accounted for 57.54% of 2025 revenue, while the same deployment mode is forecasted to expand at 12.73% CAGR through 2031.
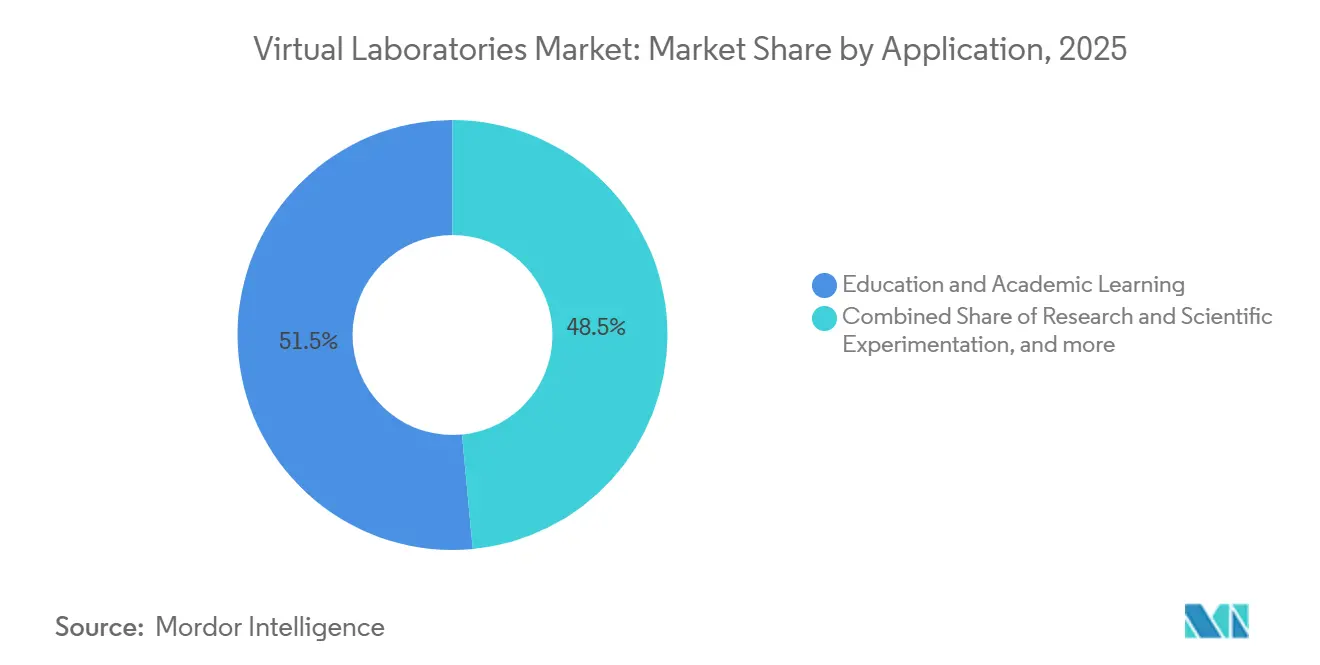
- By application, education and academic learning represented 51.49% of 2025 revenue, while research and scientific experimentation are forecasted to grow at 12.66% CAGR through 2031.
- By end-user, academic institutions held 53.28% of 2025 revenue, while research organizations are projected to expand at 12.31% CAGR through 2031.
- By geography, North America held 55.51% of the virtual laboratories market share in 2025, while Asia-Pacific is forecasted to advance at 13.22% CAGR through 2031.
Note: Market size and forecast figures in this report are generated using Mordor Intelligence’s proprietary estimation framework, updated with the latest available data and insights as of January 2026.
Global Virtual Laboratories Market Trends and Insights
Drivers Impact Analysis*
| Driver | (~) % Impact on CAGR Forecast | Geographic Relevance | Impact Timeline |
|---|---|---|---|
| Cloud-First Campus Digitization Mandates | +2.8% | Global, North America and Europe leading, with spillover to Asia-Pacific | Short term (≤ 2 years) |
| Surge in STEM Enrollments for Remote and Hybrid Programs | +2.4% | Global, with North America and Asia-Pacific as core markets | Short term (≤ 2 years) |
| Growing Corporate Upskilling Budgets for Industry 4.0 Simulations | +1.9% | North America, Europe, Asia-Pacific | Medium term (2-4 years) |
| National Virtual Lab Initiatives in K-12 Curricula | +1.4% | Asia-Pacific, Middle East and Africa, Europe | Medium term (2-4 years) |
| Edge-Rendered XR Lowers Total Cost for Immersive Labs | +1.2% | Global, with Asia-Pacific, Middle East and Africa, and South America gaining | Long term (≥ 4 years) |
| Generative-AI-Powered Auto-Lab Authoring Tools | +1.8% | North America, Europe | Short term (≤ 2 years) |
| Source: Mordor Intelligence | |||
Cloud-First Campus Digitization Mandates Expand Platform Footprints
University technology purchasing has moved from isolated course projects to institution-wide license decisions, and that change is widening the platform footprint of the virtual laboratories market across full science catalogs rather than selected lab modules. The U.S. National Science Foundation STEM K-12 program supports AI and emerging technology use in formal education, and it funds both curriculum research and implementation activity in K-12 and higher education settings. In December 2025, S. 3468 proposed a National Programmable Cloud Laboratories Network with up to 6 programmable cloud laboratory nodes under NSF and NIST oversight for standards-based remote experimentation in fields including materials science, biotechnology, and chemistry.[1]U.S. National Science Foundation, “NSF STEM K-12 (STEM K-12) Program,” National Science Foundation, nsf.gov That policy direction matters for the virtual laboratories market because common interfaces and shared standards tend to favor vendors that can connect content, analytics, identity, and workflow tools in one usable environment. As cloud mandates grow, smaller point-solution providers face more pressure to interoperate or partner, while broader platforms gain a clearer path to larger institutional contracts.
Surge in STEM Enrollments for Remote and Hybrid Programs Sustains Baseline Demand
The virtual laboratories market is benefiting from a structural shift in science enrollment, with Science Interactive reporting that online science lab enrollment rose by more than 70% while on-campus participation fell by 56%.[2]Science Interactive, “From F2F to Online, A STEM Leader's Guide to Creating Online Versions of Your On-Campus Labs,” Science Interactive, scienceinteractive.com That demand pattern did not fade in 2025, as ASU Online projected enrollment moved past 80,000 students for fall 2025, up 9% year over year. As online cohorts get larger, the cost of serving additional students through virtual labs becomes far lower than building new physical lab capacity, which changes the economics of STEM program expansion even for campuses that already have strong physical infrastructure. Labster also reported that Yavapai College improved online biology course completion by 17% between 2023 and 2024 after integrating virtual labs, which addresses one of the most common quality concerns tied to remote science teaching. This keeps baseline demand firm in the virtual laboratories market because enrollment flexibility, completion outcomes, and institutional cost control now reinforce each other rather than pulling in different directions.
Growing Corporate Upskilling Budgets for Industry 4.0 Simulations Extend Demand Beyond Academia
The virtual laboratories market is also broadening beyond schools and universities as employers spend more on technical training tied to AI, automation, and production workflows. The Association for Talent Development reported in 2025 that 75% of organizations expected to increase AI spending in the next fiscal year, while 55% had already provided AI technical skills training in 2024.[3]Association for Talent Development, “ATD Research, Optimism Remains Strong for Future of Learning in Organizations,” ATD, td.org World Economic Forum reporting showed that industrial users are already seeing operating gains from immersive simulation, with Midea cutting core skill qualification time by 63% through AI teaching, VR training, and automated certification. The same reporting noted that Mahindra & Mahindra reduced machine downtime by 25% and raised productivity by 10% through an AR and VR simulation program for tractor production. This gives the virtual laboratories market a second demand engine, where enterprise buyers value repeatable training, lower error rates, and stronger compliance outcomes, and those contracts can be larger and stickier than course-based academic licenses.
Generative-AI-Powered Auto-Lab Authoring Tools Compress Content Cycles
The virtual laboratories market is changing quickly as generative AI reduces the time and cost needed to build new simulation environments. In April 2026, EON Reality showed that Genesis 3 can generate complete immersive training worlds through generative 3D workflows rather than only producing isolated scenes. That lowers the barrier for mid-tier institutions that previously could not justify custom simulation development, and it also shortens the cycle from curriculum request to usable lab environment. A peer-reviewed study published in Scientific Reports in May 2026 found that AI-enhanced virtual labs in food microbiology produced knowledge acquisition scores of 86.3% versus 78.6% in traditional labs, while institutional cost fell by 80.9%. As authoring becomes easier, differentiation in the virtual laboratories market shifts away from raw content volume and moves toward assessment quality, LMS integration, outcome tracking, and the ability to show measurable learning or operational results.
Restraints Impact Analysis*
| Restraint | (~) % Impact on CAGR Forecast | Geographic Relevance | Impact Timeline |
|---|---|---|---|
| Faculty Resistance to Non-Traditional Lab Formats | -1.2% | Global, with the sharpest effect in emerging markets and research-intensive universities | Short term (≤ 2 years) |
| Limited Haptic Feedback Versus Physical Labs | -0.8% | Global | Long term (≥ 4 years) |
| Persistent Bandwidth Inequality Across Emerging Markets | -1.0% | Middle East and Africa, South America, South Asia, Southeast Asia | Medium term (2-4 years) |
| High IP-Protection Costs for Proprietary Experiment Models | -0.7% | North America, Europe | Medium term (2-4 years) |
| Source: Mordor Intelligence | |||
Faculty Resistance to Non-Traditional Lab Formats Slows Institutional Uptake
The main barrier in many institutions is not basic familiarity with digital tools, but whether virtual lab assessment will satisfy grading rubrics and accreditation rules that were built around bench-based work. In research-intensive universities, faculty concerns are strongest in regulated disciplines such as pharmacy, clinical biochemistry, and chemical engineering, where practical competency has to be documented in a form that outside bodies recognize. That makes the slow rollout of the virtual laboratories market rational from the institution’s perspective, because redesigning assessment, moderation, and accountability systems takes time and carries reputational risk. Providers that work with faculty to build grading frameworks, validation evidence, and course-specific implementation plans are better placed to win institutional trust than vendors that only deliver content libraries. This is why adoption in the virtual laboratories market still shows a split pattern, where a leading group of universities moves quickly while a broader middle tier remains in hybrid physical and virtual models.
Persistent Bandwidth Inequality Across Emerging Markets Limits Addressable Deployment
The virtual laboratories market still faces a hard infrastructure limit in many developing regions because immersive XR simulation often depends on stable bandwidth of 10 Mbps to 25 Mbps and very low latency to support interactive models and rich graphics. The VDMA Industrie 4.0 Qualifizierung study found that even in Germany, 76% of surveyed industrial firms viewed broadband infrastructure gaps as an obstacle to digital transformation. That challenge is more severe across rural Sub-Saharan Africa, South Asia, Southeast Asia, and parts of Latin America, where the case for virtual labs is strong because physical lab access is limited, but network quality is often too weak to support higher-fidelity experiences. This creates a difficult pattern for the virtual laboratories market, because some of the regions that need substitution for physical infrastructure the most are the regions least prepared to run advanced simulation at scale. Providers that add asynchronous modes, lighter graphics, and offline-capable applications are more likely to unlock growth in those underserved geographies over the next few years.
*Our forecasts treat driver/restraint impacts as directional, not additive. The impact forecasts reflect baseline growth, mix effects, and variable interactions.
Segment Analysis
By Component: Services Outpace Platforms as Integration Complexity Rises
Software platforms represented 66.12% of the virtual laboratories market size in 2025, while services are projected to grow at 11.87% CAGR through 2031. The larger software share reflects the central role of LMS-linked simulation libraries, adaptive assessment engines, and institution-wide licensing models in the current virtual laboratories market. These platforms remain the base layer for most deployments because universities and research institutions first need usable content, student access controls, and course integration before they can scale any advanced analytics or custom workflows. The next stage of growth is shifting toward services because implementation now includes curriculum mapping, faculty enablement, analytics setup, reporting design, and technical integration across multiple systems. That demand is rising because many institutions want the benefits of the virtual laboratories market without having the internal teams needed to manage a complex rollout on their own.
The services opportunity is becoming more important as buyers move from one-course pilots to campus-wide or multi-department adoption. As generative authoring tools make content production faster and cheaper, more lifetime value in the virtual laboratories industry is likely to come from customization, integration, and outcome measurement work that sits around the core platform. That shift favors vendors in the virtual laboratories market that can bundle software, implementation, and advisory support into one contract rather than selling simulations as a stand-alone product.


By Deployment Mode: Cloud's Lead Widens as On-Premise Carves a Premium Niche
Cloud-based deployment represented 57.54% of the virtual laboratories market size in 2025, and it is also the fastest-growing deployment mode with a 12.73% CAGR through 2031. Cloud holds the lead because the virtual laboratories market increasingly serves hybrid and online programs that need device-agnostic access, rapid updates, lower up-front cost, and easier scaling across large student populations. Universities also prefer cloud delivery because it reduces local maintenance burdens and helps central IT teams standardize access policies across departments and campuses. This preference is reinforced by policy direction, as the proposed National Programmable Cloud Laboratories Network links research access and interoperability to cloud-ready, standards-based systems.
On-premise deployment is losing relative share, but it is not disappearing from the virtual laboratories market. Pharmaceutical and biotechnology users, along with defense-linked and intelligence-linked research bodies, still value on-premise environments for IP protection, data control, and internal security policy. EON Reality stated in June 2025 that cloud-based virtual lab delivery can cut institutional operating costs by 70% to 80% and reduce dependence on equipment with more than USD 50 billion in aggregate replacement value. The result is a two-track structure in the virtual laboratories market, where cloud expands in volume segments while on-premise remains relevant in premium, high-control use cases with stricter compliance or sovereignty requirements.
By Application: Research Accelerates as In Silico Methods Replace Physical Steps
Education and academic learning held 51.49% of 2025 application revenue, while research and scietific experimentation is forecasted to grow at 12.66% CAGR through 2031. Education remains the largest application because the virtual laboratories market is already deeply embedded in core STEM instruction, especially in universities that need online or hybrid lab equivalence for accredited programs. Demand in this area is supported by student behavior as well, since Science Interactive found that nearly 90% of students said online lab options influence enrollment decisions and 30% would choose a competing institution if a required lab course was not available online. That makes virtual labs a retention and recruitment tool, not only a teaching tool, which strengthens the role of education in the current revenue mix. It also explains why institutions in the virtual laboratories market now view lab access as part of a broader enrollment and delivery strategy rather than a narrow technology purchase.
Research and scientific experimentation is growing faster because more workflows in synthetic biology, drug discovery, and materials science now treat simulation as an active experimental stage rather than a simple preparation step. Fraunhofer IESE’s VIMOPROP platform, announced in April 2026, combines digital twins, process simulation, and automated quality assurance for pharmaceutical production use cases before physical trials begin. Technical and workforce training is also rising steadily as employers expand simulation-based learning, while quality assurance and testing remains a smaller but strategically important use case where in silico tools can shorten validation cycles.

By End-User: Research Organizations Emerge as the High-Velocity Cohort
Academic institutions held 53.28% of 2025 end-user revenue, while research organizations are projected to grow at 12.31% CAGR through 2031. Academic buyers still dominate the virtual laboratories market because once a university redesigns courses, assessments, and faculty workflows around a platform, switching becomes difficult and expensive. That lock-in is reinforced by student demand, with Science Interactive reporting that nearly 90% of students consider online lab availability in their enrollment decision process. The same survey found that 30% would choose a competing institution if their lab course was unavailable online, which raises the commercial cost of not investing in digital lab delivery. This keeps academic institutions at the center of the virtual laboratories market even as other buyer groups gain momentum.
Research organizations are becoming the fastest-moving end-user cohort because AI-assisted experimentation, automation, and high-throughput workflows align well with digital simulation. Pharmaceutical and biotechnology companies form a distinct demand group within the virtual laboratories market because they use simulation less for direct cost saving and more for risk reduction during bioprocess scale-up and validation.
Geography Analysis
North America accounted for 55.51% of the virtual laboratories market share in 2025, which kept it as the leading regional revenue base. The region benefits from a dense concentration of research universities, strong edtech investment, and policy support that links science education, cloud infrastructure, and emerging technology adoption. The United States remains the main growth engine within North America, and ASU Online alone projected more than 80,000 students for fall 2025, up 9% year over year. That scale gives the virtual laboratories market a large installed base of institutions that need reliable remote lab delivery across multiple disciplines. North America is likely to hold its lead through the forecast period, although growth should be moderated by higher saturation among top-tier universities and slower conversion among community colleges and continuing education programs.
Asia-Pacific is the fastest-growing region in the virtual laboratories market, with a projected CAGR of 13.22% through 2031. Regional growth is supported by large STEM student pipelines in China, India, Japan, and South Korea, along with public programs that are embedding digital lab access into education systems. India’s Ministry of Electronics and Information Technology funded OLabs through Amrita Vishwa Vidyapeetham, with multiple tranches totaling INR 20 crore, which is equal to USD 2.4 million, and the OLabs NextG program is developing 500 additional labs over the next 3 years. South Korea also shows growing institutional commitment, as Labster’s Korean distribution arm offers more than 120 simulations and the Korea Council for University Education partnered with Korea National Open University in June 2025 to advance virtual-lab-based innovation in higher education.
Europe is the second-largest regional market, with Germany, the United Kingdom, and France anchoring demand through workforce modernization and strong university research budgets. Bitkom reported in September 2025 that 71% of German industrial companies had already deployed Industrie 4.0 technologies, and more than 80% saw major competitive implications, which supports continuing demand for simulation-led technical training. zSpace’s expansion into Poland in May 2026 shows that eastern Europe is widening the addressable base beyond the region’s traditional core markets. Middle East and Africa remains a smaller contributor, but Oman’s national rollout of 387 virtual labs across all K-12 grade levels shows how state-backed education programs can create large, concentrated opportunities. South America also offers near-term upside through online higher education growth in Brazil and expanding edtech activity in Argentina, but the pace of high-fidelity XR adoption will remain limited until network constraints improve.

Competitive Landscape
The virtual laboratories market remains moderately fragmented because no single provider controls the category across all subjects, delivery models, and end-user groups. Labster, EON Reality, zSpace, PhET Interactive Simulations, and Visible Body still operate in adjacent lanes, with Labster strongest in life sciences higher education, EON Reality focused on XR-based enterprise and institutional training, zSpace centered on hardware-linked immersive learning, PhET positioned around open-access simulation, and Visible Body tied closely to anatomy and health sciences content. Competition in the virtual laboratories market is now rising on 2 fronts, which are platform breadth across disciplines and the quality of analytics that can justify institutional spending. That dynamic means vendors can no longer rely only on catalog size, because buyers increasingly want measurable outcomes, better integrations, and faster deployment support.
Several recent moves show how quickly the competitive field is changing in the virtual laboratories market. EON Reality’s April 2026 Genesis 3 release marked a clear product shift because it generates complete immersive training environments through generative 3D workflows rather than relying on manual scene-by-scene creation. zSpace also strengthened its position in 2026 through a USD 3 million strategic investment from Planet One Education, a move aimed at international expansion, and it continued that push with new immersive STEM installations in the United States and Poland. These moves matter because they combine product expansion with geographic reach, which can shift vendor relevance across both education and training use cases.
The clearest gaps in the virtual laboratories market remain pharma and biotech simulation with built-in GMP reporting, low-bandwidth and offline-capable deployments for underserved geographies, and faculty assessment co-design services that help institutions satisfy accreditation requirements. Fraunhofer IESE’s VIMOPROP points to the first of those gaps, since it ties digital twins, process simulation, and automated quality assurance directly to pharmaceutical production use cases. Smaller players such as PraxiLabs and Veative Labs are building positions in adjacent spaces, especially where curriculum mandates or regional needs differ from the priorities of large North American platforms. Companies that can connect simulation with compliance frameworks, validated reporting, and measurable workforce outcomes should be able to win premium contracts in enterprise segments.
Virtual Laboratories Industry Leaders
Labster
Pearson Virtual Labs
McGraw Hill
PraxiLabs
Cengage
- *Disclaimer: Major Players sorted in no particular order

Recent Industry Developments
- April 2026: EON Reality launched Genesis 3, a generative 3D platform that creates entire immersive training worlds: Unlike scene-level generation, Genesis 3 builds complete curriculum environments from institutional requirements, rolling out to existing Genesis customers at no additional cost through Q2 2026. This positions EON Reality as the first platform to shift virtual lab content creation from a manual authoring workflow to an AI-generative architecture, with significant implications for content production economics across enterprise and institutional customers.
- April 2026: Fraunhofer IESE unveiled VIMOPROP for digital pharmaceutical production simulation: VIMOPROP integrates digital twins, process simulation, and automated quality assurance into a single platform designed for GMP-compliant virtual testing and scenario comparison, enabling virtual certification reports and accelerating regulatory validation and recertification. This marks a significant step toward simulation replacing physical trial runs in pharmaceutical manufacturing scale-up.
- March 2026: EON Reality launched EON Genesis 3.0 enterprise training platform: Featuring EON Genesis Interact and the EON Multi multi-platform publishing module, the platform redefines scalable workforce simulation deployment across desktop, tablet, and VR, targeting high-stakes sectors including pharma, manufacturing, and energy.
- March 2026: Bellflower Unified School District deployed 36-station zSpace Inspire AR/VR lab at Mayfair High School: The lab targets career and technical education pathways in healthcare and biological sciences, signalling the expanding role of virtual lab hardware in K-12 CTE programming, a segment with active federal workforce development funding.


Global Virtual Laboratories Market Report Scope
According to the report’s scope, the virtual laboratories market refers to the industry focused on digital platforms that simulate laboratory environments, experiments, and scientific procedures through software, cloud-based technologies, and virtual reality tools. These solutions enable students, researchers, and professionals to conduct experiments, training, and skill development remotely in a safe, cost-effective, and interactive environment.
The virtual laboratories market is segmented into component, deployment mode, application, end-user, and geography. By component, the market is segmented into software platform and services. By deployment mode, the market is segmented into cloud-based and on-premise. By application, the market is segmented into education and academic learning, research and scientific experimentation, workforce training and skill development, industrial testing and quality assurance, and product development and simulation. By end-user, the market is segmented into academic institutions, research organizations, pharmaceutical and biotechnology companies, and other end-users. By geography, the market is segmented into North America, Europe, Asia-Pacific, the Middle East and Africa, and South America. The report also covers the estimated market sizes and trends for 17 countries across major regions globally. The report offers values (USD) for all the above segments.
| Software Platform |
| Services |
| Hardware and Devices |
| Cloud-Based |
| On-Premise |
| Education and Academic Learning |
| Research and Scientific Experimentation |
| Workforce Training and Skill Development |
| Industrial Testing and Quality Assurance |
| Product Development and Simulation |
| Academic Institutions |
| Research Organizations |
| Pharmaceutical and Biotechnology Companies |
| Other End-Users |
| North America | United States |
| Canada | |
| Mexico | |
| Europe | Germany |
| United Kingdom | |
| France | |
| Italy | |
| Spain | |
| Rest of Europe | |
| Asia-Pacific | China |
| Japan | |
| India | |
| Australia | |
| South Korea | |
| Rest of Asia-Pacific | |
| Middle East and Africa | GCC |
| South Africa | |
| Rest of Middle East and Africa | |
| South America | Brazil |
| Argentina | |
| Rest of South America |
| By Component | Software Platform | |
| Services | ||
| Hardware and Devices | ||
| By Depolyment Mode | Cloud-Based | |
| On-Premise | ||
| By Application | Education and Academic Learning | |
| Research and Scientific Experimentation | ||
| Workforce Training and Skill Development | ||
| Industrial Testing and Quality Assurance | ||
| Product Development and Simulation | ||
| By End-User | Academic Institutions | |
| Research Organizations | ||
| Pharmaceutical and Biotechnology Companies | ||
| Other End-Users | ||
| By Geography | North America | United States |
| Canada | ||
| Mexico | ||
| Europe | Germany | |
| United Kingdom | ||
| France | ||
| Italy | ||
| Spain | ||
| Rest of Europe | ||
| Asia-Pacific | China | |
| Japan | ||
| India | ||
| Australia | ||
| South Korea | ||
| Rest of Asia-Pacific | ||
| Middle East and Africa | GCC | |
| South Africa | ||
| Rest of Middle East and Africa | ||
| South America | Brazil | |
| Argentina | ||
| Rest of South America | ||


Key Questions Answered in the Report
What is driving growth in virtual laboratories through 2031?
Growth is being supported by the shift to cloud-based science delivery, rising online and hybrid STEM enrollment, stronger outcome evidence, and expanding use in research and workforce training. The virtual laboratories market is forecasted to grow at 11.34% CAGR and reach USD 4.79 billion by 2031.
Which part of the category holds the largest revenue share today?
Software platforms led with 66.12% of revenue in 2025 because institutions still need simulation libraries, LMS integration, and assessment tools as the base layer of deployment.
Which segment is growing fastest in the current forecast period?
Services is the fastest-growing component at 11.87% CAGR, cloud deployment is the fastest-growing delivery mode at 12.73% CAGR, research and scientific experimentation leads applications at 12.66% CAGR, and research organizations are the fastest-growing end-user group at 12.31% CAGR.
Which region offers the strongest near-term opportunity?
Asia-Pacific has the highest projected growth rate at 13.22% CAGR through 2031, supported by large STEM student pipelines and public virtual lab programs such as India’s OLabs expansion.
Page last updated on:


