Microscope Software Market Size and Share
Market Overview
| Study Period | 2020 - 2031 |
|---|---|
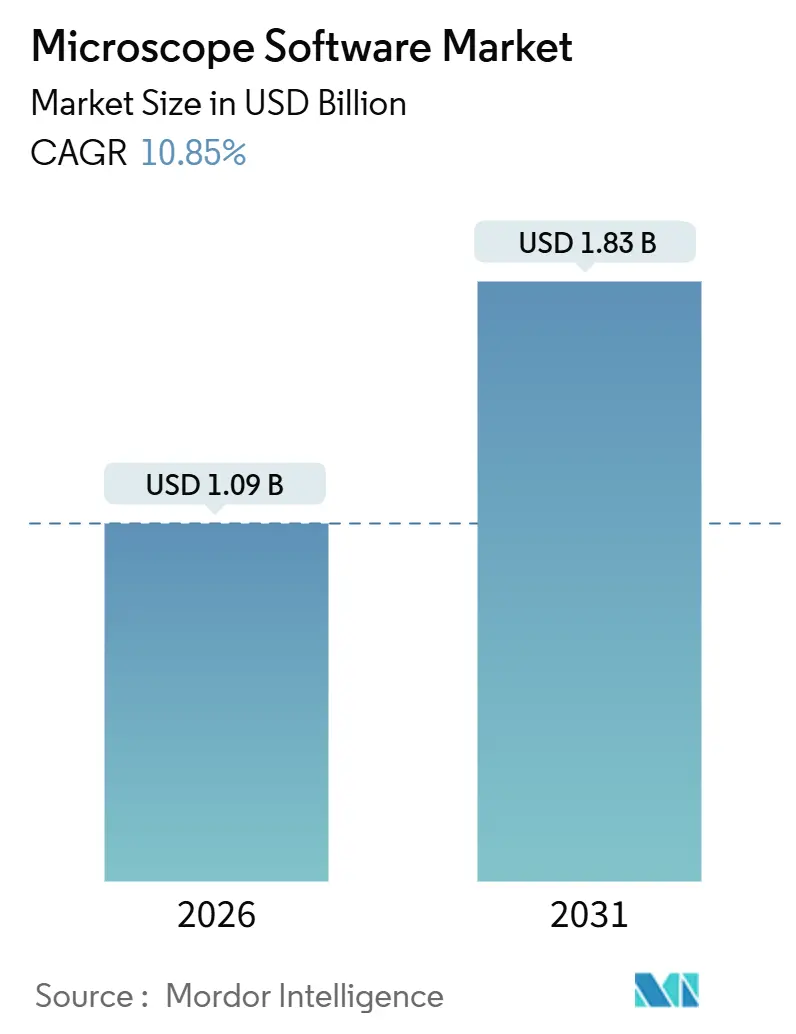
| Market Size (2026) | USD 1.09 Billion |
| Market Size (2031) | USD 1.83 Billion |
| Growth Rate (2026 - 2031) | 10.85% CAGR |
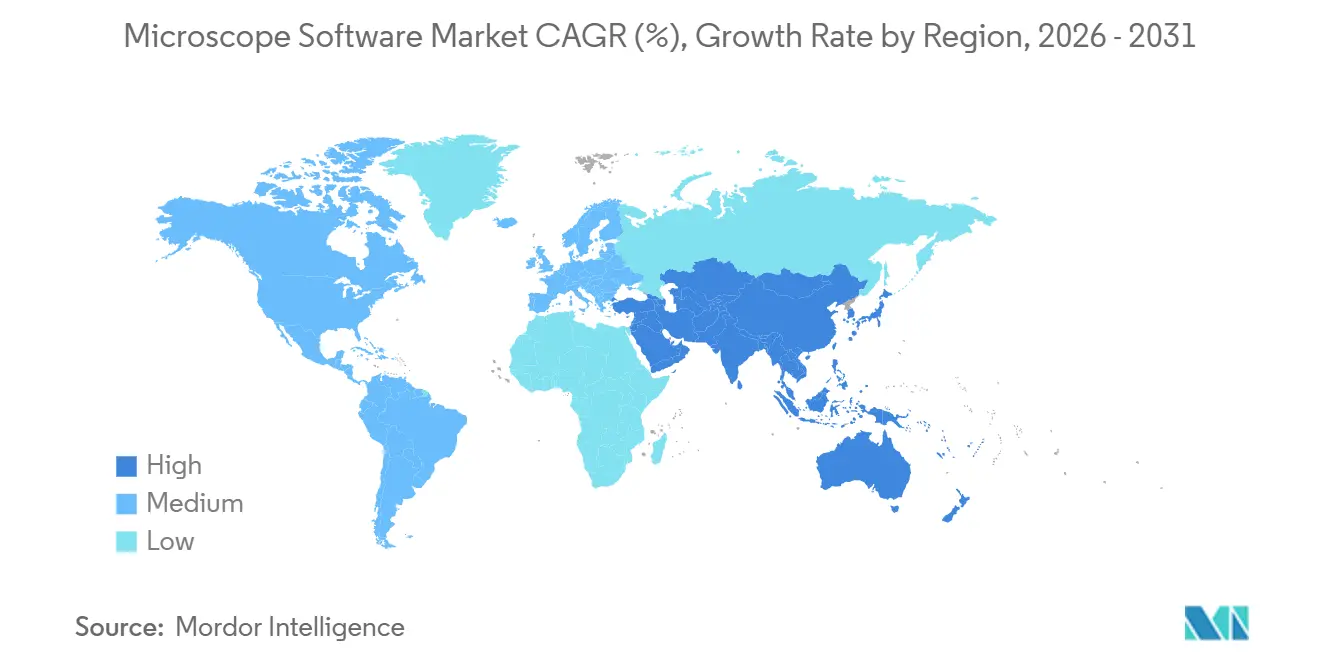
| Fastest Growing Market | Asia Pacific |
| Largest Market | North America |
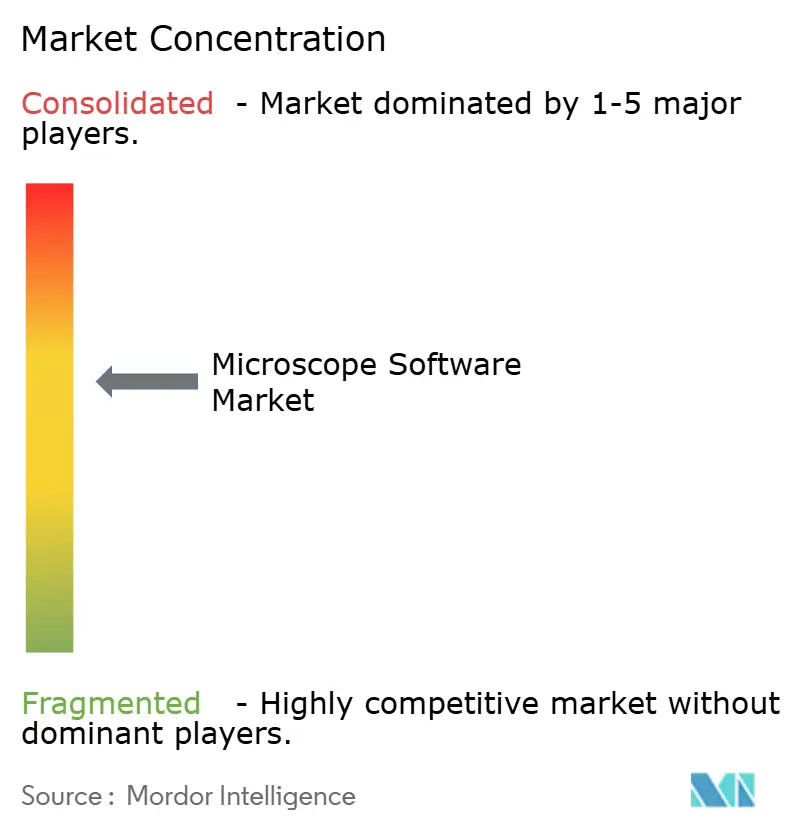
| Market Concentration | Medium |
Major Players *Disclaimer: Major Players sorted in no particular order Image © Mordor Intelligence. Reuse requires attribution under CC BY 4.0. | |
Microscope Software Market Analysis by Mordor Intelligence
The Microscope Software Market size is estimated at USD 1.09 billion in 2026, and is expected to reach USD 1.83 billion by 2031, at a CAGR of 10.85% during the forecast period (2026-2031).
Interest in cloud-native imaging platforms, real-time artificial intelligence, and subscription pricing is accelerating purchases, while generous public budgets for life-science research shorten replacement cycles in academic and pharmaceutical facilities. Software vendors that embed graphics-processing-unit acceleration directly within acquisition workflows are winning contracts from high-content screening laboratories that now capture terabytes of spatial-omics imagery each day. Governments in North America, Europe, and Asia continue to fund digital pathology and nanotechnology, thereby promoting the broader adoption of integrated visualization tools that reduce diagnostic backlogs and support precision medicine rollouts. Competitive strategies revolve around bundling proprietary code with hardware, pursuing modality-agnostic plugins, and forming bioinformatics partnerships that close gaps in spatial-omics data integration. Region-specific data-sovereignty laws, however, inflate hosting costs and complicate global SaaS rollouts, forcing vendors to balance infrastructure investments against near-term revenue gains.
Key Report Takeaways
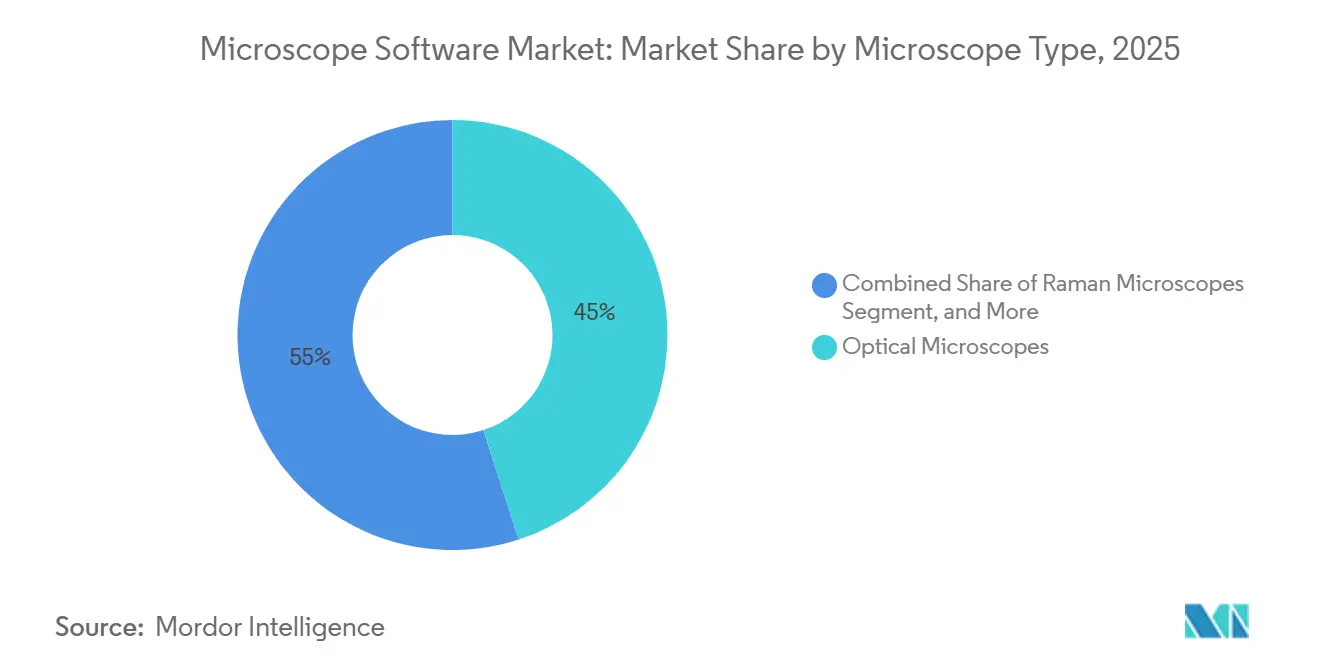
- By microscope type, optical instruments led with 45.01% of the microscope software market share in 2025. Raman systems are forecast to post an 11.67% CAGR through 2031, the fastest growth rate among microscope types.
- By software type, integrated suites accounted for 51.57% of the microscope software market size in 2025. AI/ML automation modules are on track to expand at a 12.82% CAGR between 2026 and 2031.
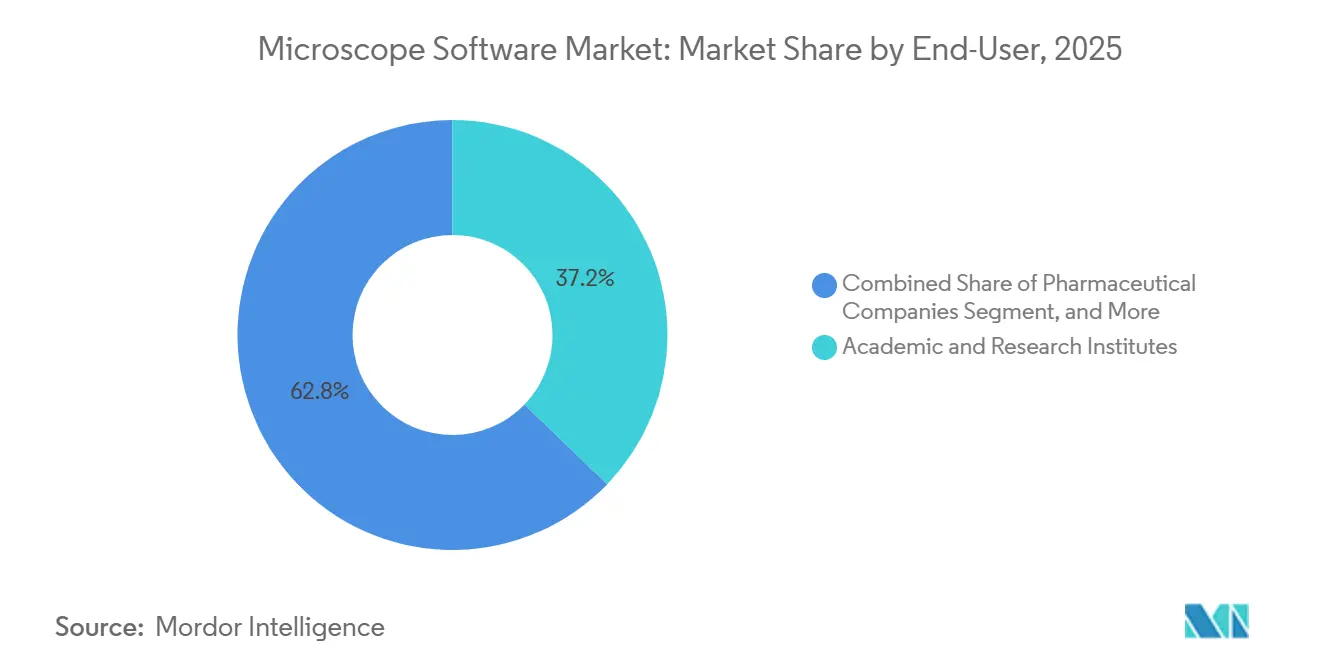
- By end-user, academic and research institutes accounted for 37.22% of 2025 revenue, while pharmaceutical and biotechnology companies are set to grow at a 13.96% CAGR through 2031.
- By geography, North America accounted for 36.03% of 2025 revenue, but Asia-Pacific will grow at a 15.91% CAGR through 2031.
Note: Market size and forecast figures in this report are generated using Mordor Intelligence’s proprietary estimation framework, updated with the latest available data and insights as of January 2026.
Global Microscope Software Market Trends and Insights
Drivers Impact Analysis*
| Driver | (~) % Impact on CAGR Forecast | Geographic Relevance | Impact Timeline |
|---|---|---|---|
| Escalating Life-Science & Nanotech R&D Funding | +2.3% | Global focus in North America, EU, China | Medium term (2-4 years) |
| AI/ML-Powered High-Throughput Image Analysis | +2.8% | Early adoption in North America and Western Europe | Short term (≤ 2 years) |
| Surge in Digital Pathology & Tele-Diagnostics Adoption | +1.9% | North America, EU, Australia, India, Brazil | Medium term (2-4 years) |
| Shift Toward SaaS Licensing Lowering Capex Barriers | +1.6% | Global, notably APAC and Latin America | Short term (≤ 2 years) |
| Integration of Microscope Software with Spatial-Omics | +1.5% | North America, EU, Singapore, South Korea | Long term (≥ 4 years) |
| ASEAN Export-Control Relaxation Enabling Local OEM Bundling | +0.8% | Thailand, Vietnam, Malaysia | Long term (≥ 4 years) |
| Source: Mordor Intelligence | |||
Escalating Life-Science & Nanotech R&D Funding
Expanded national budgets continue to open the door to the purchase of sophisticated imaging platforms. Horizon Europe earmarks EUR 95.5 billion for 2021-2027 initiatives, prioritizing digital health and life sciences programs that rely on high-resolution microscopy.[1]European Commission, “Horizon Europe Programme,” EC, ec.europa.eu Japan’s Agency for Medical Research and Development deployed JPY 140 billion in 2024 toward regenerative medicine and drug-discovery projects using live-cell imaging. India’s biotechnology sector advanced 14% year-over-year during 2024, with contract research organizations in Hyderabad and Pune installing high-content screening suites to meet multinational demand. Pharmaceutical enterprises are rapidly internalizing imaging cores; Genentech added 12 confocal systems in 2025, each licensed to enterprise software tiers that support multi-user authentication and secure cloud archiving. These investments obligate vendors to ship modules tuned for lattice light-sheet, adaptive optics, and other once-niche modalities that are moving toward mainstream adoption.
AI/ML-Powered High-Throughput Image Analysis
Artificial intelligence has repositioned imaging from a documentation workflow into a near-real-time decision engine. Nikon’s NIS-Elements AI classifies cell phenotypes during acquisition and shrinks post-processing cycles from hours to minutes.[2]Nikon Corporation, “NIS-Elements AI Product Launch,” Nikon, nikon.com Yokogawa’s CQ1 cytometer segments organoids on the fly, enabling 384-well pharmaceutical screens to complete in under 30 minutes. The United Kingdom’s National Health Service issued guidance in February 2025 encouraging the use of AI-assisted digital pathology, a move expected to accelerate hospital procurement of ISO 13485-compliant software.[3]National Health Service, “Digital Pathology Guidance February 2025,” NHS, nhs.uk Philips reports 15-20% throughput gains, and up to 37% in labs that pair automated slide scanning with algorithmic triage. Despite these wins, algorithm validation remains complex; the United States Food and Drug Administration has cleared fewer than 10 AI-based microscopy products to date, leaving regulatory uncertainty for clinical market entrants.
Surge in Digital Pathology & Tele-Diagnostics Adoption
COVID-19 demonstrated that pathologists can interpret whole-slide images remotely, pushing health systems to digitize slides and procure microscope software market solutions for tele-diagnosis. Australia’s Royal College of Pathologists now mandates digital-pathology training for all new fellows, reinforcing demand for intuitive viewer platforms. Brazil’s Ministry of Health launched a 2025 pilot connecting rural clinics to urban pathology hubs via cloud-based slide viewers, aiming to achieve 30% shorter turnaround times. Roche secured FDA clearance in 2024 for its uPath enterprise suite, integrating scanners, case management, and AI support to reduce manual triage. Because clinicians insist on sub-200-millisecond navigation latency, vendors deploy edge-caching servers inside hospitals, accepting higher upfront complexity to win clinical approval.
Shift Toward SaaS Licensing Lowering Capex Barriers
Subscription pricing democratizes access to cutting-edge analytics. Zeiss rolled out Arivis Cloud in 2024, letting labs rent 3D visualization and machine-learning features for a few hundred dollars per month rather than investing tens of thousands in perpetual licenses. Evident reported SaaS revenue contributing 18% of 2024 software income, up from 7% in 2022, illustrating the appeal of recurring revenue streams. The model resonates with small biotechs across Southeast Asia and Latin America where on-premises IT budgets are thin. Regulated pharmaceutical quality-control labs, however, demand “frozen” versions for validation, prompting vendors to offer locked SaaS tiers that preserve software state for compliance audits.
Restraints Impact Analysis*
| Restraint | (~) % Impact on CAGR Forecast | Geographic Relevance | Impact Timeline |
|---|---|---|---|
| High Upfront Licence & Maintenance Costs | -1.4% | Global, acute in India, Brazil, Eastern Europe | Short term (≤ 2 years) |
| Shortage of Skilled Imaging Informatics Personnel | -1.1% | Worldwide, severe in APAC and Latin America | Medium term (2-4 years) |
| Data-Sovereignty Laws Restricting Cloud Deployment | -0.9% | EU, China, India, emerging in Brazil, South Africa | Medium term (2-4 years) |
| Algorithm-IP Litigation Risk Delaying Launches | -0.6% | North America and EU | Long term (≥ 4 years) |
| Source: Mordor Intelligence | |||
High Upfront Licence & Maintenance Costs
Perpetual licenses for elite 3D visualization or deconvolution suites run from USD 15,000 to USD 50,000, with annual maintenance adding 15-20%. Many Indian and Brazilian labs allocate under USD 10,000 per year for all imaging software, forcing reliance on unsupported open-source tools. Pharmaceutical facilities face validation expenses of USD 50,000-100,000 per module, discouraging rapid upgrades. Leica’s LAS X requires three-year subscriptions that strain contract research organizations with variable project pipelines. Usage-based pricing models exist but remain niche outside cloud-centric startups.
Shortage of Skilled Imaging Informatics Personnel
A 2024 European Molecular Biology Organization survey revealed 63% of imaging cores struggled to fill computational roles. Fewer than 30 universities offer bioimage-analysis degrees, tightening labor pipelines. Recursion Pharmaceuticals hired 40 imaging scientists in 2024, raising mid-level salaries to USD 120,000-150,000 and intensifying competition. Vendors simplify interfaces. Evident’s cellSens 4.0 added wizard workflows, yet training custom deep learning models still requires coding proficiency. Five-day commercial courses cost USD 3,000 per attendee and routinely sell out.
*Our forecasts treat driver/restraint impacts as directional, not additive. The impact forecasts reflect baseline growth, mix effects, and variable interactions.
Segment Analysis
By Microscope Type: Raman Systems Drive Pharmaceutical Uptake
Raman microscopes are advancing at an 11.67% CAGR, the swiftest among instrument classes, as manufacturers adopt the modality for non-destructive chemical confirmation of active pharmaceutical ingredients. Thermo Fisher’s DXR3xi system, launched in 2024, automates counterfeit-drug detection through spectral libraries. Optical instruments dominated 45.01% of 2025 revenue owing to their prevalence in teaching and pathology labs, yet growth is shifting toward specialty confocal and super-resolution models that demand richer analytics. Electron microscopes, especially cryo-EM units, serve structural biology and semiconductor inspection. Gatan’s Digital Micrograph added real-time drift correction in 2024, trimming data-collection times by one-third.
Raman adoption correlates with stricter authenticity requirements. The United States Pharmacopeia revised Chapter 1119 in 2024, recommending Raman spectroscopy for raw-material verification. Software now matches spectra against databases containing over 50,000 pharmaceutical compounds, reducing false positives to below 2%. Emerging algorithmic advances enable cryo-EM structures of 50-kilodalton proteins, broadening the market for electron-imaging platforms. AI-powered autofocus within optical systems, such as Nikon’s Perfect Focus System 4, secures uninterrupted imaging during stem-cell differentiation studies.


By Software Type: AI Modules Reshape Screening Workflows
Integrated suites accounted for 51.57% of 2025 revenue, reflecting tight bundling with hardware purchases, yet AI/ML automation modules are projected to grow at a 12.82% CAGR through 2031. Molecular Devices’ MetaXpress added a low-code deep learning studio in 2024, allowing bench scientists to train neural networks without programming. Cloud SaaS platforms attract early-stage biotech firms; Aivia’s cloud option eliminates workstation purchases at USD 10,000-15,000 and instead charges consumption-based fees.
Stand-alone academic packages such as Fiji continue to dominate research-oriented environments, with over 2 million downloads each year. Commercial alternatives supply validated algorithms for regulated markets but remain expensive. Recursion Pharmaceuticals’ proprietary pipeline screens 2.2 million images weekly, underscoring how automation compresses discovery timelines. Integrated suite vendors open plugin architectures—Zeiss’s ZEN now accepts third-party AI tools—to prevent client churn as modality-agnostic platforms gain traction.
By End-User: Pharma Outpaces Academia in Spending Growth
Academic and research institutes controlled 37.22% of 2025 revenue, yet flat public funding tempers upgrade cycles. Pharmaceutical and biotechnology companies will expand at a 13.96% CAGR through 2031, capitalizing on imaging for target identification, lead optimization, and safety studies. Hospitals and diagnostic centers grow steadily as national health systems digitize slides; the United Kingdom’s GBP 200 million program equips 40 hospital trusts with enterprise viewers and AI triage.
Drug makers increasingly build internal imaging cores to avoid contracting bottlenecks. Genentech’s 2025 expansion added 12 confocal and six high-content systems, backed by a 50-person bioinformatics team. Contract research organizations lose service revenue as sponsors reinsource imaging, while core academic facilities often defer software refreshes; 42% operate software versions older than 3 years. Hospital buyers prioritize interoperability with laboratory information systems, advantaging established vendors that already integrate HL7 messaging.
Geography Analysis
North America held 36.03% of 2025 revenue. Mature installed bases mean replacement, not greenfield growth, dominates; 68% of U.S. academic labs run versions at least three years old. Europe benefits from Horizon Europe and Germany’s Excellence Strategy, which channels EUR 533 million annually into research clusters equipped with advanced imaging. Fragmented procurement rules across European states complicate vendor sales cycles. The Middle East invests selectively; Saudi Arabia’s Zeiss Lattice Lightsheet 7 installation at KAUST adds regional imaging capacity. South American growth centers on Brazil and Argentina, but currency swings elevate software costs, delaying purchases. Africa remains embryonic outside South Africa’s cryo-EM hub in Cape Town.
Asia-Pacific registers the fastest CAGR of 15.91% to 2031, propelled by national biotechnology agendas and an expanding pharmaceutical footprint. China’s 14th Five-Year Plan commits CNY 370 billion to research infrastructure, including cryo-EM centers in Shanghai, Beijing, and Shenzhen. Domestic players Hitachi High-Tech and JEOL develop electron-microscope software that minimizes reliance on Western algorithms subject to export controls.
Japan’s Ministry of Health, Labour and Welfare approved reimbursement for AI-assisted cancer diagnosis in 2024, motivating hospital procurement budgets worth USD 150 million annually. India’s biotechnology sector rose 14% in 2024, with CROs in Hyderabad and Pune installing high-content systems to serve multinational drug developers. South Korea’s Institute for Basic Science opened a Xenium spatial-omics facility in 2025 to investigate gastric cancer microenvironments. Australia funds shared microscopy centers through AUD 85 million in 2024 co-investment grants, each of which requires multi-user licensing.

Competitive Landscape
Market concentration is moderate. Hardware-software bundling remains the leading lock-in strategy; Zeiss’s ZEN suite embeds proprietary data formats, making switching costs exceed USD 100,000 when retraining and pipeline reconfiguration are included. Pure-play vendors such as arivis and Scientific Volume Imaging court facilities operating mixed instrument fleets, highlighting modality-agnostic data ingestion and flexible plugin support.
AI differentiation drives competitive momentum. Vendors publish benchmark scores for standard Cell Painting assays, with leaders reporting 95% phenotype-classification accuracy, compared with 85% for rule-based rivals. Zeiss filed 14 patents in 2024 centered on real-time segmentation, while Nikon targets predictive autofocus algorithms. Leica partnered with Amazon Web Services in 2025 to deliver managed Kubernetes clusters, cutting customer deployment from weeks to hours. MIPAR pursues materials-science niches with specialized algorithms for grain boundaries.
Consolidation accelerates. Danaher acquired Abcam for USD 5.7 billion in 2024, integrating high-content screening software into its portfolio. Regulatory scrutiny grows; the European Commission opened a 2025 investigation into whether bundling hardware and proprietary software violates competition law, potentially mandating interoperability. Open-source initiatives gather steam; the napari project’s 2024 plugin architecture invites community algorithms, eroding proprietary pricing power.
Microscope Software Industry Leaders
Carl Zeiss AG
Danaher (Leica Microsystems)
Olympus Corporation
Thermo Fisher Scientific Inc.
Nikon Corporation
- *Disclaimer: Major Players sorted in no particular order

Recent Industry Developments
- January 2026: Seattle’s Alpenglow Biosciences partners with PathNet to bring its 3D microscope technology into clinical prostate and bladder cancer diagnostics.
- December 2025: Intellicule secures an NIH grant to develop biomolecular modeling software designed to accelerate precision-medicine drug discovery.


Global Microscope Software Market Report Scope
The Microscope Software Market is defined as the global industry segment that develops and provides software solutions for controlling microscopes, acquiring images, analyzing data, and managing workflows across research, clinical, and industrial applications. It includes integrated software bundled with microscopes as well as standalone platforms that enhance imaging, visualization, and quantitative analysis.
The Microscope Software Market Report is Segmented by Microscope Type (Optical, Electron, Raman, Scanning-Probe, Other Advanced Modalities), Software Type (Integrated Suites, Stand-Alone Packages, AI/ML Modules, Cloud SaaS Platforms), End-User (Academic & Research, Pharmaceutical & Biotech, Hospitals & Diagnostics, Other), and Geography (North America, Europe, Asia-Pacific, Middle East & Africa, South America). Market Forecasts are Provided in Value (USD).
| Optical Microscopes |
| Electron Microscopes |
| Raman Microscopes |
| Scanning-Probe Microscopes |
| Other Advanced Modalities |
| Integrated Software Suites |
| Stand-Alone Image-Analysis Packages |
| AI/ML Automation Modules |
| Cloud-Based SaaS Platforms |
| Academic & Research Institutes |
| Pharmaceutical & Biotechnology Companies |
| Hospitals & Diagnostic Laboratories |
| Other End Users |
| North America | United States |
| Canada | |
| Mexico | |
| Europe | Germany |
| United Kingdom | |
| France | |
| Italy | |
| Spain | |
| Rest of Europe | |
| Asia-Pacific | China |
| Japan | |
| India | |
| Australia | |
| South Korea | |
| Rest of Asia-Pacific | |
| Middle East & Africa | GCC |
| South Africa | |
| Rest of Middle East & Africa | |
| South America | Brazil |
| Argentina | |
| Rest of South America |
| By Microscope Type | Optical Microscopes | |
| Electron Microscopes | ||
| Raman Microscopes | ||
| Scanning-Probe Microscopes | ||
| Other Advanced Modalities | ||
| By Software Type | Integrated Software Suites | |
| Stand-Alone Image-Analysis Packages | ||
| AI/ML Automation Modules | ||
| Cloud-Based SaaS Platforms | ||
| By End-User | Academic & Research Institutes | |
| Pharmaceutical & Biotechnology Companies | ||
| Hospitals & Diagnostic Laboratories | ||
| Other End Users | ||
| By Geography | North America | United States |
| Canada | ||
| Mexico | ||
| Europe | Germany | |
| United Kingdom | ||
| France | ||
| Italy | ||
| Spain | ||
| Rest of Europe | ||
| Asia-Pacific | China | |
| Japan | ||
| India | ||
| Australia | ||
| South Korea | ||
| Rest of Asia-Pacific | ||
| Middle East & Africa | GCC | |
| South Africa | ||
| Rest of Middle East & Africa | ||
| South America | Brazil | |
| Argentina | ||
| Rest of South America | ||


Key Questions Answered in the Report
What is the projected value of the microscope software market in 2031?
The market is forecast to reach USD 1.83 billion by 2031, reflecting a 10.85% CAGR from 2026.
Which microscope type is growing the fastest in software demand?
Raman systems show the quickest uptake, advancing at an 11.67% CAGR as pharmaceutical firms use them for nondestructive chemical verification.
Why are AI/ML automation modules attracting investment?
They compress high-content screening analysis from days to hours, supporting rapid phenotypic drug-discovery programs and lowering labor costs.
How do data-sovereignty rules affect cloud-based imaging platforms?
Regulations in the EU, China, and India require local data hosting, raising infrastructure costs by roughly 25-35% and compelling vendors to open regional data centers.
Which region will add the most new revenue through 2031?
Asia-Pacific leads with a 15.91% CAGR, buoyed by large public biotechnology budgets and expanding pharmaceutical manufacturing capacity.
Page last updated on:


