
Vanadium Market Size and Share
Market Overview
| Study Period | 2021 - 2031 |
|---|---|
| Market Size (2026) | USD 3.34 Billion |
| Market Size (2031) | USD 4.12 Billion |
| Growth Rate (2026 - 2031) | 4.26 % |
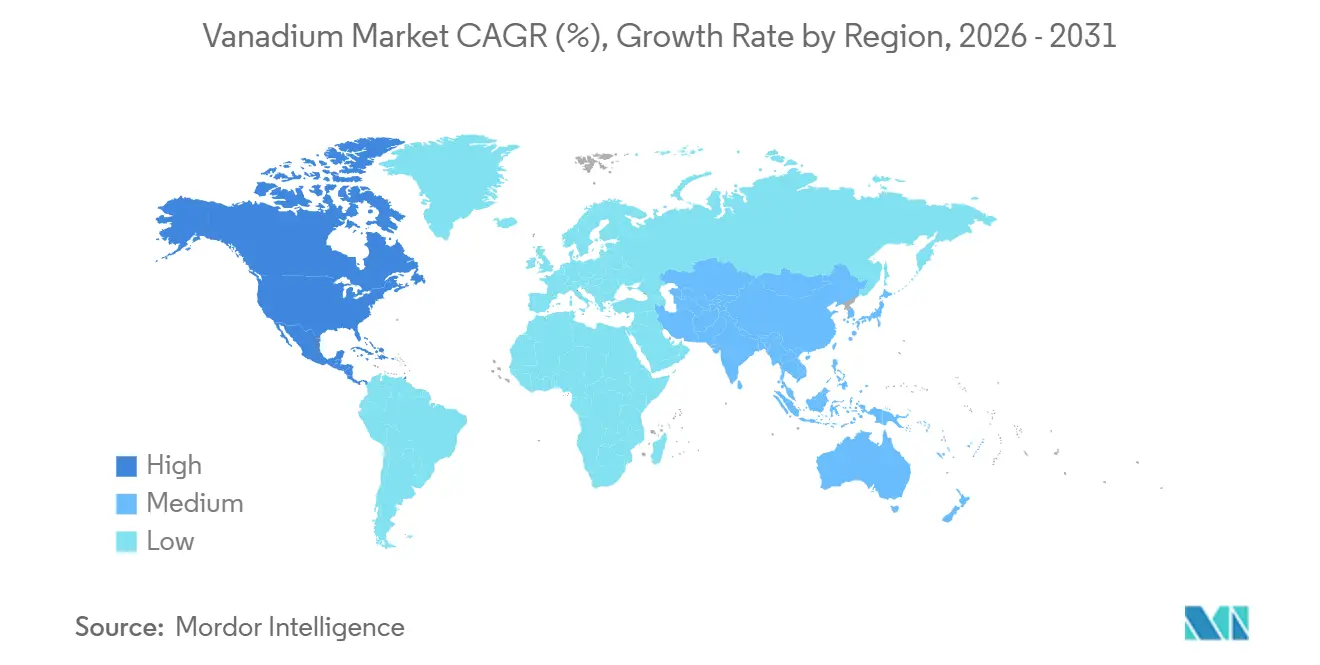
| Fastest Growing Market | North America |
| Largest Market | Asia-Pacific |
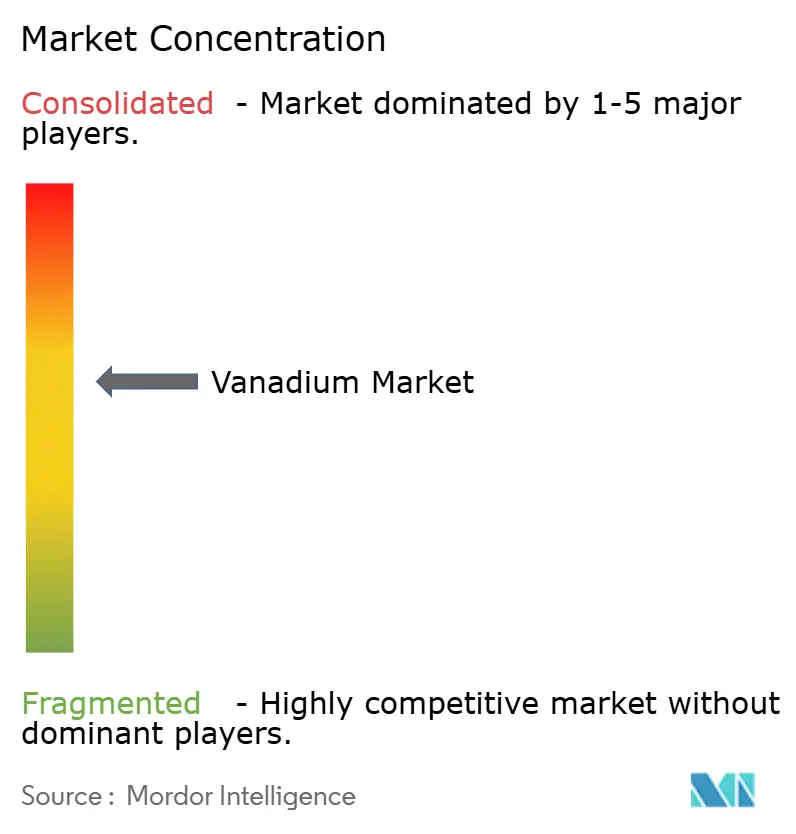
| Market Concentration | Medium |
Major Players *Disclaimer: Major Players sorted in no particular order Image © Mordor Intelligence. Reuse requires attribution under CC BY 4.0. | |
Vanadium Market Analysis by Mordor Intelligence
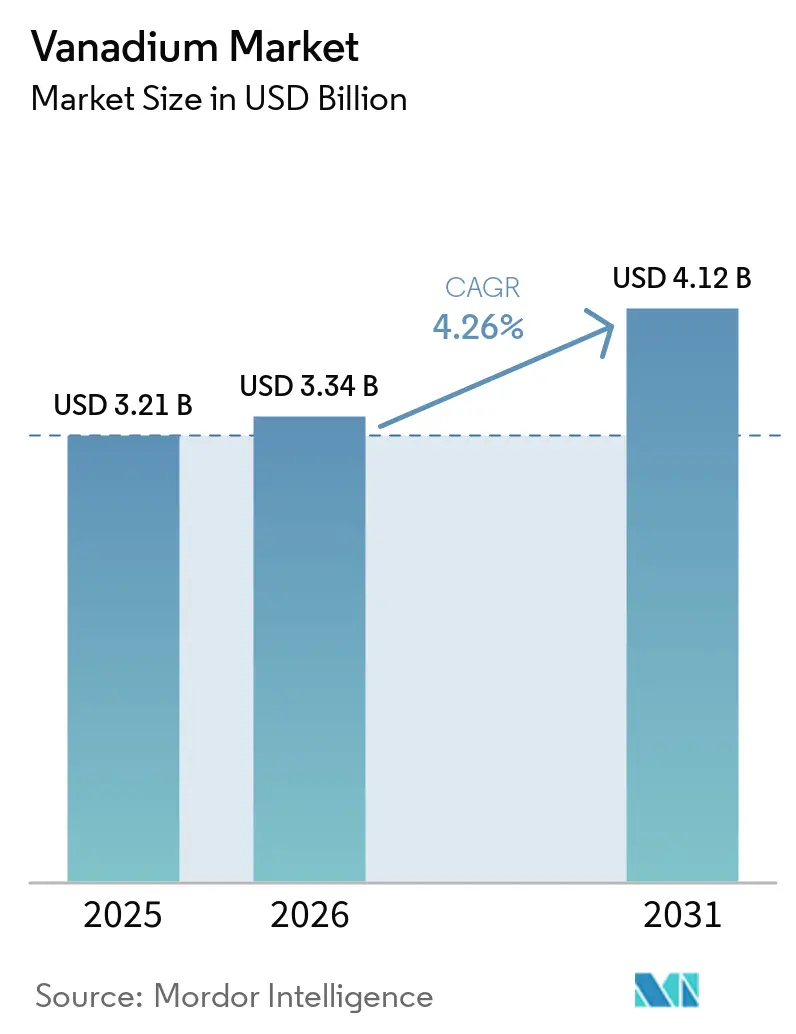
The vanadium market size was valued at USD 3.21 billion in 2025 and is estimated to grow from USD 3.34 billion in 2026 to reach USD 4.12 billion by 2031, at a CAGR of 4.26% during the forecast period (2026-2031). Steel microalloying remains the main source of demand, while long-duration energy storage is broadening the use base for vanadium. China’s mandatory rebar standard has raised the required vanadium intensity of qualifying construction steel, creating demand that is tied to compliance as well as construction volumes. The vanadium market also benefits from rising use of vanadium redox flow batteries, which store energy for long periods and can support renewable generation and data-center power needs. Supply remains concentrated in China and Russia, which makes diversification, recycling, and electrolyte leasing important for buyers outside those countries [1]U.S. Geological Survey, “Mineral Commodity Summaries 2026, Vanadium,” U.S. Geological Survey, pubs.usgs.gov. These conditions create opportunities across the vanadium market for producers that can supply qualified high-purity material and for battery companies that can lower the upfront cost of flow battery projects.
Key Report Takeaways
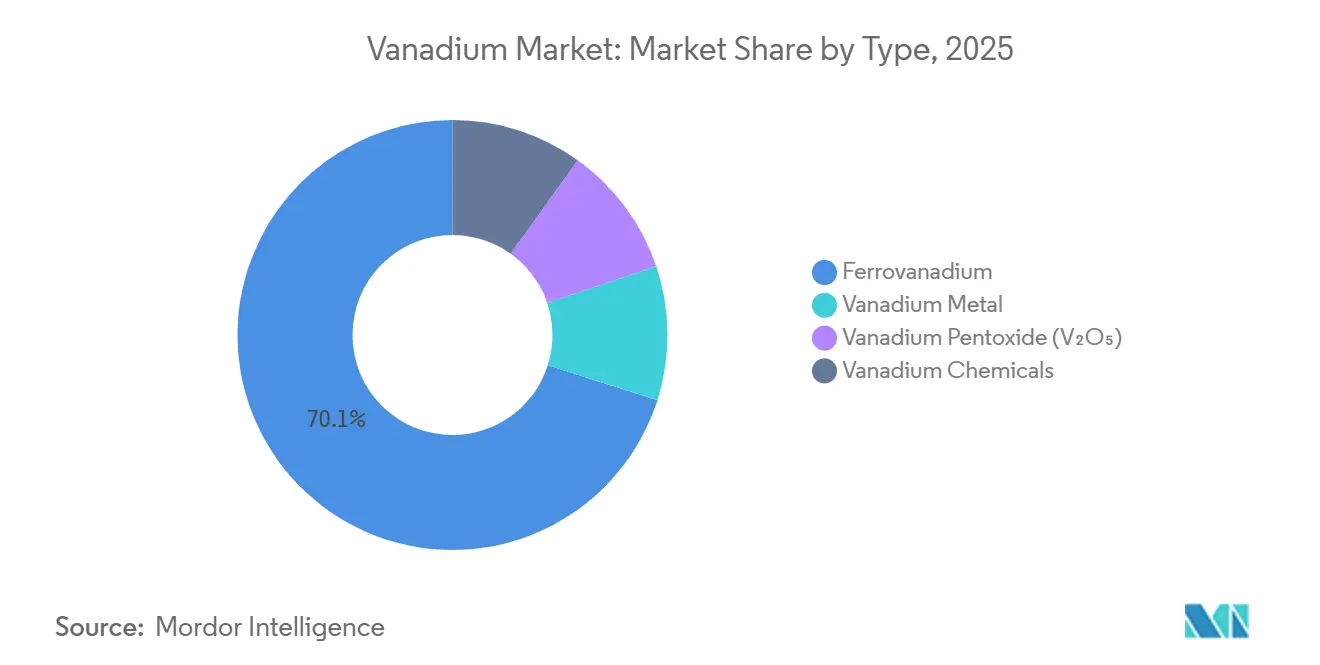
- By type, ferrovanadium held 70.1% of global revenue in 2025, while vanadium pentoxide is forecast to grow at a 5.4% CAGR through 2031.
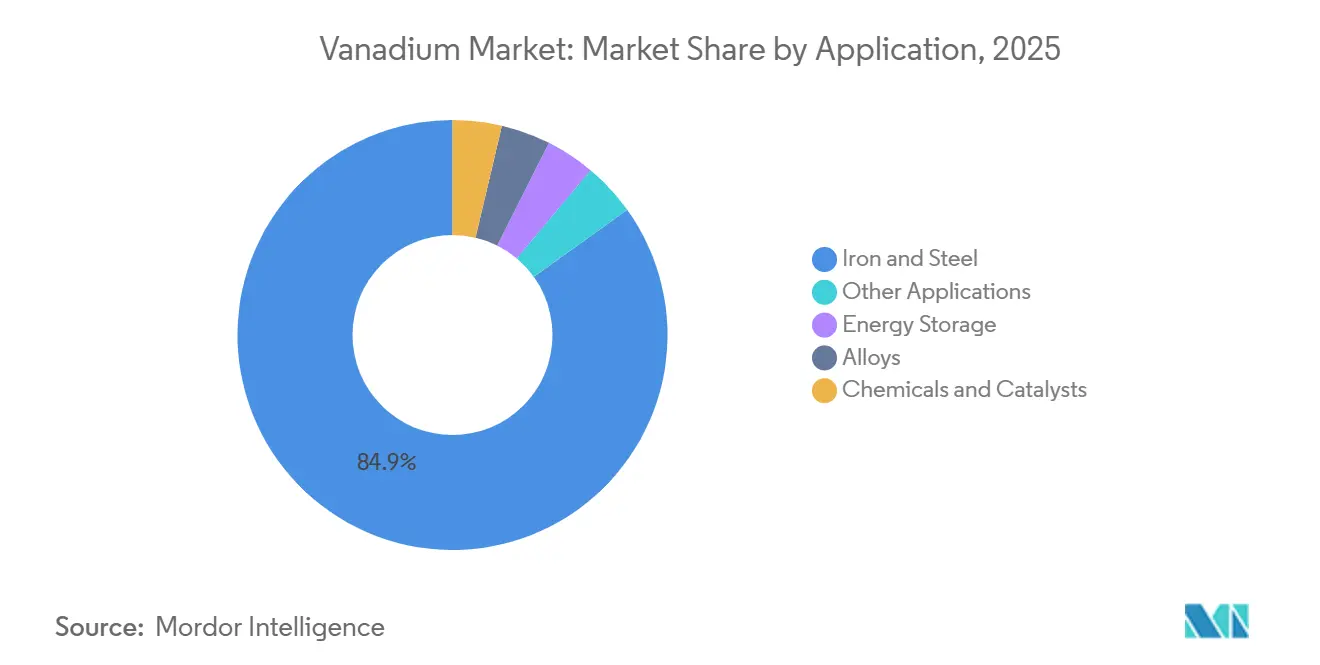
- By application, iron and steel represented 84.9% of demand in 2025, while energy storage is forecast to grow at a 7.5% CAGR through 2031.
- By geography, Asia-Pacific held 61.6% of global revenue in 2025, while North America is forecast to grow at a 6.1% CAGR through 2031.
Note: Market size and forecast figures in this report are generated using Mordor Intelligence’s proprietary estimation framework, updated with the latest available data and insights as of January 2026.
Global Vanadium Market Trends and Insights
Drivers Impact Analysis*
| Driver | (~) % Impact on CAGR Forecast | Geographic Relevance | Impact Timeline |
|---|---|---|---|
| High-Strength Steel and Infrastructure Demand | +1.30% | Global, concentrated in APAC and North America | Medium term (2–4 years) |
| Grid-Scale Vanadium Redox Flow Battery Deployment | +1.20% | APAC (China dominant), with increasing spillover to North America & Europe | Long term (≥ 4 years) |
| Higher Vanadium Intensity in Chinese Rebar Standards | +0.70% | China, with secondary effects on seaborne supply flows to Europe and East Asia | Short term (≤ 2 years) |
| Aerospace and Titanium-Alloy Demand | +0.30% | North America & Europe, with fast-growing contribution from APAC | Long term (≥ 4 years) |
| Data-Center Power Growth Creating Long-Duration Storage Demand | +0.50% | North America & Europe core, with APAC follow-on | Medium term (2–4 years) |
| Closed-Loop Vanadium Electrolyte Leasing and Recycling | +0.20% | Global, with early adoption in North America and China | Long term (≥ 4 years) |
| Source: Mordor Intelligence | |||
High-Strength Steel and Infrastructure Demand Drives Ferrovanadium Consumption
Public infrastructure spending supports ferrovanadium demand because high-strength steel is used in transmission towers, pipelines, heavy equipment, and major structures. China’s ultra-high-voltage transmission program is an important demand channel for structural and tower-grade high-strength low-alloy steel. This type of spending is less dependent on residential construction than ordinary rebar consumption. U.S. apparent vanadium consumption reached 13,000 metric tons in 2025, and metallurgical uses represented more than 90% of that volume. Offshore wind towers and power transmission assets also need stronger steel than many conventional structures. The vanadium market, therefore, has exposure to electricity infrastructure as well as to general construction activity.
The performance benefit comes from small additions of vanadium to steel, which can increase yield strength while maintaining ductility and weldability. Adding 0.05% vanadium to structural steel can raise yield strength by 30% to 100%. This helps steelmakers meet demanding specifications without relying on substantially heavier sections. India’s steel demand was forecast to grow 7.4% in 2025, which supports its role as an incremental source of ferrovanadium consumption. Aerospace and titanium alloy demand add a smaller, higher-value use for vanadium-bearing materials. Together, these uses reduce but do not remove the vanadium market’s reliance on the steel cycle.
Grid-Scale Vanadium Redox Flow Battery Deployment Unlocks a Structural Demand Channel
Vanadium redox flow batteries are expanding the metal’s role in stationary energy storage. The Jimusaer project in Xinjiang entered commercial operation in January 2026 with a 200 MW and 1,000 MWh configuration, making it the first gigawatt-hour-scale vanadium flow battery project. The project involved CNY 3.8 billion and used equipment supplied by Rongke Power. Its scale gives battery developers and grid operators a visible example of a long-duration storage installation. The vanadium market can gain from such projects because electrolyte demand is directly linked to deployed battery capacity. Large projects can also bring procurement and performance standards that make later projects easier to finance.
Global long-duration energy storage installations exceeded 15 GWh in 2025. Vanadium redox flow batteries represented 21% of the installed volume in that account. China’s 2025-2027 new energy storage action plan as a policy backdrop for annual flow battery production capacity. The useful characteristic of a flow battery is that the vanadium electrolyte can be recovered at the end of the battery’s operating life. This supports reuse and reduces the risk that electrolyte becomes a stranded cost after a project closes. It also means that new projects build a continuing inventory of vanadium within the storage system.
Higher Vanadium Intensity in Chinese Rebar Standards Validates a Multi-Year Demand Floor
China’s State Administration for Market Regulation published GB 1499.2-2024 on June 25, 2024, and the standard took effect on September 25, 2024[2]Vanitec, “Chinese Vanadium Steel Rebar Standard Becomes Mandatory 25 September 2024,” Vanitec, vanitec.org. The standard changed the prior voluntary benchmark into binding requirements for rebar manufactured, sold, imported, or used in Chinese construction. It therefore raises the importance of material compliance in the country’s construction-steel supply chain. Approximately 22.9% of sampled rebar did not meet the earlier standard’s mechanical-property requirements. Closing this gap requires changes in the qualifying material rather than only changes in demand volumes. This makes the regulation an important near-term factor for the vanadium market.
The standard also introduced HRB600E anti-seismic rebar with 600 MPa yield strength. This grade requires higher vanadium additions than the commonly used HRB400E grade. Pangang Group estimated that the transition could add more than 13,000 metric tons a year to vanadium-nitride consumption. Steelmakers may choose vanadium where they need to meet strength, ductility, and welding requirements under structural codes. The regulatory setting can therefore support vanadium use even during a weaker construction period. At the same time, lower rebar output can limit total ferrovanadium demand, so compliance does not fully separate the vanadium market from China’s steel cycle.
Data-Center Power Growth Creates Persistent Demand for Long-Duration Vanadium Storage
Data centers can have high peak loads during intensive computing tasks. Invinity Energy Systems states that GPU-cluster training can have peak-to-average power ratios from 4:1 to 9:1[3]Matt Harper, “How Vanadium Flow Batteries Unlock More Computing Power in Next-Gen Data Centres,” Invinity Energy Systems, invinity.com. The company describes a 120 MW peak-load campus with a 20 MW average load that could maintain full cluster capacity using a 60 MW grid connection and a vanadium flow battery buffer. This configuration can reduce the grid connection needed for the same computing capacity. It makes long-duration storage relevant to data-center planning, not only to renewable integration. The vanadium market could benefit if this application moves from pilot designs to regular campus infrastructure.
A 1.5 GWh flow battery project at the Laufenberg, Switzerland, data-center campus can be expanded to 2.1 GWh, with Invinity serving as the technology partner. Flow batteries use non-flammable electrolytes, which can be important where fire risk influences project approval, insurance, or site design. Their long operating life also makes them suitable for assets intended to operate over several decades. These features do not eliminate competition from other energy storage technologies, but they position vanadium-based flow batteries for applications requiring longer discharge durations and high safety standards.
Restraints Impact Analysis*
| Restraint | (~) % Impact on CAGR Forecast | Geographic Relevance | Impact Timeline |
|---|---|---|---|
| Dependence on Chinese Steel-Cycle Demand | -1.30% | China-centric, with spillover effects on global ferrovanadium pricing | Short term (≤ 2 years) transitioning to medium term |
| Supply Concentration and Geopolitical Disruption | -0.90% | Global, most acute in North America and Europe | Medium term (2–4 years) |
| Battery-Chemistry Substitution in Short-Duration Storage | -0.40% | North America & Europe, emerging in APAC | Long term (≥ 4 years) |
| High-Purity Qualification and Electrolyte Bankability Constraints | -0.20% | Global, most acute in North America and Europe | Medium term (2–4 years) |
| Source: Mordor Intelligence | |||
Dependence on Chinese Steel-Cycle Demand Compresses Near-Term Growth
Iron and steel represented 84.9% of vanadium demand in 2025, leaving the market closely tied to Chinese construction steel consumption. Chinese rebar output had declined by 5% to 7% a year over the preceding 4 years as the property sector reduced leverage. Rising vanadium intensity per ton of rebar partly offsets lower rebar production. It does not guarantee that total demand will rise when steel volumes fall. Chinese vanadium pentoxide averaged USD 5.02 per pound in 2025, compared with USD 5.44 per pound in 2024[4]U.S. Geological Survey, “Mineral Commodity Summaries 2026, Vanadium,” U.S. Geological Survey, pubs.usgs.gov. This price pattern reflects the pressure that weaker steel activity can place on the vanadium market.
Vanadium can compete with niobium, molybdenum, and manganese in some steel applications. Sustained price weakness can affect the timing of specifications that would favor one alloying material over another. Lower prices can also reduce cash flow for producers outside China. That can defer exploration, mine development, and other spending intended to diversify supply. The result is a difficult balance for consuming regions seeking secure non-Chinese supply. The vanadium market remains exposed to this tension because its largest application is still steelmaking.
Supply Concentration and Geopolitical Disruption Constrain Market Resilience
China produced 82,000 metric tons of contained vanadium in 2025 from a global total of 110,000 metric tons. Russia contributed 21,000 metric tons in the same year. South African production fell to an estimated 5,000 metric tons, compared with 8,050 metric tons in 2024, after changes to Bushveld Minerals’ assets and operations. These figures show why supply interruption is a major issue for the vanadium market. A limited number of producing countries control both mined material and important processing capacity. Buyers in Europe, North America, and Japan have limited room to replace disrupted primary supply quickly.
A peer-reviewed 2025 study reported that 3 countries have held more than 90% of primary vanadium production since the start of the century. The same study states that China holds more than 50% of global vanadium pentoxide refining capacity. This concentration makes secondary supply, recycling, and used petroleum catalysts relevant to procurement planning. It also raises the value of high-purity qualification, because not every source can meet the requirements of battery electrolyte or strategic stockpile buyers. Short-duration battery chemistries can constrain flow battery demand in some applications. Electrolyte leasing can address financing barriers, but its effect depends on credible recovery, storage, and residual-value arrangements.
*Our forecasts treat driver/restraint impacts as directional, not additive. The impact forecasts reflect baseline growth, mix effects, and variable interactions.
Segment Analysis
By Type: Ferrovanadium Anchors Value, Vanadium Pentoxide Supports Energy Storage
Ferrovanadium held 70.1% of the vanadium market share in 2025. It is used directly as a microalloying material in high-strength low-alloy steel for construction, pipelines, and heavy machinery. The vanadium market size associated with this segment is supported by the need for steel that meets demanding strength and ductility requirements. U.S. ferrovanadium with 78% to 82% vanadium content averaged USD 14.14 per pound in 2025, compared with USD 13.05 per pound in 2024. This reflects the effects of domestic supply conditions and trade measures in the United States. Ferrovanadium’s position is strongest where 600 MPa seismic-grade rebar needs a reliable combination of yield strength, ductility, and weldability.
Vanadium pentoxide is forecast to record the highest type-segment CAGR at 5.4% from 2026 to 2031. It is an upstream material used for both vanadium-nitrogen alloy production and vanadium flow battery electrolyte. The vanadium market is affected when these two demand channels call on the same pentoxide production stream at the same time. Shared demand can tighten available capacity when construction steel and energy-storage activity rise together. Vanadium chemicals and vanadium metal serve smaller applications that have higher unit values. These uses include aerospace master alloys, sulfuric acid catalysts, ceramics, pigments, and specialty materials. Their role gives producers an option to reduce exposure to commodity-grade steel demand.



By Application: Iron & Steel Holds the Largest Position, Energy Storage Grows Faster
Iron and steel accounted for 84.9% of demand in 2025. This position reflects the long-established role of vanadium in construction steel and other high-strength alloy systems. China’s approved ultra-high-voltage transmission projects required high-strength steel for towers and structural components. This creates a source of demand that is linked to grid investment rather than residential property construction alone. High-strength low-alloy steel is also needed in pipelines, heavy machinery, wind equipment, and other infrastructure assets. The vanadium market size for steel use remains materially larger than its other application areas. This concentration explains why changes in Chinese rebar output still influence overall demand and pricing.
Energy storage is projected to post a 7.5% CAGR from 2026 to 2031. The application is moving from demonstration projects toward larger commercial installations, including the 1,000 MWh Jimusaer project. Flow batteries are suited to long-duration storage because their energy capacity can be increased through the electrolyte system. Alloys, especially titanium-vanadium and aluminum-vanadium master alloys, are smaller premium applications. Commercial aviation demand for vanadium in aerospace applications at 2,840 metric tons in 2025. Chemicals and catalysts provide stable demand through vanadium pentoxide used in sulfuric acid production, ceramics, and pigments. Other applications and specialty structural research represent the remaining consumption base.
Geography Analysis
Asia-Pacific held 61.6% of global revenue in 2025. China’s output of 82,000 metric tons of contained vanadium and its large steel sector explain the region’s leading position. The region also has early deployment of vanadium flow batteries. In January 2026, SK Innovation and SK On signed a memorandum of understanding with Standard Energy to expand into vanadium-ion energy storage systems. This points to growing interest in battery chemistries beyond lithium iron phosphate. Asia-Pacific is therefore central to both conventional steel demand and newer stationary-storage demand.
India is a growing secondary demand center within Asia-Pacific. Its steel demand was forecast to rise 7.4% in 2025. NTPC Renewable Energy awarded a 100 MWh flow battery project at Khavda Solar Park in Gujarat in July 2026, which was described as India’s first grid-scale project of this type. The project is estimated to require 1,600 to 1,800 metric tons of vanadium pentoxide equivalent for electrolyte. Such projects broaden demand beyond China while keeping Asia-Pacific important to the vanadium market. They also demonstrate how solar generation and long-duration storage can be developed together.
North America is forecast to grow at a 6.1% CAGR from 2026 to 2031, the fastest regional rate. The region’s growth is linked to critical-mineral supply-chain policy, infrastructure spending, and a developing flow battery pipeline. Largo received a five-year U.S. Defense Logistics Agency contract for up to 2,876 metric tons of high-purity vanadium pentoxide in June 2026, with a ceiling value of USD 125 million. Europe maintains ferrovanadium demand through its steel industries and is adding flow battery capacity. Invinity completed the 20.7 MWh Copwood Energy Hub in East Sussex in May 2026, described as Europe’s largest operational vanadium flow battery. South America is mainly a supply region through Largo’s Maracás Menchen Mine, while the Middle East and Africa depend on South African recovery and longer-term energy-transition procurement.

Competitive Landscape
The vanadium market is moderately concentrated at the production level. Pangang Group, HBIS Group, China Vanadium Titano-Magnetite Mining, and China Ansteel Group are identified as leading high-volume producers. Their positions are supported by integrated titaniferous magnetite operations and captive steel demand. China’s large share of mine output reinforces the influence of these domestic producers. Outside China, Largo Inc., AMG Critical Materials, U.S. Vanadium LLC, Gulf Chemical and Metallurgical Corporation, and Core Metals Group compete through supply, processing, and battery-grade material capabilities. Competitive strength increasingly depends on the ability to meet purity and traceability requirements for energy-storage customers.
Largo’s June 2026 agreement with the U.S. Defense Logistics Agency covers the supply of high-purity vanadium pentoxide for up to 2,876 metric tons. The contract gives the company a defined role in the U.S. strategic material supply chain. AMG Critical Materials acquired AURA Technologie GmbH in Germany for EUR 10 million in the first quarter of 2026. This move expands its downstream high-purity processing position. Sumitomo Electric was selected by Hokkaido Electric Power Network for a third vanadium redox flow battery project in April 2026, with a 20-year service agreement. These actions show that producers, processors, and technology integrators are competing across more than raw material supply.
Electrolyte leasing is changing how flow battery projects can be financed. Vanadium electrolyte represents 40% to 60% of total project capital cost. Largo Physical Vanadium Corp. and Panzhihua Urban Construction & Transportation Group, working with Rongke Power, are cited as participants in models that retain electrolyte ownership and lease it to project developers. This approach can reduce the upfront funding requirement for storage projects. Japan’s JC-STAR certification and European battery due-diligence requirements can also increase the value of established suppliers with qualified products. The competitive structure remains consistent with a concentration score of 8 because China and Russia together accounted for more than 85% of mine production, while leading participants control important supply and processing positions.
Vanadium Industry Leaders
Pangang Group Vanadium and Titanium Resources Co., Ltd.
EVRAZ plc
Glencore plc
Bushveld Minerals Limited
Largo Inc.
- *Disclaimer: Major Players sorted in no particular order

Recent Industry Developments
- August 2026: Largo Inc. commenced full-scale copper and platinum group metals (PGMs) production as by-products at its Maracás Menchen Mine in Brazil, following Brazilian Mining Agency approval. The copper-PGM concentrate production adds diversification revenue while lowering effective vanadium cash costs and is expected to generate 300 to 380 tons per month, positioning Largo as a multi-critical-mineral supplier.
- August 2026: Largo reported Q2 2026 financial results reflecting 68% revenue growth and a positive adjusted EBITDA, with V₂O₅ equivalent production reaching 2,900 tons, up 28.5% year on year, and year-to-date production of 5,516 tons, 55.2% above H1 2025 levels, driven by improved ore availability and expanded milling capacity.
- July 2026: Largo secured a USD 60.1 million firm-fixed-price delivery order from the U.S. Department of War under its five-year DLA Strategic Materials IDIQ contract, covering high-purity V₂O₅ deliveries through January 2030. The order formally integrates Largo into the U.S. national defense supply chain for a critical mineral for which there is no domestic U.S. primary production.
- June 2026: Largo Inc. was awarded a five-year IDIQ contract by the U.S. Defense Logistics Agency for supply of up to 2,876 metric tons of high-purity V₂O₅, with a ceiling value of USD 125 million, representing the first DoD-level formalization of vanadium as a strategic stockpile material in the current critical-minerals era.


Global Vanadium Market Report Scope
Vanadium is a hard, silvery-gray transition metal with the chemical symbol V and atomic number 23. It is primarily used as an alloying element in steel and titanium alloys to improve strength, hardness, wear resistance, and corrosion resistance. Vanadium compounds, particularly vanadium pentoxide (V₂O₅), are also widely used in catalysts, chemicals, ceramics, and vanadium redox flow batteries (VRFBs) for large-scale energy storage.
The Vanadium Market Report is segmented by type, application, and geography. By type, the market is segmented into ferrovanadium, vanadium pentoxide (V₂O₅), vanadium chemicals, and vanadium metal. By application, the market is segmented into iron & steel, energy storage, alloys, chemicals & catalysts, and other applications. The report also covers the market size and forecasts for the global vanadium market across 26 countries in key regions. For each segment, the market sizing and forecasts have been provided on the basis of value (USD).
| Ferrovanadium |
| Vanadium Pentoxide (V₂O₅) |
| Vanadium Chemicals |
| Vanadium Metal |
| Iron and Steel |
| Energy Storage |
| Alloys |
| Chemicals and Catalysts |
| Other Applications |
| North America | United States |
| Canada | |
| Mexico | |
| Europe | Germany |
| France | |
| Italy | |
| Spain | |
| United Kingdom | |
| Poland | |
| Russia | |
| Rest of Europe | |
| Asia-Pacific | China |
| India | |
| Japan | |
| South Korea | |
| Australia | |
| Indonesia | |
| Vietnam | |
| Thailand | |
| Rest of Asia-Pacific | |
| South America | Brazil |
| Argentina | |
| Chile | |
| Rest of South America | |
| Middle East and Africa | Saudi Arabia |
| United Arab Emirates | |
| Egypt | |
| South Africa | |
| Morocco | |
| Rest of Middle East and Africa |
| By Type | Ferrovanadium | |
| Vanadium Pentoxide (V₂O₅) | ||
| Vanadium Chemicals | ||
| Vanadium Metal | ||
| By Application | Iron and Steel | |
| Energy Storage | ||
| Alloys | ||
| Chemicals and Catalysts | ||
| Other Applications | ||
| By Geography | North America | United States |
| Canada | ||
| Mexico | ||
| Europe | Germany | |
| France | ||
| Italy | ||
| Spain | ||
| United Kingdom | ||
| Poland | ||
| Russia | ||
| Rest of Europe | ||
| Asia-Pacific | China | |
| India | ||
| Japan | ||
| South Korea | ||
| Australia | ||
| Indonesia | ||
| Vietnam | ||
| Thailand | ||
| Rest of Asia-Pacific | ||
| South America | Brazil | |
| Argentina | ||
| Chile | ||
| Rest of South America | ||
| Middle East and Africa | Saudi Arabia | |
| United Arab Emirates | ||
| Egypt | ||
| South Africa | ||
| Morocco | ||
| Rest of Middle East and Africa | ||


Key Questions Answered in the Report
What is the projected value of the vanadium market by 2031?
The vanadium market is forecast to reach USD 4.12 billion by 2031, growing at a 4.26% CAGR from 2026.
What is driving demand for vanadium?
High-strength steel remains the largest demand source, while long-duration flow batteries are expanding use in energy storage.
Which vanadium product has the largest share?
Ferrovanadium held 70.1% of global revenue in 2025 because of its use in high-strength low-alloy steel.
Which application is growing fastest?
Energy storage is forecast to grow at a 7.5% CAGR through 2031, supported by large vanadium redox flow battery projects.
Which region leads vanadium demand?
Asia-Pacific held 61.6% of global revenue in 2025, supported by China’s steel and battery activity.
Why is supply security important for vanadium buyers?
China and Russia supplied more than 85% of mine output in 2025, making recycling, secondary supply, and qualified material important for supply planning.
Page last updated on:


 Your data is secure and never sold or shared.


