Market Overview
| Study Period | 2020 - 2031 |
|---|---|
| Forecast Data Period | 2026 - 2031 |
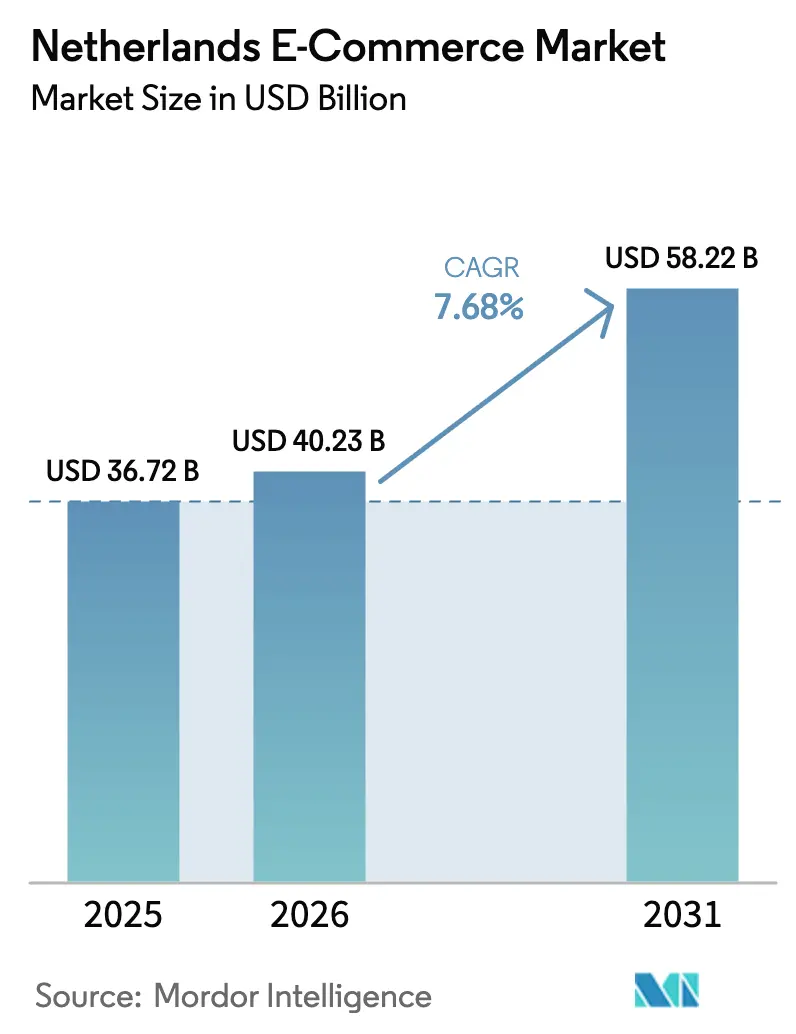
| Base Year Market Size (2025) | USD 36.72 Billion |
| Market Size (2026) | USD 40.23 Billion |
| Market Size (2031) | USD 58.22 Billion |
| Growth Rate (2026 - 2031) | 7.68% CAGR |
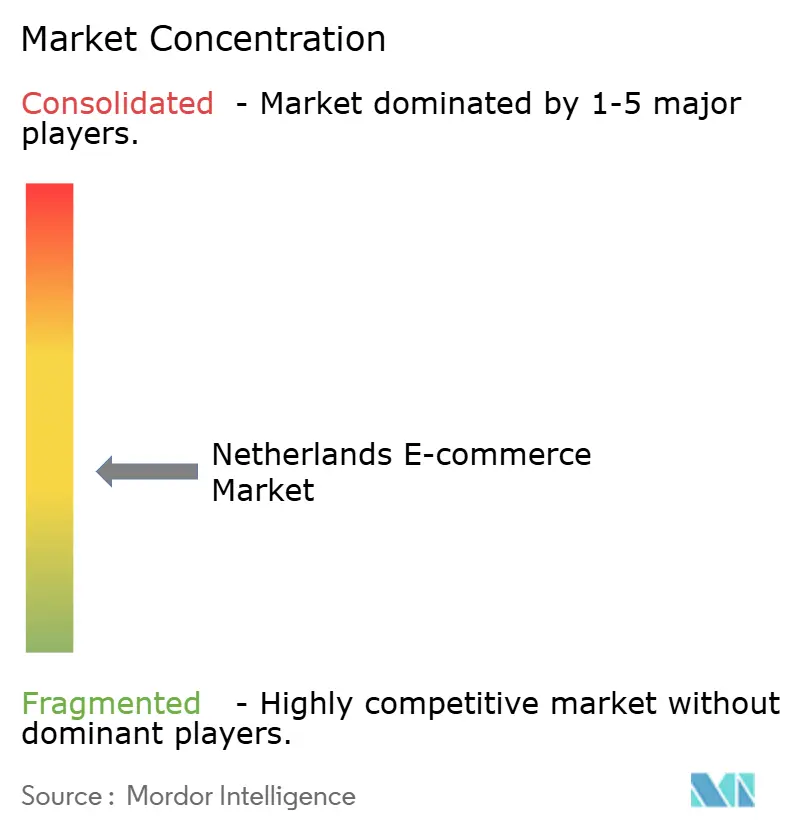
| Market Concentration | Medium |
Major Players *Disclaimer: Major Players sorted in no particular order Image © Mordor Intelligence. Reuse requires attribution under CC BY 4.0. | |
Netherlands E-Commerce Market Analysis by Mordor Intelligence
The Netherlands e-commerce market size stood at USD 40.23 billion in 2026 and is projected to reach USD 58.22 billion by 2031, reflecting a 7.68% CAGR over the forecast window. A nationwide 1 Gbps broadband push, a 95% SME digitalization target, and 98% 5G coverage underpin high transaction velocity even as user penetration nears its natural ceiling. Instant bank-to-bank rails minimize fraud and fees, while a single quarterly VAT filing streamlines cross-border sales into Belgium and Germany. Same-day grocery delivery experiments, AI-driven personalization engines, and circular-economy resale platforms now supply the incremental order frequency needed to sustain topline growth. Intensifying price competition from low-cost Chinese marketplaces adds margin pressure, but incumbents respond with fulfillment automation, electric last-mile fleets, and subscription programs to defend share in the mature Netherlands e-commerce market.
Key Report Takeaways
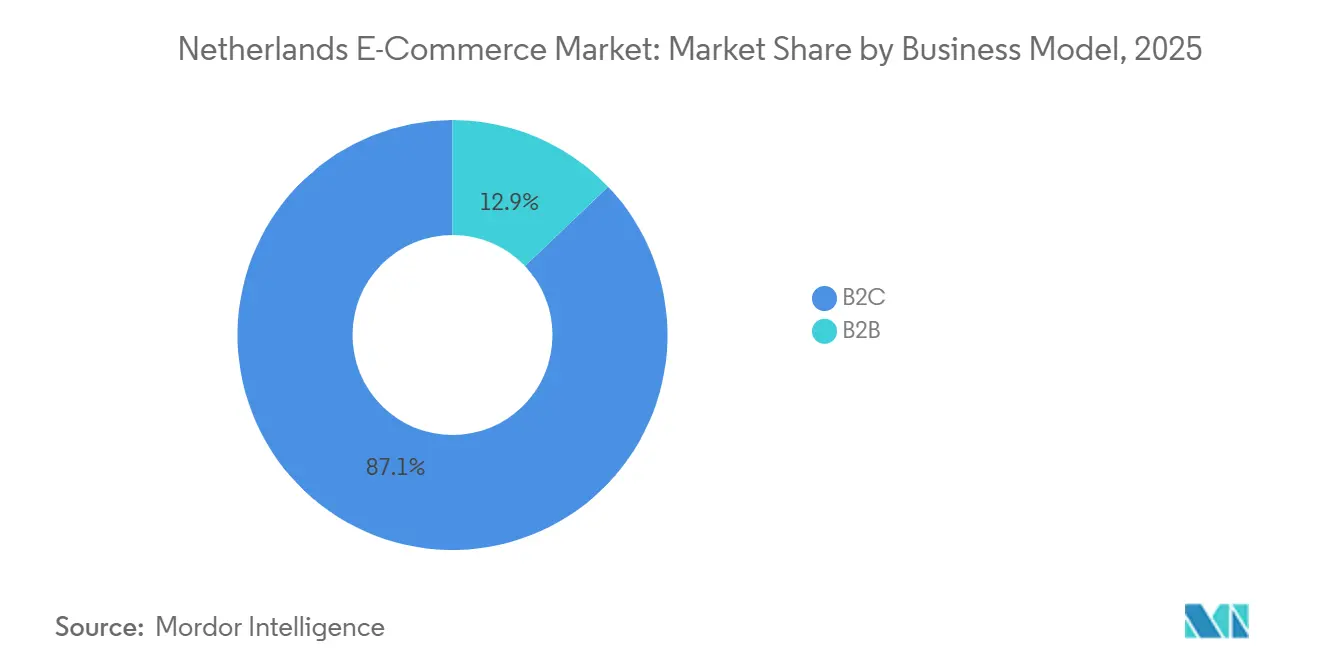
- By business model, the B2C segment held 87.12% of Netherlands e-commerce market share in 2025, while B2B is projected to register the fastest 9.67% CAGR through 2031.
- By device type, smartphones captured 64.18% of traffic in 2025 and are expanding at an 8.72% CAGR to 2031.
- By payment method, digital wallets commanded 50.87% share in 2025, whereas Buy Now Pay Later leads growth at a 10.17% CAGR through 2031.
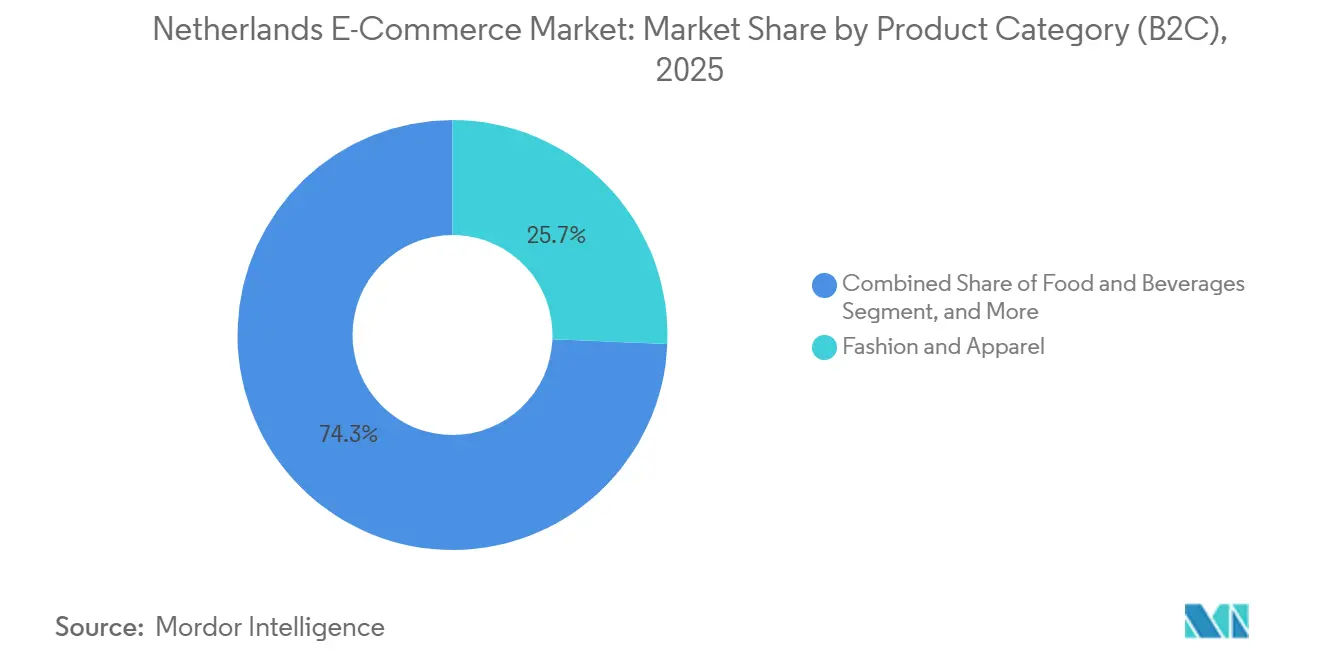
- By product category, fashion and apparel led with a 25.67% contribution in 2025; food and beverages are forecast to advance at a 9.91% CAGR to 2031.
Note: Market size and forecast figures in this report are generated using Mordor Intelligence’s proprietary estimation framework, updated with the latest available data and insights as of January 2026.
Netherlands E-Commerce Market Trends and Insights
Drivers Impact Analysis*
| Driver | (~) % Impact on CAGR Forecast | Geographic Relevance | Impact Timeline |
|---|---|---|---|
| Government Digital-Infrastructure Leadership | +1.8% | National, early gains in Randstad urban corridor | Medium term (2-4 years) |
| Account-to-Account Payments Boost Checkout Conversion | +1.5% | National, spillover to Belgium via cross-border iDEAL | Short term (≤ 2 years) |
| EU One-Stop-Shop VAT Fuels Cross-Border GMV | +1.2% | National, strongest on Netherlands-Germany-Belgium flows | Medium term (2-4 years) |
| Adoption Toward Same-Day Grocery Delivery Investments | +1.4% | National, concentrated in Amsterdam, Rotterdam, Utrecht, The Hague | Short term (≤ 2 years) |
| AI-Enabled Personalization Raises Average Order Value | +1.0% | National, early adoption by bol.com, Coolblue, Zalando | Medium term (2-4 years) |
| Data-Driven Circular-Economy Incentives Expand Recommerce | +0.9% | National, higher traction among urban millennials and Gen Z | Long term (≥ 4 years) |
| Source: Mordor Intelligence | |||
Government Digital-Infrastructure Leadership Drives the Market
The 2024-2028 Digitalization Strategy mandates universal 1 Gbps fixed broadband by 2030 and 95% SME digital enablement. Retailers receiving EUR 200 million (USD 234.34 million) in grants during 2025 upgraded point-of-sale and omnichannel inventory systems, compressing stock-out risk and enabling real-time click-and-collect.[1]Government of the Netherlands, “Digitalisation Strategy 2024-2028,” government.nl Integration of DigiD identity within checkout flows removes manual age checks for regulated items, shaving 8-12 seconds from transaction times. SEO Amsterdam Economics estimates retail digitalization spend needs of EUR 792 million (USD 927.99 million) annually through 2030, confirming ample runway for vendor platforms. Near-ubiquitous 5G allows livestream shopping and location-triggered flash sales that increase impulse conversion, especially in the densely populated Randstad corridor.
Account-to-Account Payments Boost Checkout Conversion
iDEAL processed roughly 1.3 billion online payments in 2025, equating to a 70-73% share of domestic digital transactions.[2]European Payments Council, “iDEAL Scheme Factsheet,” europeanpaymentscouncil.eu Its flat EUR 0.29 (USD 0.34) fee undercuts 1.5-2.5% card network charges and pushes merchants to default to iDEAL at checkout. The 2024 launch of iDEAL Checkout, which pre-fills payment and address fields, cut mobile cart abandonment by up to 15 percentage points. Fraud remains below 0.01% thanks to two-factor bank authentication, fostering trust for high-ticket electronics where Coolblue reports 82% of purchases above EUR 500 (USD 585.86) flowing through iDEAL.[3]De Nederlandsche Bank, “Retail Payment Fraud Data,” dnb.nl The European Payments Initiative plans to fold iDEAL into the Wero wallet by 2028, exporting this low-cost model to 16 eurozone states.
EU One-Stop-Shop VAT Fuels Cross-Border GMV
Implemented in July 2021, the One-Stop-Shop regime allows Dutch sellers to file a single quarterly VAT return instead of registering in each EU destination, slicing administrative overhead by roughly 40%.[4]European Commission, “VAT E-commerce OSS,” taxation-customs.ec.europa.eu The Netherlands benefits disproportionately because Rotterdam’s port accelerates fulfillment into Belgium and Germany, markets that collectively imported EUR 18 billion (USD 21.09 billion) in e-commerce goods from Dutch sellers in 2025. OSS registrations rose 28% between 2023 and 2025. Transparency rules under DAC-7 now oblige platforms to submit quarterly seller data, cutting fraud but adding compliance workload.
Adoption Towards Same-Day Grocery Delivery Investments
Picnic’s robotics-driven fulfillment center in Oberhausen handles 33,000 orders daily and, after a EUR 430 million (USD 503.84 million) November 2025 raise, supports service expansion to 200 towns. Albert Heijn logged EUR 2 billion (USD 2.34 billion) in online revenue in 2025, buoyed by mechanized dark stores and 5 million monthly app users. A March 2025 deal lets Picnic couriers collect PostNL returns during grocery drop-offs, blending food and general merchandise networks. Same-day delivery penetration already exceeds 18% of grocery sales in urban areas and is forecast to double by 2030 as route density improves.
Restraints Impact Analysis*
| Restraint | (~) % Impact on CAGR Forecast | Geographic Relevance | Impact Timeline |
|---|---|---|---|
| Price Wars From Low-Cost Marketplaces Hinder Margins | -1.3% | National, strongest in fashion, electronics, home goods | Short term (≤ 2 years) |
| Saturated Online-Shopper Base Limits Incremental Users | -1.1% | National, saturation exceeds 90% across demographics | Medium term (2-4 years) |
| Urban Logistics Cost Inflation and Green-Zone Rules | -0.8% | Amsterdam, Rotterdam, Utrecht, The Hague | Medium term (2-4 years) |
| Parcel-Courier Labor Shortages Constrain Capacity | -0.6% | National, acute during Q4 peak season | Short term (≤ 2 years) |
| Source: Mordor Intelligence | |||
Price Wars From Low-Cost Marketplaces Hinder Margins
Temu’s 2023 launch introduced prices 40-90% below incumbents, prompting urgent promotions that cut gross margins in fashion and home goods by roughly 200-300 basis points. AliExpress amplified direct-from-China fulfillment in 2024 with free shipping on EUR 10 (USD 11.72) baskets, while Shein floods the market with thousands of weekly fast-fashion SKUs. The Dutch Authority for Consumers and Markets logged 24,709 retail complaints in 2024, many tied to quality gaps and returns involving low-cost platforms. Bol.com hosts 46,500 marketplace sellers, including many Chinese merchants, intensifying internal cannibalization between third-party listings and first-party inventory.
Saturated Online-Shopper Base Limits Incremental Users
Online shopping penetration reached 91-93% of the Dutch population in 2025, leaving minimal headroom for new adopters. Future topline expansion hinges on higher purchase frequency and basket value rather than user growth, explaining the moderation of Netherlands e-commerce market CAGR to single digits. An aging demographic profile further tempers demand: by 2040, 26% of residents will be over 65, a cohort that orders online less often than younger groups. Platforms are pivoting to loyalty schemes such as bol.com Select, which offers free next-day delivery for EUR 9.99 (USD 11.71) per month, to coax extra orders from an already saturated audience.
*Our forecasts treat driver/restraint impacts as directional, not additive. The impact forecasts reflect baseline growth, mix effects, and variable interactions.
Segment Analysis
By Business Model: B2B Procurement Digitalization Accelerates
The B2B segment is on track to expand at a 9.67% CAGR to 2031, compared with slower B2C growth despite B2C commanding 87.12% of Netherlands e-commerce market size in 2025. Mandatory electronic invoicing for public contracts above EUR 10,000 (approx. USD 11,700), active since 2024, forces suppliers onto digital platforms. Average B2B order values exceed EUR 1,000 (approx. USD 1,170) and enjoy 70% repeat purchase rates, supporting investment in punch-out catalogs integrated with SAP Ariba and Coupa that slash processing costs by up to 40%.
B2C remains the revenue engine of the Netherlands e-commerce market; it held 87.12% share in 2025. However, active customer counts at bol.com plateaued at 13.7 million, indicating saturation. Cross-border B2C shipments to Belgium and Germany now supply incremental growth but face rising competition from local sites and Amazon’s expanded fulfillment footprint.


By Device Type (B2C): Mobile Commerce Dominates the Shopping Journey
Smartphones generated 64.18% of B2C sessions in 2025 and will climb at an 8.72% CAGR, reflecting progressive web apps, one-tap wallets, and 5G video bandwidth. Consumers aged 18-34 conduct 78% of their online purchases on mobile, far above the 52% rate among those over 55. Coolblue’s 2025 app refresh, adding augmented-reality appliance previews, trimmed return rates by 9% and anchors the brand’s identity as a service-oriented electronics specialist.
Desktop still matters for high-consideration goods, and tablets keep a niche for shared family shopping. Voice-activated reordering via Alexa and Google Assistant is emerging but remains below 2% of order volume. Persistent mobile cart-abandonment gaps of 15-20 points versus desktop underscore why iDEAL Checkout and Apple Pay adoption are strategic to the Netherlands e-commerce market.
By Payment Method (B2C): BNPL Faces Tightening Oversight
Digital wallets, anchored by iDEAL, accounted for 50.87% of spend in 2025. Buy Now Pay Later, however, is the fastest-rising tender at a 10.17% CAGR, reaching EUR 11.26 billion (USD 13.19 billion) in 2025 transactions. Klarna, Riverty, and in3 dominate and market interest-free installments that resonate with fashion-centric Gen Z shoppers. The Financial Markets Authority proposed affordability checks in 2025 to curb youth indebtedness.[5]AFM, “Consultation on BNPL Affordability,” afm.nl
Cards trail wallets because bank-to-bank options are entrenched, yet Visa and Mastercard gain cross-border momentum among German customers on Dutch sites. The Netherlands e-commerce market size attributable to cash-on-delivery is negligible, reflecting high bank account penetration and consumer trust in digital channels.
By Product Category (B2C): Grocery Delivery Outpaces Fashion Growth
Fashion and apparel retained a 25.67% revenue lead in 2025, helped by Zalando’s acquisition of About You that pooled 61.4 million active buyers. Grocery is the breakout, forecast to post a 9.91% CAGR as Picnic’s dense electric-van routes and Albert Heijn’s mechanized dark stores make fresh food delivery an everyday habit. Same-day grocery already claims 18% share of urban grocery sales and will double by 2030, expanding Netherlands e-commerce market size within food retail.
Consumer electronics hold high average tickets but face price erosion from AliExpress and Amazon. Beauty and personal care leverage subscription boxes, while furniture sales lean on augmented reality to reduce returns. Toys, DIY, and media peak in Q4, capturing 40% of annual volume during holiday months, a pattern platforms address with buffer inventory and seasonal labor planning.

Geography Analysis
The compact 41,543 km² footprint and robust transport links allow nationwide next-day delivery, yet the Randstad (Amsterdam, Rotterdam, Utrecht, and The Hague) generates roughly 60% of the Netherlands' e-commerce market transactions from only 45% of residents. Higher incomes, dense housing, and multiple same-day hubs drive order frequency that rural provinces cannot match. Bol.com enjoys 78% household penetration, an unrivaled figure in larger European nations.
Cross-border trade adds strategic breadth. Rotterdam is Europe’s largest container port, letting Dutch sellers import Asian inventory at lower freight costs before forwarding products into Belgium and Germany. The One-Stop-Shop VAT scheme removes multistate registration burdens, so SMEs can readily list in French and German marketplaces without legal friction. As a result, the Netherlands' e-commerce market size tied to exports reached EUR 18 billion (USD 21.09 billion) in 2025, and growth remains aligned with logistics innovations such as Dutch-German mega-hubs.
Urban sustainability mandates impose new cost curves. Amsterdam’s zero-emission freight zone, effective January 2025, obliges electric vans downtown and lifted last-mile capex by 15-20% for couriers that lacked early fleets. PostNL’s 8,500 electric vans cover 70% of urban routes, giving the incumbent a cost and compliance edge. Rural areas face the opposite issue: sparse density forces bi-weekly delivery schedules, eroding the immediate-delivery promise and requiring state subsidies for logistics hubs under the national Digitalization Strategy.
Competitive Landscape
Market concentration is moderate. Bol.com controls an estimated 35-40% of gross merchandise value, Amazon 8-10%, and Coolblue 5-7%, while specialist and foreign marketplaces form a long competitive tail. Platforms compete on speed, assortment depth, and payment convenience rather than pure price, though Temu and AliExpress rewired consumer expectations with ultra-low price anchors beginning in 2023. Bol.com leans on a hybrid model in which 46,500 partner sellers feed a unified catalog, lowering stock risk while sustaining fast shipping across the Netherlands e-commerce market.
Amazon committed EUR 1.4 billion (USD 1.64 billion) between 2025 and 2027 for expanded AWS regions and AI seller tools that fine-tune inventory and pricing. Coolblue deepens its electronics focus with in-home installation and repair, building services moats instead of chasing low prices. Zalando’s personalization engine already drives 30% of GMV and, after merging with About You, expects EUR 100 million (USD 117.17 million) in EBIT synergies by 2028.
Disruption narratives revolve around grocery, payments, and sustainability. Picnic’s November 2025 fundraising brought cumulative capital to more than EUR 1 billion (USD 1.17 billion), underpinning robotics and electric vans that traditional grocers struggle to replicate at similar margin. The forthcoming Wero wallet could extend Dutch-style instant payments across 16 eurozone markets, benefiting platforms ready for pan-EU scale. Regulators tighten oversight: the ACM fined five e-retailers EUR 621,000 (approx. USD 727,600) in 2024 for misleading pricing and maintains an active self-preferencing probe that signals heightened enforcement under the Digital Services Act.[6]Autoriteit Consument en Markt, “Consumer Complaints 2024,” acm.nl
Netherlands E-Commerce Industry Leaders
Bol.com
Fnac.com
Coolblue N.V.
Albert Heijn B.V.
Zalando SE
- *Disclaimer: Major Players sorted in no particular order

Recent Industry Developments
- January 2026: Picnic completed a national roll-out of parcel-return collection during grocery runs, integrating more than 500 PostNL drop-off points into its route engine.
- November 2025: Picnic secured EUR 430 million (USD 502 million) in Series D funding to accelerate robotics-based fulfillment and cover 200 Dutch towns.
- July 2025: Zalando finalized the About You acquisition, uniting 61.4 million customers across 29 markets and targeting EUR 100 million (USD 117.17 million) EBIT synergies by 2028.
- July 2025: Amsterdam began levying congestion fees on non-electric delivery vans, expanding the January 2025 zero-emission zone perimeter.


Netherlands E-Commerce Market Report Scope
E-commerce or electronic commerce is the purchasing and selling of goods or services on the Internet. It encompasses various data, systems, and tools for online buyers and sellers, including mobile shopping and online payment encryption. Most businesses with an E-commerce presence use an E-commerce store or platform to conduct online marketing and sales activities.
The Netherlands e-commerce market is segmented into B2C e-commerce (beauty and personal care, consumer electronics, fashion and apparel, food and beverage, furniture and home) and B2B e-commerce. The report offers market forecasts and size in value (USD) for all the above segments.
The Netherlands E-commerce Market Report is Segmented by Business Model (B2C, B2B), Device Type (Smartphone/Mobile, Desktop and Laptop, Other Device Types), Payment Method (Credit and Debit Cards, Digital Wallets, Buy Now Pay Later, Other Payment Methods), Product Category (Beauty and Personal Care, Consumer Electronics, Fashion and Apparel, Food and Beverages, Furniture and Home, Toys, DIY and Media, Other Product Categories), and Geography (Netherlands). The Market Forecasts are Provided in Terms of Value (USD).
By Business Model
| B2C |
| B2B |
By Device Type (B2C)
| Smartphone / Mobile |
| Desktop and Laptop |
| Other Device Types |
By Payment Method (B2C)
| Credit and Debit Cards |
| Digital Wallets |
| Buy Now Pay Later (BNPL) |
| Other Payment Methods |
By Product Category (B2C)
| Beauty and Personal Care |
| Consumer Electronics |
| Fashion and Apparel |
| Food and Beverages |
| Furniture and Home |
| Toys, DIY and Media |
| Other Product Categories |
| By Business Model | B2C |
| B2B | |
| By Device Type (B2C) | Smartphone / Mobile |
| Desktop and Laptop | |
| Other Device Types | |
| By Payment Method (B2C) | Credit and Debit Cards |
| Digital Wallets | |
| Buy Now Pay Later (BNPL) | |
| Other Payment Methods | |
| By Product Category (B2C) | Beauty and Personal Care |
| Consumer Electronics | |
| Fashion and Apparel | |
| Food and Beverages | |
| Furniture and Home | |
| Toys, DIY and Media | |
| Other Product Categories |


Key Questions Answered in the Report
How large is the Netherlands e-commerce market in 2026?
The market generated USD 40.23 billion in 2026 and is forecast to rise to USD 58.22 billion by 2031.
What is driving growth given 93% shopper penetration?
Order frequency and basket size are increasing thanks to same-day grocery delivery, AI-powered personalization, and instant bank-to-bank payments.
Which segment is growing faster, B2C or B2B?
B2B transactions are projected to expand at 9.67% CAGR through 2031, outpacing consumer sales as procurement platforms replace manual processes.
Why is iDEAL so dominant in Dutch online payments?
It offers instant settlement, near-zero fraud, and lower fees than cards, giving it over 70% share of domestic online payments.
How are sustainability rules changing delivery economics?
Zero-emission zones in Amsterdam and other cities require electric vans, lifting last-mile capital costs by up to 20% for operators without existing green fleets.
Which product category will outpace overall market growth?
Food and beverages, propelled by robotics-enabled same-day grocery delivery, are forecast to grow at 9.91% CAGR to 2031.
Page last updated on:


