Market Overview
| Study Period | 2020 - 2030 |
|---|---|
| Forecast Data Period | 2025 - 2030 |
| Historical Data Period | 2020 - 2023 |
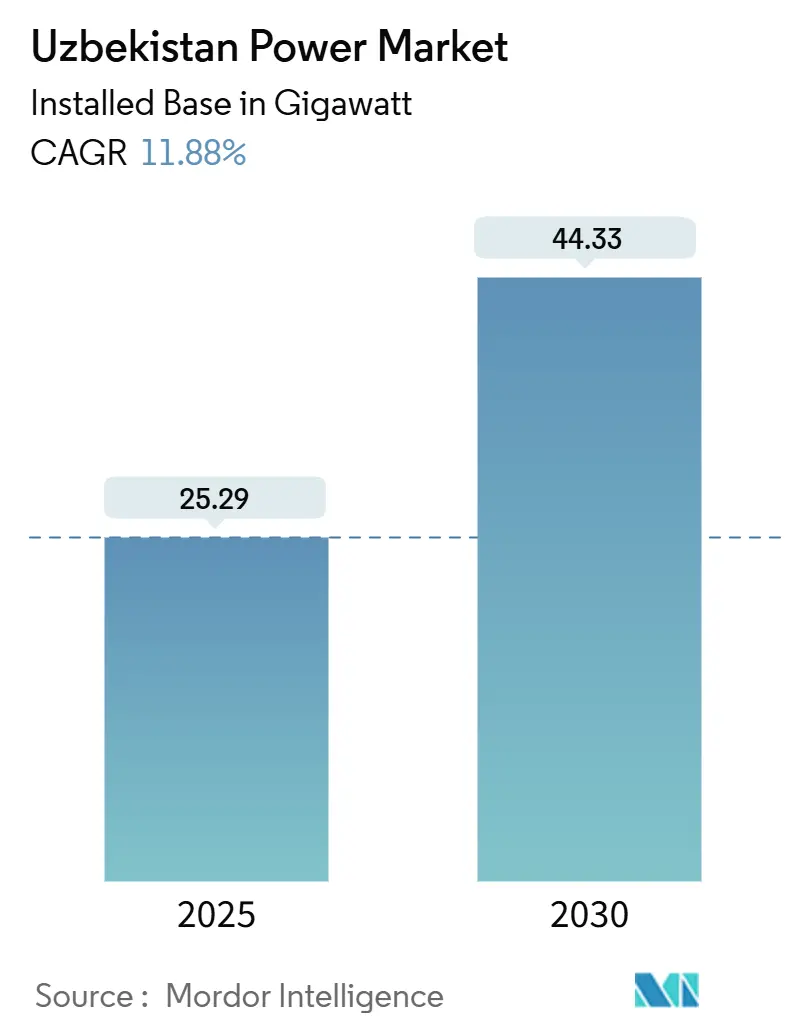
| Market Volume (2025) | 25.29 gigawatt |
| Market Volume (2030) | 44.33 gigawatt |
| Growth Rate (2025 - 2030) | 11.88% CAGR |
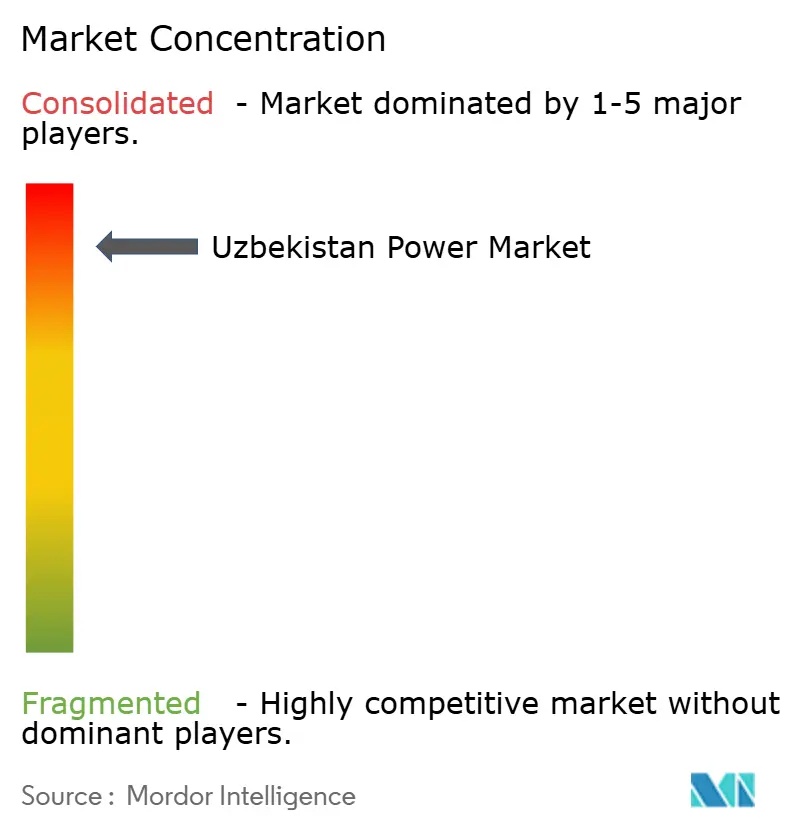
| Market Concentration | High |
Major Players *Disclaimer: Major Players sorted in no particular order Image © Mordor Intelligence. Reuse requires attribution under CC BY 4.0. | |
Uzbekistan Power Market Analysis by Mordor Intelligence
The Uzbekistan Power Market size in terms of installed base is expected to grow from 25.29 gigawatt in 2025 to 44.33 gigawatt by 2030, at a CAGR of 11.88% during the forecast period (2025-2030).
Rising industrial activity, swift population growth, and presidential mandates that target 40% renewable penetration are sustaining the up-cycle. Thermal assets still dominate dispatch, yet the auction pipeline has compressed solar and wind tariffs below USD 0.02 per kWh, pulling capital toward utility-scale renewables.[1]Masdar, “Masdar Signs Agreement to Develop 1.5 GW Solar Project in Uzbekistan,” masdar.ae Developers race to secure long-term power-purchase agreements before grid losses and fuel-price volatility erode returns. Rapid commercial and industrial electrification, especially in textile and mining clusters, is fragmenting load forecasts while intensifying pressure on transmission investment.[2]World Bank, “Uzbekistan Overview,” worldbank.org
Key Report Takeaways
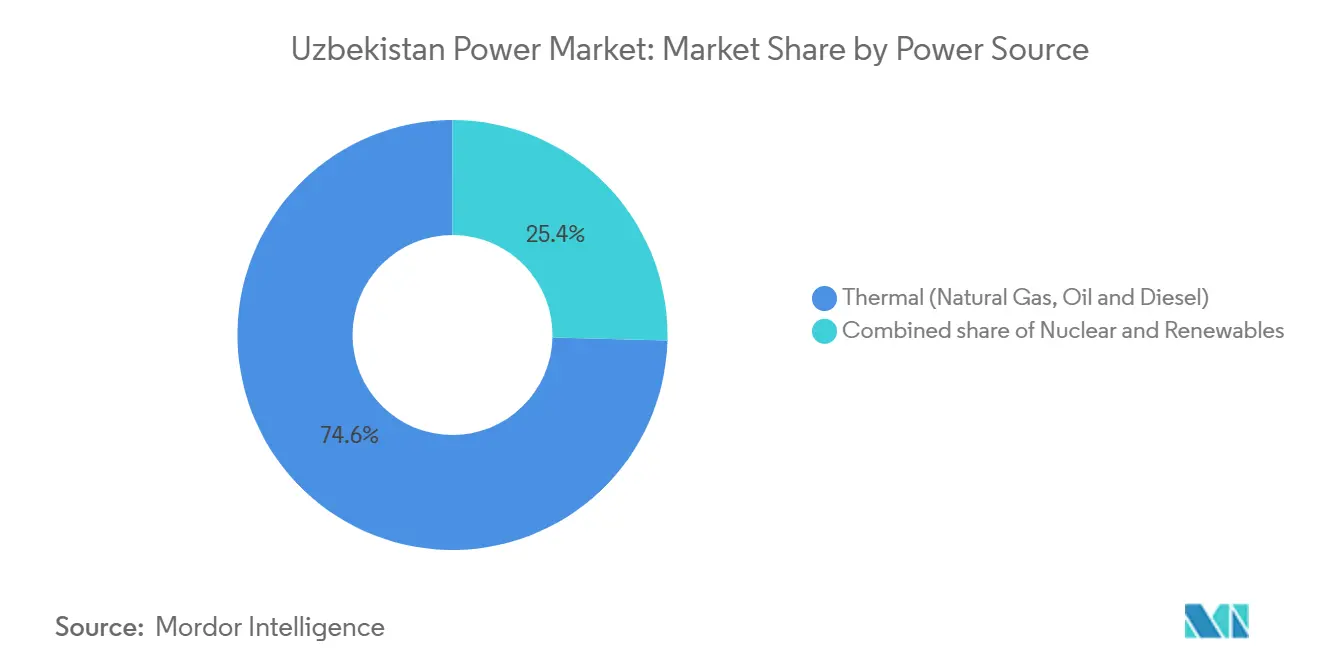
- By power source, thermal generation held 74.6% of Uzbekistan's power market share in 2024; renewables are forecast to grow at a 20.3% CAGR through 2030.
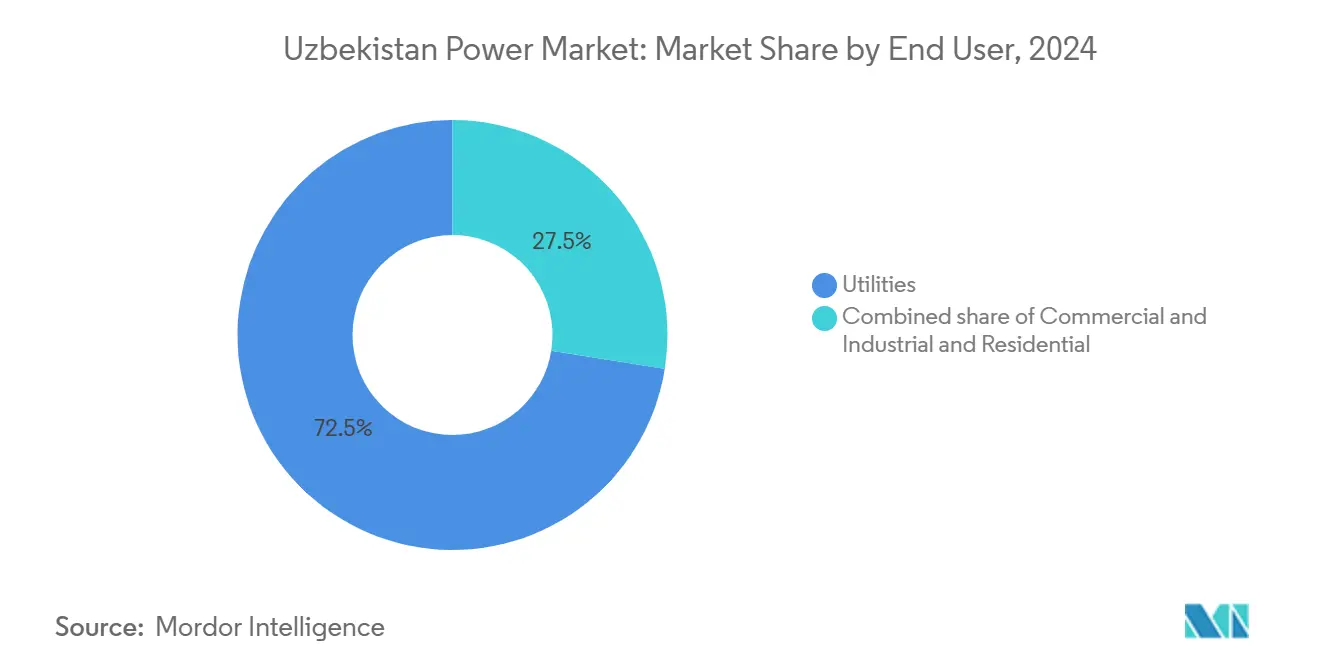
- By end user, utilities accounted for a 72.5% share of the Uzbekistan power market size in 2024, while the commercial and industrial segment is advancing at a 14.1% CAGR to 2030.
Uzbekistan Power Market Trends and Insights
Drivers Impact Analysis*
| Driver | (~) % Impact on CAGR Forecast | Geographic Relevance | Impact Timeline |
|---|---|---|---|
| Government renewable-energy targets & competitive auctions | +3.2% | National, with concentration in Bukhara, Samarkand, and Navoi regions | Medium term (2–4 years) |
| Growing electricity demand from population & industrial growth | +2.8% | National, with early gains in Tashkent, Fergana Valley, and Andijan | Long term (≥ 4 years) |
| International financing to modernize gas-fired fleet | +1.9% | National, focused on Syrdarya and Tashkent thermal complexes | Short term (≤ 2 years) |
| High solar-/wind-resource potential lowering LCOE | +2.1% | Bukhara, Navoi, Karakalpakstan for solar; Zarafshan highlands for wind | Medium term (2–4 years) |
| Regional power trading via Central Asia Power System upgrades | +0.9% | Cross-border with Tajikistan, Kyrgyzstan, Afghanistan via CASA-1000 | Long term (≥ 4 years) |
| Pilot blockchain micro-grids for remote villages | +0.3% | Rural Karakalpakstan, Surkhandarya, and Kashkadarya | Long term (≥ 4 years) |
| Source: Mordor Intelligence | |||
Government Renewable-Energy Targets & Competitive Auctions
Presidential Decree 60 of January 2024 created a feed-in premium and mandated 40% renewable capacity by decade-end, prompting USD 4.5 billion in signed agreements within 12 months.[3]Office of the President, “Presidential Decree 60 on Accelerating the Development of Renewable Energy,” president.uz The auction design, a reverse bid with 25-year sovereign-backed PPAs, drove Masdar’s 1.5 GW Samarkand solar tariff to USD 0.0165 per kWh, 40% beneath marginal gas-fired costs. ACWA Power’s parallel 1.5 GW wind tranche in Bukhara and Navoi deepened variable output, nudging the grid operator toward storage pilots still unfunded. Absence of a renewable-certificate market limits corporate off-takers, yet bids for the 2025 round from Total Eren and SkyPower suggest the pipeline remains oversubscribed.[4]Total Eren, “Total Eren Selected to Develop 500 MW Solar Project in Uzbekistan,” total-eren.com
Growing Electricity Demand from Population & Industrial Growth
Population climbed to 36.6 million in 2024, and GDP per capita rose 22% in real terms, pushing appliance ownership and air-conditioning penetration upward in urban zones. Industrial electricity use jumped 31% from 2020 to 2024, led by textile mills that quintupled consumption in the Fergana Valley. Mining in Navoi and Zarafshan now grabs 18% of the industrial load, operating around the clock and intensifying baseload requirements. The 2024-2026 Industrial Policy Framework anticipates 3.5 GW of captive capacity, though just 40% is financed. Subsidized tariffs averaging USD 0.03 per kWh dampen efficiency investments, a hurdle the Tashkent smart-meter pilot intends to overcome by 2026.
International Financing to Modernize Gas-Fired Fleet
The World Bank’s USD 500 million loan and Asian Development Bank’s USD 300 million concessional line are channeling capital toward grid and turbine overhauls that lift efficiency while trimming gas burn. Siemens Energy’s EUR 280 million SGT-800 package at Syrdarya aims to raise cycle efficiency to 58% and cut fuel use by 1.2 billion m³ per year. GE Vernova and Mitsubishi Heavy Industries pursue similar upgrades contingent on affordable gas imports from Turkmenistan. Domestic production slipped 6% in 2024, exposing plants to spot imports priced 30% above local wellhead levels.
High Solar-/Wind-Resource Potential Lowering LCOE
Bukhara and Navoi receive 2,800-3,100 kWh/m² annually, enabling bifacial modules to post 28% capacity factors without trackers. Panel prices fell 22% year-on-year to USD 0.11 per W in Q3 2024, trimming payback windows to 6-7 years. Wind speeds in Zarafshan average 7.5-8.2 m/s at 100 m hub height, supporting 35-38% capacity factors for modern turbines. Total Eren’s 500 MW hybrid plant couples 100 MWh of storage to smooth output and lower balancing fees by 18%.
Restraints Impact Analysis*
| Restraint | (~) % Impact on CAGR Forecast | Geographic Relevance | Impact Timeline |
|---|---|---|---|
| Aging grid infrastructure & technical losses | -2.4% | National, acute in Fergana Valley and Karakalpakstan | Short term (≤ 2 years) |
| Exposure to natural-gas price volatility | -1.7% | National, concentrated in thermal-dependent regions (Syrdarya, Tashkent) | Medium term (2–4 years) |
| Water-scarcity risk for thermal & hydro assets | -1.1% | Aral Sea basin, Amu Darya and Syr Darya river systems | Long term (≥ 4 years) |
| Regulatory uncertainty on open access & IPP tariffs | -0.9% | National, affecting commercial and industrial consumers | Medium term (2–4 years) |
| Source: Mordor Intelligence | |||
Aging Grid Infrastructure & Technical Losses
Transmission and distribution losses averaged 15–20% in 2024, double peer benchmarks, due to corroded aluminum conductors and obsolete 110 kV lines. Sixty-two percent of the 38,000 km national network predates 1995 and lacks digital fault detection. Voltage sags above 10% in Fergana Valley force factories to buy private capacitor banks, adding USD 50–80 per kW to capex. The 2024-2028 Grid Modernization Plan earmarks USD 1.2 billion to upgrade 240 substations, yet procurement delays have pushed deployment to late 2025.
Exposure to Natural-Gas Price Volatility
Domestic output fell to 48 billion m³ in 2024 while imports from Russia cost USD 250 per 1,000 m³, compressing margins on gas-fired plants and triggering a 12% industrial tariff hike. Negotiations with Turkmenistan for 5 billion m³ annually stalled over pricing, anchoring fuel risk to geopolitics. Retrofitting projects priced on USD 200 gas now face potential overruns that could delay commissioning and dampen the Uzbekistan power market’s near-term investment cycle.
*Our forecasts treat driver/restraint impacts as directional, not additive. The impact forecasts reflect baseline growth, mix effects, and variable interactions.
Segment Analysis
By Power Source: Renewables Surge Reshapes Dispatch Merit Order
Installed renewables expanded at a 20.3% CAGR between 2024 and 2030, the fastest pace across fuel groups, lifting their contribution to 40% of projected capacity and compressing gas dispatch during daylight hours. The Uzbekistan power market size for renewables is set to overtake coal and approach gas volumes by 2028. Thermal assets, still holding 74.6% of installed capacity in 2024, confront aging turbines and rising imported fuel costs that erode their Uzbekistan power market share during peak solar generation.[5]Asian Development Bank, “Uzbekistan: Power Sector Development Project,” adb.org Hydropower’s 2.1 GW footprint suffers seasonal curtailment, while Rosatom’s 2.4 GW nuclear plant plus a 330 MW SMR will bolster nighttime baseload after 2030.
A second-order shift lies in hybrid solar-wind-storage arrays such as Total Eren’s 500 MW Karakalpakstan complex, which achieves a 65% capacity factor and displaces diesel peakers in remote zones. Coal’s lone 600 MW Angren unit is slated for retirement by 2028 under the decarbonization roadmap, freeing transmission bandwidth for variable renewables. Consequently, the Uzbekistan power market is pivoting toward a flatter merit order that rewards flexibility services such as battery storage and demand response.


By End User: Commercial & Industrial Segment Outpaces Utilities
Utilities absorbed 72.5% of electricity in 2024, yet commercial and industrial buyers are growing 2.3 percentage points faster, embodying the Uzbekistan power market’s structural shift toward value-added exports. Textile mills in the Fergana Valley and Andijan alone quintupled their load between 2020 and 2024, while mining sites in Navoi and Zarafshan now represent 18% of industrial demand. The Uzbekistan power market size dedicated to C&I could jump once open-access rules allow direct purchases from renewable developers; lobbying efforts focus on achieving this by 2026.
Residential consumption averages 1,800 kWh per capita, 40% lower than in Kazakhstan, implying latent upside once income growth and tariff reform stimulate appliance penetration. The smart-meter pilot in Tashkent is expected to migrate 500,000 households to cost-reflective pricing by 2026, trimming peak load and freeing headroom for industrial expansion. Captive solar-plus-storage solutions pitched by SkyPower Global and Helios Energy are poised to accelerate once legal clarity on wheeling charges emerges.
Geography Analysis
Tashkent and the Fergana Valley collectively consume 52% of national electricity yet occupy just 38% of the land area, underscoring the spatial mismatch between supply and load centers. Tashkent’s data centers and offices generate 28% of total demand and strain 220 kV feeders past design capacity during summer heat. Fergana Valley’s textile clusters, spread across Fergana, Andijan, and Namangan, face chronic voltage drops due to antiquated substations.
Samarkand and Bukhara, once agricultural strongholds, are morphing into renewable hubs thanks to Masdar’s 1.5 GW solar buildout and ACWA Power’s 1.5 GW wind tranche that will export 4.2 TWh annually by 2027. Karakalpakstan’s sparse load obliges 500 kV line upgrades so that Total Eren’s hybrid complex can flow power to Tashkent. Water scarcity in the Aral Sea basin has already forced a 12% hydro curtailment during summer 2024, illustrating the climate-sensitivity of dispatch.
Regional trading corridors amplify system resilience. CASA-1000 will enable 1,000 MW of bidirectional trade by 2027, and talks with Kazakhstan aim to unlock Russia’s Unified Energy System for winter imports and summer exports, potentially trimming 8-10% off reserve-margin needs. Uzbekistan exported 1.2 TWh to Afghanistan in 2024, earning USD 72 million, though ongoing payments risk constrains expansion.
Competitive Landscape
State incumbents JSC Thermal Power Plants, Uzbekhydroenergo, and National Electric Grid of Uzbekistan still dominate baseload and wires, but their aggregate share is slipping as international independent power producers deploy 4.5 GW of auction-awarded renewables between 2024 and 2027. Masdar, ACWA Power, and Total Eren collectively anchor solar and wind buildouts that will displace roughly 3.2 billion m³ of gas use each year, eroding state thermal revenues. Rosatom’s USD 11 billion nuclear build positions the Russian firm as the long-term baseload provider, diversifying resource risk and compressing nighttime gas burn.
Equipment suppliers Siemens Energy, GE Vernova, and Mitsubishi Heavy Industries chase USD 800 million in combined-cycle retrofits, hinging on affordable fuel contracts with Turkmenistan or Russia. SkyPower Global and Helios Energy target 200–500 kW rooftop arrays for textile mills, offering 15-year energy-service agreements undercutting grid tariffs by 20%. Blockchain micro-grids funded by a USD 50 million World Bank grant could open a new rural franchise if regulatory sandboxes allow tokenized peer-to-peer trading.
Uzbekistan Power Industry Leaders
Mitsubishi Heavy Industries Ltd
Masdar Clean Energy Company
Helios Energy Ltd
SkyPower Ltd
Federal Hydro-Generating Co RusHydro PAO
- *Disclaimer: Major Players sorted in no particular order

Recent Industry Developments
- April 2025: The Asian Development Bank (ADB), the Asian Infrastructure Investment Bank (AIIB), and the energy ministries of Azerbaijan, Kazakhstan, and Uzbekistan signed a Memorandum of Understanding (MOU) to support the Feasibility Study for the Caspian Green Energy Corridor Project.
- March 2025: Voltalia has secured a 25-year power purchase agreement (PPA) for its 526 MW hybrid solar-wind project in Uzbekistan, which includes a 1 GWh battery energy storage system.
- December 2024: Masdar has brought the 500 MW Zarafshan wind farm online in Uzbekistan, which is capable of providing electricity for 500,000 homes. The project is expected to displace 1.1 million tonnes of carbon dioxide annually. It is the largest wind farm in Central Asia.
- October 2024: ACWA Power and Sumitomo Corporation are partnering to develop USD 4.2 billion worth of solar and wind projects in Uzbekistan's Samarkand and Karakalpakstan regions.


Uzbekistan Power Market Report Scope
The power industry, often referred to as the electricity sector, encompasses the entire value chain of electricity - from generation and transmission to distribution and sale. This sector integrates organizations, technologies, and infrastructure, ensuring that primary energy sources are efficiently and safely transformed into electrical energy for end users.
The Uzbekistani power market is segmented by power sources, end-users, and T&D voltage level (Qualitative analysis only). By power source, the market is segmented into thermal, nuclear, and renewable. By end-user, it is categorized into utilities, commercial and industrial, and residential. Furthermore, the report delves into transmission and distribution (T&D) voltage levels, offering qualitative insights on high-voltage transmission, sub-transmission, medium-voltage distribution, and low-voltage distribution.
By Power Source
| Thermal (Coal, Natural Gas, Oil and Diesel) |
| Nuclear |
| Renewables (Solar, Wind, Hydro, Geothermal, Biomass & Waste, Tidal) |
By End User
| Utilities |
| Commercial and Industrial |
| Residential |
By T&D Voltage Level (Qualitative Analysis only)
| High-Voltage Transmission (Above 230 kV) |
| Sub-Transmission (69 to 161 kV) |
| Medium-Voltage Distribution (13.2 to 34.5 kV) |
| Low-Voltage Distribution (Up to 1 kV) |
| By Power Source | Thermal (Coal, Natural Gas, Oil and Diesel) |
| Nuclear | |
| Renewables (Solar, Wind, Hydro, Geothermal, Biomass & Waste, Tidal) | |
| By End User | Utilities |
| Commercial and Industrial | |
| Residential | |
| By T&D Voltage Level (Qualitative Analysis only) | High-Voltage Transmission (Above 230 kV) |
| Sub-Transmission (69 to 161 kV) | |
| Medium-Voltage Distribution (13.2 to 34.5 kV) | |
| Low-Voltage Distribution (Up to 1 kV) |


Key Questions Answered in the Report
How large is the Uzbekistan power market in 2025?
The Uzbekistan power market size stands at 25.29 GW and is on track to reach 44.33 GW by 2030.
What is driving renewable investment in Uzbekistan?
A presidential decree mandating 40% renewable penetration by 2030 and auction tariffs below USD 0.02 per kWh are accelerating solar and wind buildouts.
Which segment is growing fastest?
Commercial and industrial demand is expanding at a 14.1% CAGR, outpacing utilities thanks to textile and mining electrification.
How will Rosatom’s nuclear plant affect the generation mix?
The 2.4 GW VVER-1200 plant plus a 330 MW SMR will add 11% of projected 2030 capacity and lower nighttime gas burn.
What challenges could slow growth?
High grid losses, gas-price volatility, water scarcity, and uncertain open-access rules threaten timely project execution.
How competitive are solar tariffs in Uzbekistan?
The Samarkand solar auction cleared at USD 0.0165 per kWh, undercutting the variable cost of gas-fired generation by 40%.
Page last updated on:


