Usage-Based Insurance Market Size and Share
Market Overview
| Study Period | 2020 - 2031 |
|---|---|
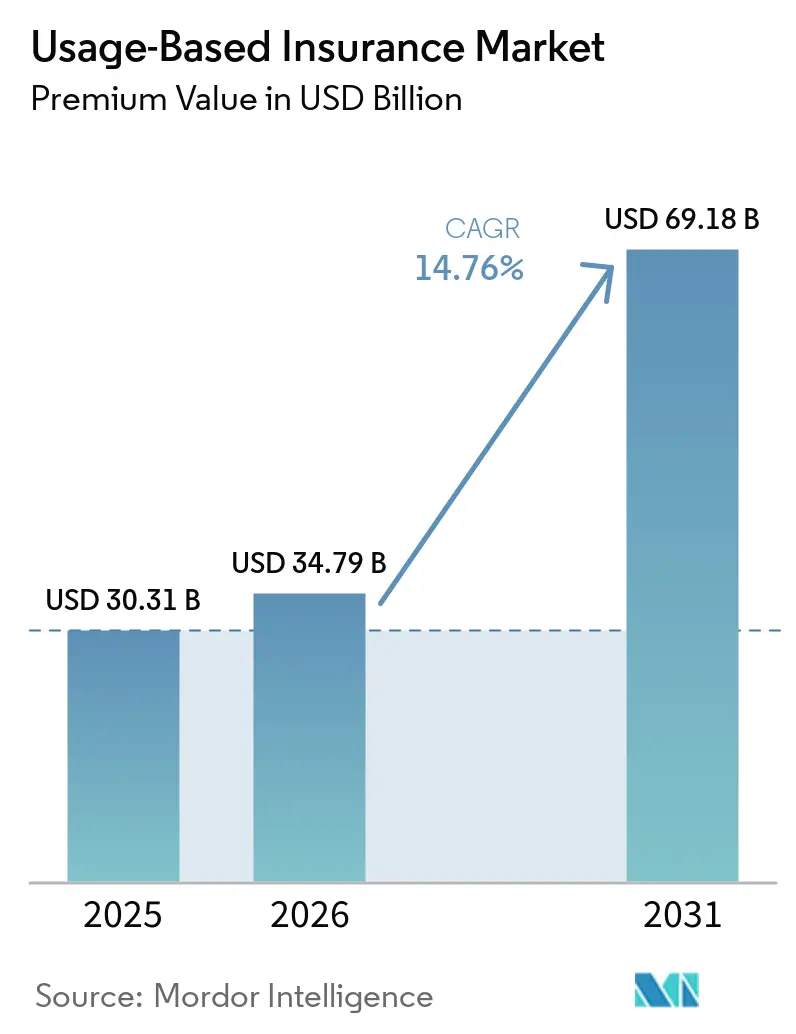
| Market Size (2026) | USD 34.79 Billion |
| Market Size (2031) | USD 69.18 Billion |
| Growth Rate (2026 - 2031) | 14.76% CAGR |
| Fastest Growing Market | Asia Pacific |
| Largest Market | Europe |
| Market Concentration | Medium |
Major Players *Disclaimer: Major Players sorted in no particular order Image © Mordor Intelligence. Reuse requires attribution under CC BY 4.0. | |
Usage-Based Insurance Market Analysis by Mordor Intelligence
The Usage-Based Insurance Market size in terms of premium value is expected to grow from USD 30.31 billion in 2025 to USD 34.79 billion in 2026 and is forecast to reach USD 69.18 billion by 2031 at 14.76% CAGR over 2026-2031.
Growth accelerates as regulators treat telematics as core infrastructure, compelling insurers to shift from static actuarial tables to real-time behavioral analytics. Commercial vehicle fleets, embedded-insurance APIs, and OEM-fitted connected-car platforms jointly expand data volumes, helping underwriters calibrate premiums with unprecedented precision. Reinsurers contribute fresh capital alongside variable-rate treaties that reward loss-ratio gains, further energizing the usage-based insurance market across mature and emerging economies. At the same time, privacy regulation and rising ADAS penetration introduce execution risks that vary by jurisdiction, nudging insurers to balance innovation with compliance.
Key Report Takeaways
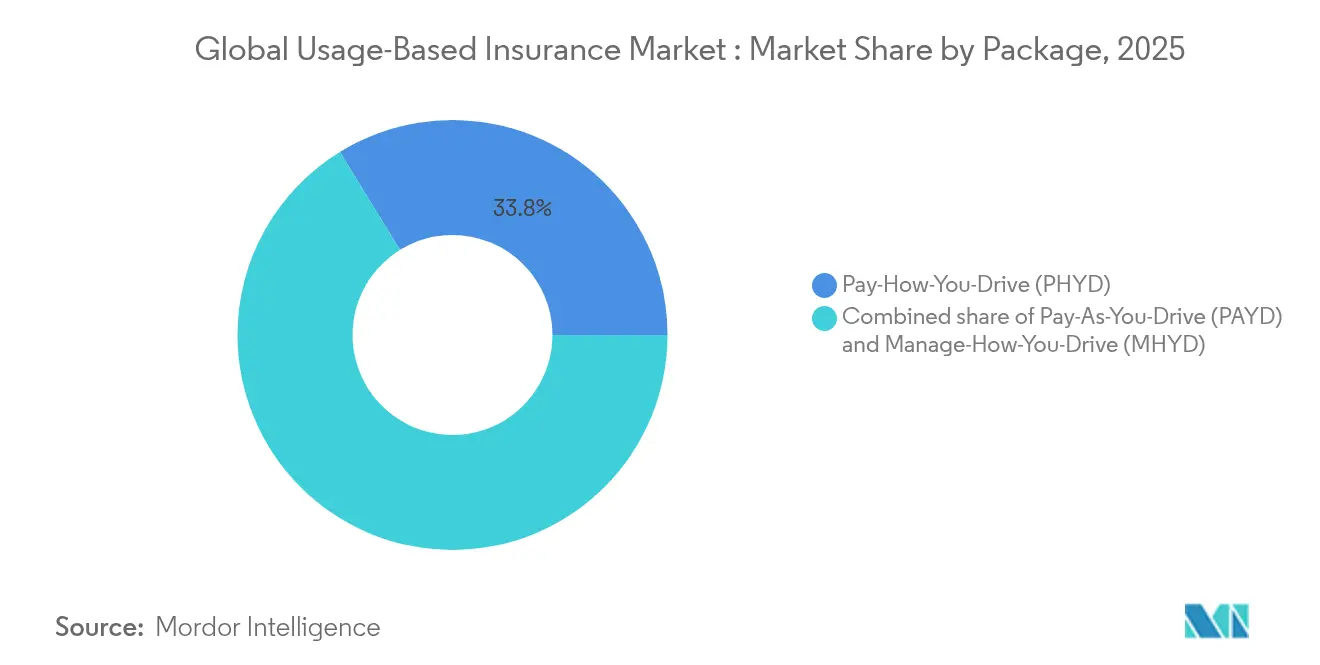
- By package type, Pay-How-You-Drive held 33.78% of the global usage-based insurance market share in 2025, while Manage-How-You-Drive is projected to advance at a 12.98% CAGR through 2031.
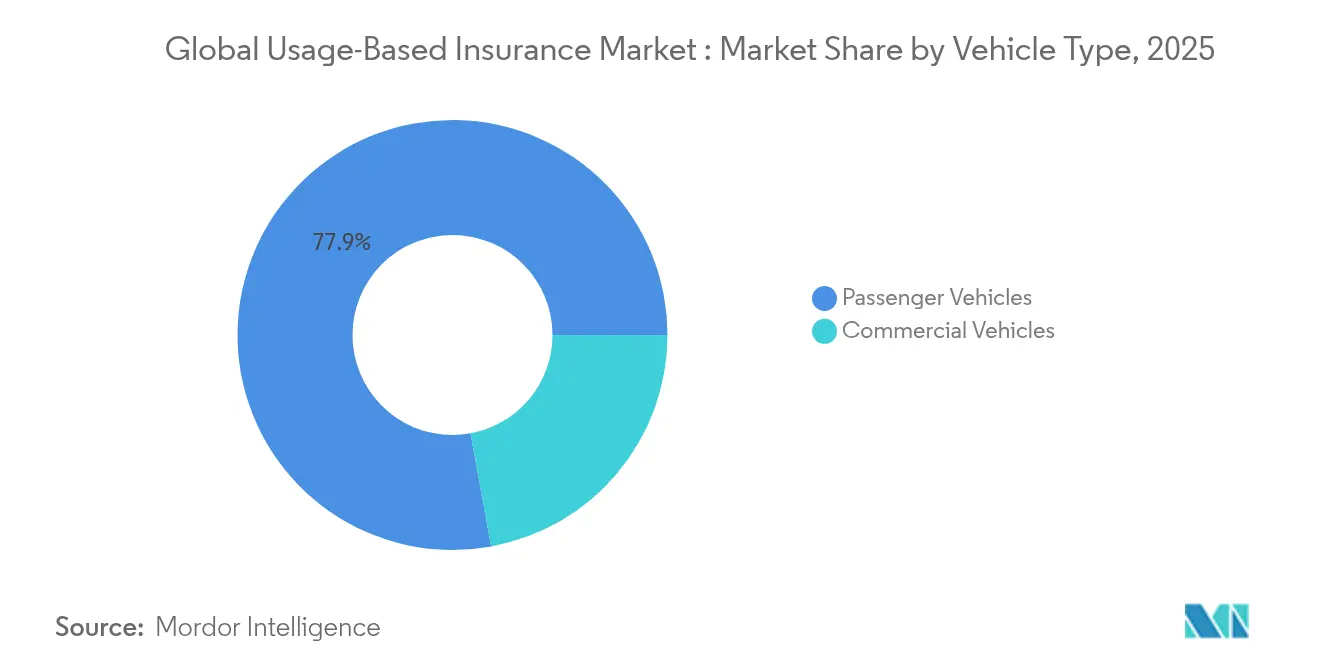
- By vehicle type, commercial vehicles commanded 22.12% of the global usage-based insurance market size in 2025 and are forecast to expand at 16.21% CAGR between 2026-2031.
- By technology, OBD-II devices led with 34.69% revenue share in 2025; smartphone-based systems post the fastest 14.05% CAGR to 2031.
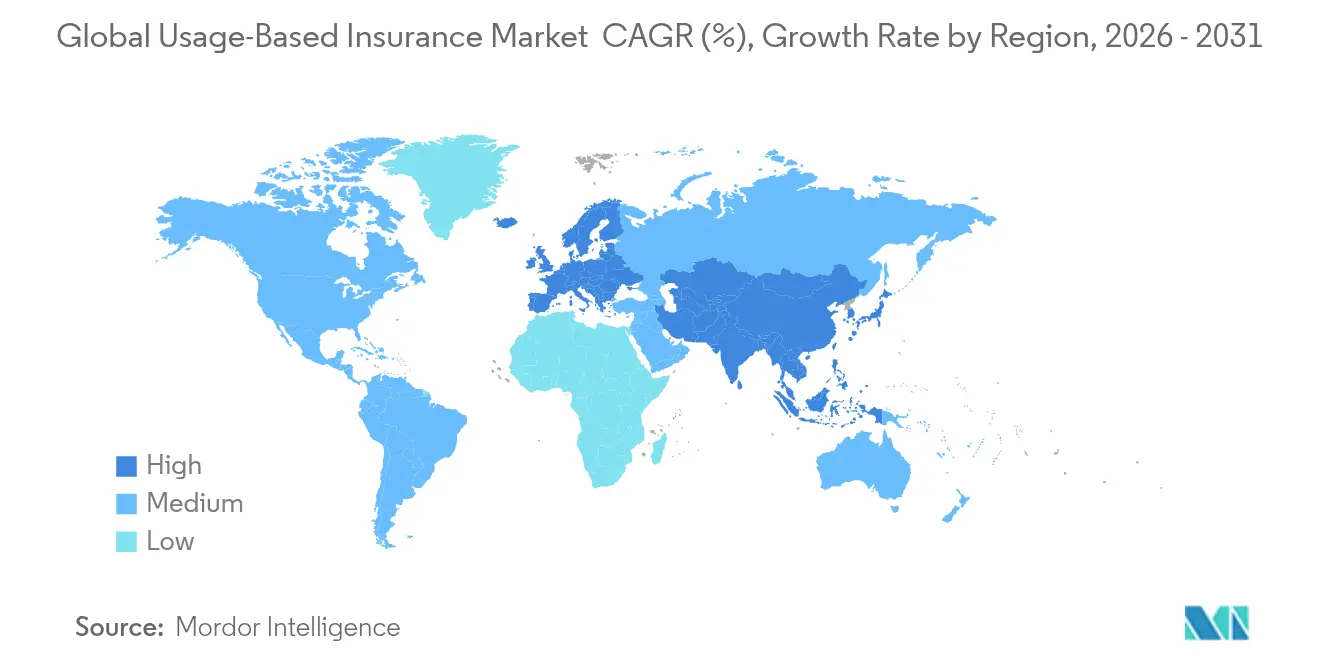
- By region, Europe retained a 26.45% revenue share in 2025, whereas Asia-Pacific is expected to grow at a 17.22% CAGR through 2031.
Note: Market size and forecast figures in this report are generated using Mordor Intelligence’s proprietary estimation framework, updated with the latest available data and insights as of 2026.
Global Usage-Based Insurance Market Trends and Insights
Drivers Impact Analysis*
| Driver | ( ~ )% Impact on CAGR Forecast | Geographic Relevance | Impact Timeline |
|---|---|---|---|
| Rising penetration of OEM-fitted connected-car platforms | +2.8% | Global, notably North America & Europe | Medium term (2-4 years) |
| Lower premiums attracting cost-conscious younger drivers | +2.1% | North America & Europe core, expanding to Asia-Pacific | Short term (≤2 years) |
| Fleet-management platforms bundling pay-per-mile cover | +1.9% | Global commercial vehicle markets | Medium term (2-4 years) |
| Embedded-insurance APIs inside ride-hailing apps | +1.4% | Urban centers worldwide | Short term (≤2 years) |
| Variable-rate reinsurance treaties rewarding loss ratios | +1.2% | Global reinsurance hubs | Long term (≥4 years) |
| Government mandates for in-vehicle event-data recorders | +1.8% | Europe immediate, North America pending | Medium term (2-4 years) |
| Source: Mordor Intelligence | |||
Rising Penetration of OEM-Fitted Connected-Car Platforms
Automakers now ship connected cars as standard equipment and share granular driving data with insurers under the EU Data Act. EU connected-vehicle volume is set to reach 177 million units by 2030, paving the way for always-on risk scoring that lowers acquisition costs and lifts policyholder engagement. Kia’s partnership with LexisNexis demonstrates mutual monetization: the OEM monetizes data, and the carrier gains verified insights, cutting loss ratios while raising retention. Such alliances tighten dependencies on automakers, and smaller insurers must weigh new data-access fees before scaling similar offerings. The global usage-based insurance market benefits as data quality removes friction and boosts underwriting confidence[1]Allianz, “EU Data Act and Mobility,” allianz.com.
Lower Premiums Attracting Cost-Conscious Younger Drivers
Inflation and wage stagnation push new policyholders toward discounts of 5–20% at enrollment and up to 50% upon favorable re-scoring. In 2024, 26% of first-time auto policies in the United States adopted telematics-linked coverage, and satisfaction scores climbed relative to legacy products. Smartphone telematics eliminates hardware costs, lowering entry barriers for price-sensitive drivers. Insurers translate behavioral data into gamified feedback loops that sustain retention and advocacy, reinforcing the usage-based insurance market among digital-native cohorts[2]American Family Insurance, “Usage-Based Insurance Discounts,” americanfamilyinsurance.com. As inflation continues to strain household budgets, usage-based insurance (UBI) offers a compelling value proposition through personalized pricing. Additionally, partnerships between insurers and ride-hailing or mobility platforms are expanding the reach of UBI to gig-economy drivers.
Fleet-Management Platforms Bundling Pay-Per-Mile Cover
Commercial telematics vendors integrate usage-based premiums directly into dashboards that already optimize routing, fuel, and compliance. Australian and New Zealand fleet-management units will climb from 1.6 million in 2024 to 2.7 million by 2028, boosting commercial uptake. Operators report 20% insurance savings and 19% accident-cost reductions after adding GPS-based scoring, validating fully-bundled propositions. These results establish commercial fleets as anchor tenants of the usage-based insurance market[3]Verizon Connect, “Fleet Telematics Impact Report,” verizonconnect.com. Insurers are increasingly forming direct partnerships with telematics providers to streamline data flows and accelerate underwriting decisions. As regulatory frameworks mature, bundled telematics-insurance products are expected to become standard in logistics and delivery segments across the region.
Embedded-Insurance APIs Inside Ride-Hailing Apps
Mobility platforms integrate premiums at checkout, protecting riders without manual enrollment. Cover Genius allocates 25% of revenue to mobility programs after a USD 80 million Series E, underscoring investor confidence. Chubb’s Ride Cover bundles cancellation and accident benefits, matching on-demand consumption patterns. Asia-Pacific riders quickly adopt such friction-free coverage, adding incremental growth to the usage-based insurance market[4]Chubb, “Ride Cover Insurance Product Sheet,” chubb.com. This embedded approach reduces underwriting friction while aligning closely with consumer behavior in the gig and urban mobility ecosystems. As ride-hailing and micromobility services scale, insurers see new opportunities to diversify distribution and deepen real-time risk engagement.
Restraints Impact Analysis*
| Restraint | ( ~ )% Impact on CAGR Forecast | Geographic Relevance | Impact Timeline |
|---|---|---|---|
| Heightened data-privacy regulation (GDPR, CPRA) | -1.8% | Europe immediate, California expanding | Short term (≤2 years) |
| Patchy actuarial record for smartphone-only scoring | -1.2% | Global | Medium term (2-4 years) |
| OEM data-access fees inflating cost base | -0.9% | Global, premium brands first | Medium term (2-4 years) |
| Rising ADAS penetration shrinking risk pool | -0.7% | Developed markets | Long term (≥4 years) |
| Source: Mordor Intelligence | |||
Heightened Data-Privacy Regulation (GDPR, CPRA)
The European Data Protection Board's mandates for explicit consent, local processing, and data minimization are raising compliance costs for insurers operating in the region. These regulations require companies to implement robust data governance frameworks, increasing operational complexity. Meanwhile, California's evolving CPRA introduces additional regional fragmentation, compelling insurers to establish parallel consent frameworks to address varying regulatory requirements. Although carriers are investing heavily in anonymization pipelines to mitigate privacy risks, restrictions on cross-border data pooling continue to limit scale economies in the usage-based insurance market. These limitations hinder the development of cohesive telematics scoring models, which rely on expansive and diverse datasets to deliver accurate insights. As a result, insurers must carefully balance the demands of data privacy with the need for product innovation, often customizing their offerings by jurisdiction to remain compliant while striving to maintain competitiveness in the market.
Patchy Actuarial Track Record for Smartphone-Only Scoring
Sensor heterogeneity, battery management, and user behavior skew motion data, introducing noise that weakens predictive power relative to OBD-II hardware. Actuaries cite inconsistent loss-ratio improvements, urging blended data strategies until models stabilize. The restraint slows pure-mobile adoption, but ongoing firmware and analytics advances should close gaps over the forecast window. Smartphone sensors vary widely in calibration and orientation, making consistent interpretation of acceleration, braking, and cornering events difficult. Environmental factors like phone placement or background app activity further degrade data quality. Meanwhile, insurers are piloting hybrid solutions that merge app-based inputs with occasional OBD-II verification to improve confidence levels. As mobile operating systems expand access to sensor APIs, data fidelity is expected to improve, unlocking wider underwriting acceptance.
*Our forecasts treat driver/restraint impacts as directional, not additive. The impact forecasts reflect baseline growth, mix effects, and variable interactions.
Segment Analysis
By Package: Behavioral Analytics Drive Market Evolution
Pay-How-You-Drive accounts for 33.78% of the global usage-based insurance market share in 2025, reflecting insurer comfort with mileage-adjusted and behavior-scored pricing. Premium discounts tied to braking, acceleration, and speed encourage safer driving, lowering claim severity. Manage-How-You-Drive, advancing at 12.98% CAGR, injects real-time coaching via app notifications and in-vehicle prompts that prevent incidents rather than merely pricing them. The transition toward proactive feedback elevates customer lifetime value because avoided claims sustain capital and smooth earnings, enhancing the usage-based insurance market.
Simultaneously, low-mileage drivers and urban commuters, who prioritize clear per-mile fees, continue to find value in Pay-As-You-Drive. This model appeals to individuals seeking cost-effective insurance solutions tailored to their specific driving habits. Insurers are now integrating mileage with behavioral metrics into unified indexes, a move that curbs adverse selection and fosters deeper customer engagement by rewarding safe and responsible driving. Progressive’s Snapshot and American Family’s DriveMyWay showcase a versatile approach, catering to both experienced drivers and tech-savvy newcomers. These programs leverage advanced telematics to provide real-time feedback and personalized pricing, enhancing customer satisfaction. These blended models underscore the industry's shift towards comprehensive, customer-focused offerings in global usage-based insurance, reflecting a broader trend of innovation and adaptability in the insurance market.


By Technology: Smartphone Systems Challenge Hardware Dominance
OBD-II dongles contributed 34.69% of the global usage-based insurance market size in 2025 as insurers leveraged mature firmware and engine bus access for dependable data. These hardware units capture telemetry from harsh events and provide engine diagnostics, enabling detailed risk segmentation for both fleets and high-risk drivers. The ability to deliver dependable and granular data has made OBD-II dongles a preferred choice for insurers aiming to enhance underwriting accuracy and pricing models. Meanwhile, smartphone telematics is witnessing a surge, growing at a 14.05% CAGR. This growth is attributed to the elimination of installation costs and the utilization of native sensors for gyroscopic and GPS signals, making it more accessible for everyday consumers. The convenience and cost-effectiveness of smartphone telematics are driving its adoption, particularly among younger and tech-savvy demographics who prioritize ease of use and minimal setup requirements.
Automakers like BMW, Kia, and Hyundai are rolling out embedded telematics APIs. These APIs transmit encrypted data packets straight from vehicle head units, allowing for insurer scoring without the need for aftermarket devices. This innovation reduces dependency on external hardware and enhances data security and accuracy by leveraging factory-installed systems. Furthermore, data-sharing consent is seamlessly integrated into infotainment menus, streamlining the onboarding process and enhancing conversion rates. By embedding consent mechanisms directly into the vehicle interface, automakers are simplifying user engagement and fostering trust among consumers. However, with OEM fee structures still in flux, carriers are adopting a cautious approach. They are leveraging a multi-source architecture that integrates signals from OBD-II, smartphones, and OEMs into cohesive scoring engines. This strategic flexibility bolsters their resilience and propels the growth of the usage-based insurance market. By maintaining diverse data sources, insurers can mitigate risks associated with reliance on a single technology while ensuring comprehensive and accurate risk assessments.
By Vehicle Type: Commercial Applications Lead Growth
In 2025, commercial fleets commanded a 22.12% share of the global usage-based insurance market. With operators increasingly adopting unified dashboards for logistics, safety, and coverage, this segment is set to experience a robust surge at a projected CAGR of 16.21%. These dashboards enable fleet operators to streamline operations, monitor driver behavior, and ensure compliance with safety standards, contributing to the segment's growth. Enhanced data consistency, achieved through professional driver training and fixed routes, empowers carriers to swiftly refine their risk assessments and optimize insurance offerings. Telematics platforms highlight the financial benefits, showcasing a 20% reduction in premiums and a 19% decrease in accident-related expenses. These figures underscore the value of integrated programs, solidifying the dominance of commercial fleets in the usage-based insurance landscape. Additionally, the ability to leverage real-time data and predictive analytics further strengthens the appeal of usage-based insurance for fleet operators, ensuring sustained growth in this segment.
While passenger vehicles present a vast potential in terms of sheer numbers, concerns over privacy and a patchwork of regulatory environments have tempered their adoption in the insurance market. Privacy concerns stem from the collection and use of sensitive data, which has led to hesitation among consumers. To alleviate data-sharing apprehensions, Insurers targeting this segment are prioritizing transparent opt-in policies and gamification strategies. These approaches aim to build trust and encourage participation by offering incentives and making the process more engaging for users. With the growing integration of Advanced Driver-Assistance Systems (ADAS), there is a potential shift in passenger insurance policies. They may evolve towards event-based micro-premium models, seamlessly merging vehicle sensor alerts with real-time pricing. This evolution could provide more personalized and cost-effective insurance solutions, ensuring the industry's upward trajectory continues. Furthermore, as regulatory frameworks gradually adapt to technological advancements, the passenger vehicle segment is expected to unlock additional growth opportunities in the usage-based insurance market.
Geography Analysis
In 2025, Europe held steady with a 26.45% share of the usage-based insurance market due to an EU mandate on event-data recorders. This mandate has made telematics hardware a standard feature in new vehicles, driving widespread adoption. Clear regulatory guidance is enabling players to standardize their product designs across borders and is speeding up data-sharing agreements between OEMs and insurers, fostering collaboration and innovation. Even with the high costs of GDPR compliance, tech-savvy consumers in the region are willingly exchanging data for discounts, ensuring a consistent demand. This consumer acceptance, combined with regulatory support, positions Europe as a key player in the global usage-based insurance market.
Asia-Pacific is projected to grow at a robust 17.22% CAGR, leading the way in contributing to rising premiums until 2031. The region's swift embrace of smartphones, coupled with mobile-centric insurance onboarding and adaptable regulatory environments in places like Singapore and India, is empowering carriers to effectively test risk-scoring algorithms. These sandboxes allow insurers to refine their offerings and scale operations efficiently. In Australia and New Zealand, fleet-management adoption is set to surge from 26.6% to 39.5% by 2028, driven by increasing demand for commercial vehicle monitoring and optimization. This growth is expected to significantly bolster commercial volumes, painting a brighter picture for the usage-based insurance market. The region's dynamic regulatory and technological landscape makes it a hotspot for innovation and growth in the sector.
North America stands as a seasoned player, with giants like Progressive, Allstate, and State Farm rolling out nationwide initiatives while advocating for consistent privacy laws. These companies leverage their extensive networks and technological capabilities to maintain their competitive edge. Federal mandates for impaired-driving prevention systems, set for 2026-2029, promise to introduce new data streams, potentially boosting the usage-based insurance market by enabling more accurate risk assessments. However, the patchwork of state-level privacy regulations complicates matters, necessitating agile consent management and tailored regional pricing strategies. Despite these challenges, North America remains a critical market, with its mature infrastructure and established players driving steady growth and innovation in the usage-based insurance space.

Competitive Landscape
The global usage-based insurance market exhibits moderate fragmentation. The top five players command just over half of the written premiums, creating a welcoming space for insurtech newcomers to innovate and capture market share. Progressive harnesses its expansive 27 billion-mile Snapshot dataset to enhance its machine-learning models, which significantly bolsters its underwriting advantages and enables more accurate risk assessment. Root Insurance showcases a shift in distribution strategies: direct-API distribution sidesteps traditional brokers, slashing acquisition costs while streamlining the customer acquisition process. This approach highlights the growing trend of leveraging technology to disrupt conventional insurance distribution channels.
Traditional insurers are doubling down on proprietary analytics to maintain competitiveness in the evolving market. Allstate has rolled out a patented, machine-learning-driven driver-assistance platform, offering personalized feedback to policyholders. This initiative aims to improve driving behavior and strengthen customer retention by providing added value. On another front, reinsurance behemoths like Munich Re and Swiss Re are backing niche UBI specialists. In exchange for their quota-share participation, these reinsurers gain access to detailed driving data, which enriches their portfolio analytics and enhances their ability to underwrite risk effectively. Meanwhile, Original Equipment Manufacturers (OEMs) and mobility platforms are intensifying competition by embedding insurance directly into leases or ride-hailing services. This strategy tightens distribution margins for traditional players and broadens market reach by integrating insurance into everyday mobility solutions, making it more accessible to consumers.
As costs for compliance, cloud processing, and data storage escalate, a wave of consolidation looms over the market. Mid-tier insurers, facing pressure to remain competitive, might find collaboration with telematics vendors, such as Cambridge Mobile Telematics or Octo Telematics. By sharing infrastructure with these vendors, insurers can reduce operational costs while preserving their brand identity and customer relationships. Over the forecast window, the ability to harness scale economics and depth in data science will be pivotal for survival in the usage-based insurance arena. Companies that can effectively leverage advanced analytics and optimize operational efficiencies are likely to emerge as leaders in this competitive market landscape.
Usage-Based Insurance Industry Leaders
Progressive Corporation
Allstate Corporation
State Farm Insurance
Liberty Mutual Insurance
Aviva plc
- *Disclaimer: Major Players sorted in no particular order

Recent Industry Developments
- February 2025: Allianz Partners and Cosmo Connected launched a USD 10.40 per month micromobility plan that embeds personal accident insurance within the Cosmo Fusion helmet.
- January 2025: USAA exited its standalone Pay As You Drive program, signaling a pivot toward integrated telematics bundling.
- January 2025: Qantev and InsureMO have joined forces in a global alliance, merging AI-driven claims optimization with insurance middleware. This collaboration aims to enhance operational efficiency and streamline processes for the insurance industry, leveraging advanced AI capabilities and middleware solutions. Together, they serve over 300 carriers globally, providing innovative tools to improve claims management and overall customer experience.
- December 2024: Viasat and Yolo teamed up to integrate usage-based coverage into services for connected vehicles. This partnership aims to enhance the functionality of connected vehicle services by offering tailored coverage options based on usage patterns, ensuring greater flexibility and efficiency for users.


Global Usage-Based Insurance Market Report Scope
Usage-based insurance (UBI) is auto insurance that uses data collected from the insured vehicle to determine the premium. This report aims to provide a detailed analysis of the usage-based insurance market. It focuses on the market dynamics, emerging trends in the segments and regional markets, and insights into the various product and application types. Also, it analyses the key players and the competitive landscape. The usage-based insurance (UBI) market is segmented by the package, which includes PHYD and PAYD; by technology, including OBD-II, smartphone, black box, and embedded telematics; by vehicle type, including passenger vehicle and commercial vehicle; and by geography, including North America, Europe, Asia-Pacific, South America, and the Middle East. The report offers market size and forecasts for the usage-based insurance markets in terms of revenue (USD) for all the above segments.
| Pay-As-You-Drive (PAYD) |
| Pay-How-You-Drive (PHYD) |
| Manage-How-You-Drive (MHYD) |
| OBD-II Dongle |
| Smartphone-based |
| Black-Box/After-market Device |
| Embedded Telematics (OEM) |
| Passenger Vehicles |
| Commercial Vehicles |
| North America | United States |
| Canada | |
| Mexico | |
| South America | Brazil |
| Peru | |
| Chile | |
| Argentina | |
| Rest of South America | |
| Europe | Germany |
| United Kingdom | |
| France | |
| Italy | |
| Spain | |
| BENELUX (Belgium, Netherlands, and Luxembourg) | |
| Nordics (Sweden, Norway, Denmark, Finland) | |
| Rest of Europe | |
| Asia Pacific | China |
| India | |
| Japan | |
| South Korea | |
| Australia | |
| South East Asia | |
| Indonesia | |
| Rest of Asia | |
| Middle East & Africa | United Arab Emirates |
| Saudi Arabia | |
| South Africa | |
| Nigeria | |
| Rest of Middle East |
| By Package | Pay-As-You-Drive (PAYD) | |
| Pay-How-You-Drive (PHYD) | ||
| Manage-How-You-Drive (MHYD) | ||
| By Technology | OBD-II Dongle | |
| Smartphone-based | ||
| Black-Box/After-market Device | ||
| Embedded Telematics (OEM) | ||
| By Vehicle Type | Passenger Vehicles | |
| Commercial Vehicles | ||
| By Geography | North America | United States |
| Canada | ||
| Mexico | ||
| South America | Brazil | |
| Peru | ||
| Chile | ||
| Argentina | ||
| Rest of South America | ||
| Europe | Germany | |
| United Kingdom | ||
| France | ||
| Italy | ||
| Spain | ||
| BENELUX (Belgium, Netherlands, and Luxembourg) | ||
| Nordics (Sweden, Norway, Denmark, Finland) | ||
| Rest of Europe | ||
| Asia Pacific | China | |
| India | ||
| Japan | ||
| South Korea | ||
| Australia | ||
| South East Asia | ||
| Indonesia | ||
| Rest of Asia | ||
| Middle East & Africa | United Arab Emirates | |
| Saudi Arabia | ||
| South Africa | ||
| Nigeria | ||
| Rest of Middle East | ||


Key Questions Answered in the Report
What is the current value of the global usage-based insurance market?
The global usage-based insurance market size is USD 34.79 billion in 2026 and is projected to reach USD 69.18 billion by 2031.
Which region holds the largest share in global usage-based insurance?
Europe leads with a 26.45% market share in 2025, aided by mandatory event-data recorders in all new vehicles.
Which segment is growing fastest within the global usage-based insurance packages?
Manage-How-You-Drive is the fastest-growing package, expected to post a 12.98% CAGR through 2031.
Why are commercial fleets adopting usage-based insurance rapidly?
Telematics delivers 20.1% premium savings and 19% accident-expense reductions, motivating fleets to integrate insurance with existing operational dashboards.
How do privacy regulations affect usage-based insurance programs?
GDPR and CPRA require explicit consent and data minimization, increasing compliance costs and slowing universal program rollouts.
What technologies are replacing traditional OBD-II dongles?
Smartphone telematics and embedded OEM APIs are expanding quickly because they reduce hardware costs and streamline customer onboarding, though data-access fees and sensor variability remain challenges.
Page last updated on:


