Market Overview
| Study Period | 2021 - 2031 |
|---|---|
| Base Year For Estimation | 2025 |
| Forecast Data Period | 2026 - 2031 |
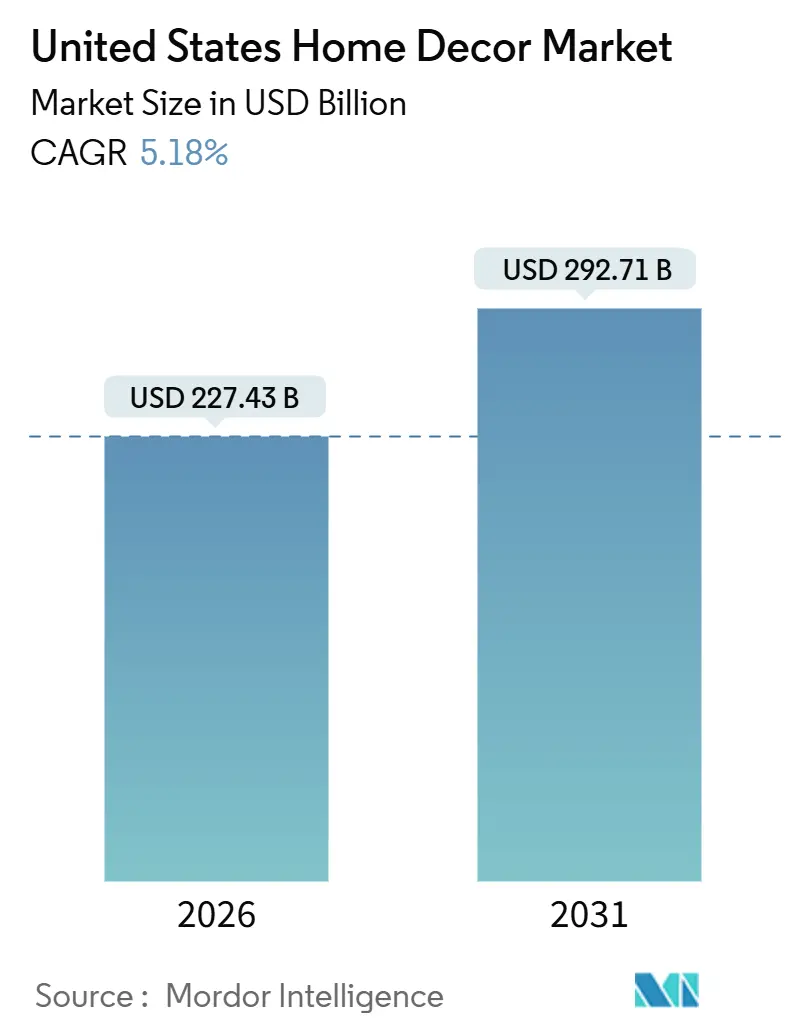
| Market Size (2025) | USD 227.43 Billion |
| Market Size (2030) | USD 292.71 Billion |
| Growth Rate (2026 - 2031) | 5.18% CAGR |
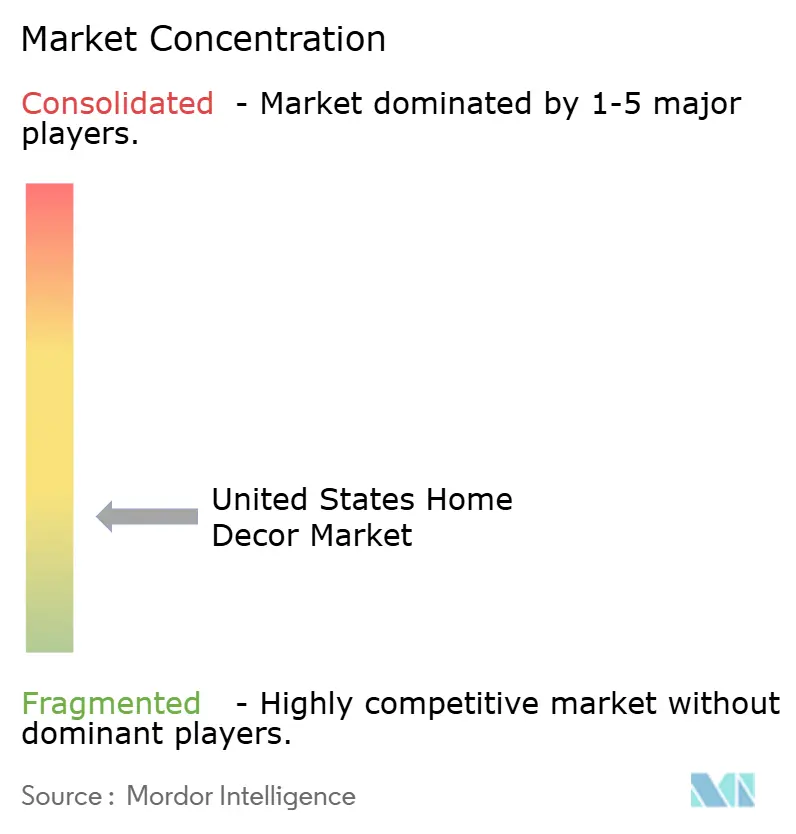
| Market Concentration | Low |
Major Players *Disclaimer: Major Players sorted in no particular order Image © Mordor Intelligence. Reuse requires attribution under CC BY 4.0. | |
United States Home Decor Market Analysis by Mordor Intelligence
The United States home decor market is estimated at USD 227.43 billion in 2025, and is expected to reach USD 292.71 billion by 2030, at a CAGR of 5.18% during the forecast period (2025-2030). The United States home Decor market is experiencing steady growth driven by long-term structural trends rather than short-term cyclical factors. Aging housing stock is prompting increased renovation activity, while remote work patterns are reshaping how consumers utilize and furnish their homes. Home office furniture and Decor are emerging as high-growth segments, reflecting the persistence of hybrid work and the repurposing of residential spaces. Sustainability is becoming a key factor, with eco-friendly materials and certifications influencing both product development and consumer purchase decisions.
Digital transformation is accelerating, as online and e-commerce channels gain share alongside traditional retail stores, supported by technology-enabled fulfillment and discovery tools. Premium and luxury segments are expanding as affluent consumers prioritize craftsmanship, customization, and high-quality design. Market fragmentation allows specialized players to capture niche demand, while competitive pressures across price bands encourage innovation in logistics, customer experience, and digital engagement. Overall, the market’s growth is anchored in behavioral shifts, technological adoption, and the need for functional, sustainable, and aesthetically appealing home environments.
Key Report Takeaways
- By product type, furniture led with 39.36% of the United States home decor market size in 2025, while home office furniture and Decor is projected to expand at an 11.87% CAGR through 2031.
- By material, wood held 44.44% of the United States home decor market share in 2025, and sustainable and reclaimed wood variants are set to grow at a 10.29% CAGR.
- By distribution channel, home-improvement and furniture stores held 46.74% of the United States home decor market share in 2025, while online and e-commerce are advancing at a 12.84% CAGR.
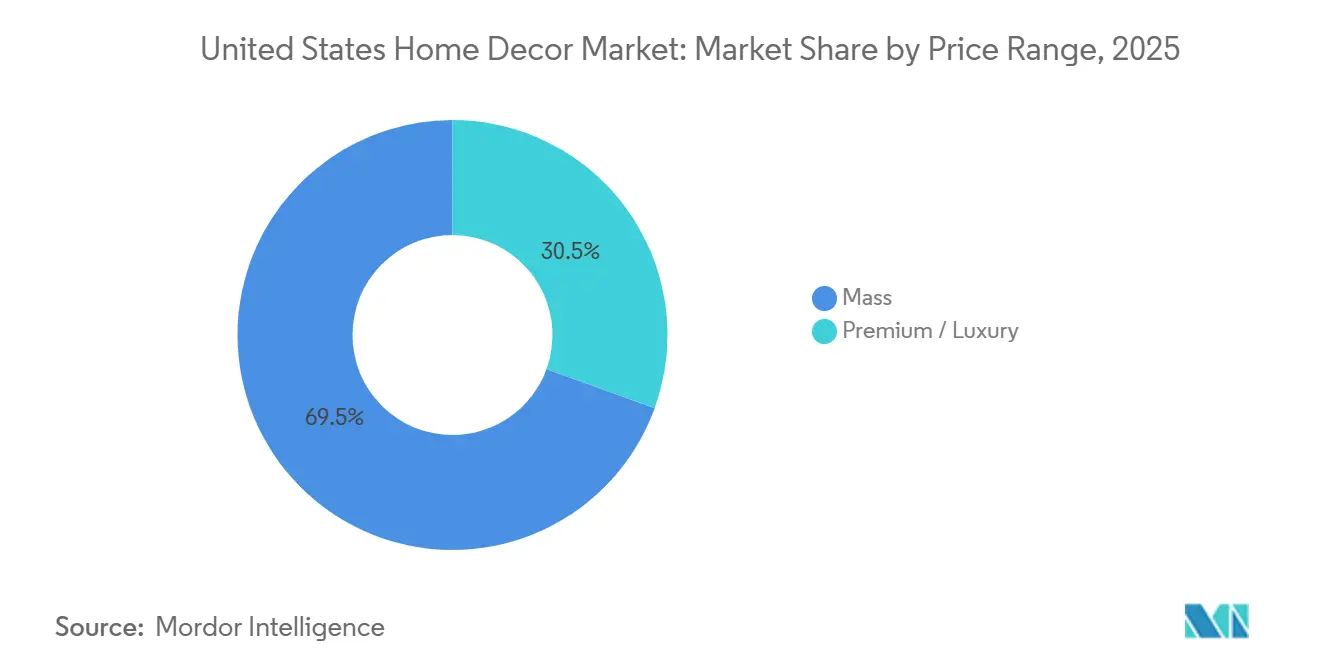
- By price range, mass-market accounted for 69.47% of the United States home decor market share in 2025, while premium and luxury segments are projected to grow at a 9.24% CAGR.
- By room, living rooms held 30.37% of the United States home decor market share in 2025, while home offices are expanding at an 11.87% CAGR.
- By geography, the South region accounted for 35.87% of the United States Home Decor Market share in 2025, while the West region is projected to advance at an 8.84% CAGR through 2031.
Note: Market size and forecast figures in this report are generated using Mordor Intelligence’s proprietary estimation framework, updated with the latest available data and insights as of January 2026.
United States Home Decor Market Trends and Insights
Drivers Impact Analysis
| Driver | (~) % Impact on CAGR Forecast | Geographic Relevance | Impact Timeline |
|---|---|---|---|
| Aging United States Housing Stock Supporting Renovation-Driven Décor Spending | 1.2% | Global, with the strongest impact in the Northeast (median age 60 years) and the Midwest (50 years) per U.S. Census data | Medium term (2-4 years) |
| Expansion in Single-Family Housing Starts and Existing Home Sales | 0.8% | National, with early gains in the South (35.87% market share) and the West (8.84% CAGR growth regions) | Short term (≤ 2 years) |
| Remote Work Driving Increased Home Office Décor Investment | 1.5% | APAC core spillover to knowledge-worker hubs (San Francisco, Austin, Boston, New York) | Long term (≥ 4 years) |
| Social Media–Influenced Trends Accelerating Décor Purchase Cycles | 0.7% | National, with spillover to suburban markets adopting Instagram/TikTok-driven aesthetics | Short term (≤ 2 years) |
| Omnichannel and AR Shopping Enhancing the Customer Experience | 1.1% | National, concentrated in metropolitan areas with high smartphone penetration and broadband access. | Medium term (2-4 years) |
| Sustainability and Eco-Conscious Preferences Driving Green Décor Demand | 0.9% | National, strongest in coastal regions (West, Northeast), with environmental consciousness | Long term (≥ 4 years) |
| Source: Mordor Intelligence | |||
Aging United States Housing Stock Supporting Renovation-Driven Décor Spending
The aging United States housing stock is a key driver of renovation-led spending in the home Decor market. Housing starts finished 2024 on a strong upward trend, with single-family construction showing notable resilience, even as multifamily development remained mixed. The National Association of Home Builders reported that housing starts finished 2024 on a strong upward trend, with overall starts rising to a 1.50 million annualized pace in December, the highest level since early 2024. This increase was driven by resilience in single‑family construction, which grew to just over 1 million units, even as multifamily development showed mixed results. For the full year 2024, total housing starts reached about 1.36 million units, slightly lower than the previous year, while single‑family starts increased compared with 2023. Multifamily starts, however, ended the year down significantly, highlighting a shift in builder focus [1]National Association of Home Builders, “Housing Starts End 2024 on an Up Note,” NAHB, nahb.org. Federal Reserve data shows that home purchases trigger significant increases in home-related outlays, with renovation, repairs, and furnishings representing the largest categories. Emotional and experiential factors also drive spending, as homeowners invest in projects that enhance satisfaction and comfort. Kitchen and other major home upgrades often spark complementary Decor purchases, reinforcing overall market growth. Overall, both structural housing trends and consumer behaviour combine to maintain steady demand for home Decor and renovation-led expenditures in the United States.
Expansion in Single-Family Housing Starts and Existing Home Sales
The growth in single-family housing starts and existing home sales continues to support demand for home Decor. Single-family housing starts registered 890,000 units at a seasonally adjusted annual rate in August 2025, with completions rising 6.7% month over month and 5.6% year over year, reflecting ongoing pipeline conversion even as new permits remain weak. Strong completions contribute to higher occupancy and create immediate furnishing and Decor needs as new homes are delivered. New home sales reached 800,000 units in August 2025, while the months’ supply compressed to 7.4 months as builders used incentives to move inventory and sustain sales volume. The limited supply of available homes further stimulates demand for interior upgrades and Decor items. Rising single-family activity and healthy home sales reinforce opportunities for renovation, furnishing, and aesthetic enhancements. Homeowners and new buyers increasingly invest in decorating and personalizing their spaces, boosting overall market growth. This trend highlights the strong connection between housing activity and sustained expenditure in the U.S. home Decor sector [2]U.S. Census Bureau, “New Residential Sales Press Release,” U.S. Census Bureau, census.gov. Existing home sales showed a modest improvement toward the end of the year, supported by some relief in mortgage rates, though overall activity remained below previous peaks. This trend shifts demand toward renovation and refresh cycles rather than complete home furnishing projects. Looking ahead, housing starts are expected to remain steady, providing a stable foundation for the home Decor market as household formation and new deliveries continue. For brands and retailers, this environment emphasizes opportunities to partner with builders and showcase staged model homes.
Remote Work Driving Increased Home Office Décor Investment
Telework rates stabilized at 22.9% of employed persons in early 2024, confirming that hybrid work arrangements are enduring and that households will continue allocating space and budget to home office setups. This shift drives sustained demand for ergonomic seating, adjustable desks, lighting, storage solutions, and sound management as homes accommodate intermittent work throughout the week [3]U.S. Bureau of Labor Statistics, “Telework rates increased over the year at all levels of educational attainment, first quarter 2024,” U.S. Bureau of Labor Statistics, bls.gov. Productivity research and industry reports show that sectors with higher remote work adoption experienced output gains, reinforcing employers’ ongoing support for flexible work models. Telework is more prevalent among highly educated and higher-income professionals, concentrating demand for premium-quality home office furnishings. Additionally, hybrid work often extends into adjacent living and dining areas, creating opportunities for modular and multifunctional furniture that balances aesthetics with functionality. These dynamics collectively underpin a long-term growth trajectory for home office Decor that is expected to outpace traditional categories within the United States Home Decor market.
Omnichannel and AR Shopping Enhancing the Customer Experience
The rise of e-commerce continues to transform how consumers discover and purchase home Decor, with online sales growing faster than overall retail and solidifying the importance of digital channels. Despite this shift, physical stores remain critical for high-touch and bulky items, with home-improvement and furniture retailers continuing to play a central role in major purchases. Leading e-commerce players are investing in tools that help translate inspiration into actionable purchases, enhancing the shopping experience. Wayfair reported USD 11.85 billion in revenue for 2024, returned to top-line growth in the third quarter of 2025, and continues to invest in tools that translate inspiration into action for home categories [4]Wayfair Inc., “Wayfair Announces Third Quarter 2025 Results,” Wayfair Inc., investor.wayfair.com. In early 2026, Wayfair introduced a generative AI tool that produces photorealistic room scenes from text prompts, allowing customers to shop directly from these visualizations and shifting value from traditional search to guided curation. Similarly, Target has combined content and commerce by offering curated experiences through conversational interfaces, helping shoppers discover multi-item baskets across home Decor and other categories. These innovations highlight a broader trend of integrating speed, selection, visualization, and trusted in-store environments. By enhancing the shopping journey and making inspiration actionable, retailers are expanding the accessible consumer base. Collectively, AI-driven visualization and curated experiences are strengthening engagement and supporting sustained growth in the United States Home Decor market.
Restraints Impact Analysis
| Restraint | (~) % Impact on CAGR Forecast | Geographic Relevance | Impact Timeline |
|---|---|---|---|
| Fluctuating Lumber and Textile Costs Pressuring Margins | -0.9% | National, with heightened pressure in timber-dependent regions and textile import hubs | Short term (≤ 2 years) |
| Higher Mortgage Rates Constraining Home Turnover and Spending | -1.3% | National, with stronger effects in high-cost metros where turnover is most constrained | Long term (≥ 4 years) |
| Supply Chain Bottlenecks Elevating Lead Times and Inventory Expenses | -0.7% | National, with an acute impact on coastal ports and import-dependent regions | Medium term (2-4 years) |
| Rising Inflation Reducing Consumer Discretionary Purchases | -0.8% | National, most pronounced in regions with high living costs | Medium term (2-4 years) |
| Source: Mordor Intelligence | |||
Fluctuating Lumber and Textile Costs Pressuring Margins
Volatile lumber and textile input costs create near-term pressures that affect pricing, assortment, and margins across the United States Home Decor market. Tariffs on building materials and related inputs can significantly increase project costs, impacting categories like cabinetry, flooring, and furniture tied to renovation activity. Import and export price trends in 2025 were mixed, with furniture-related imports rising while textiles and plastics saw modest declines, complicating vendor negotiations and retail pricing strategies. Policy changes and elevated tariff rates added uncertainty for buyers, prompting sourcing diversification and more complex logistics management. Premium brands with strong pricing power have been able to offset some of these pressures, while larger-scale operators leverage supplier terms and network efficiencies to absorb short-term cost spikes. The ability to manage input volatility effectively, as demonstrated by companies like Williams-Sonoma, highlights how vertical control and strategic channel mix can cushion the impact on margins.
Higher Mortgage Rates Constraining Home Turnover and Spending
Rising mortgage rates since 2024 have limited home sales turnover and deferred full-home furnishing projects, shifting consumer spending toward targeted room refreshes and replacement purchases. Existing home sales improved modestly, but activity remains below recent highs, emphasizing reliance on aging-in-place dynamics rather than move-related demand. Retailers are adjusting merchandising and marketing strategies to focus on incremental upgrades spread over multiple years instead of concentrated move-in purchases. Although the labour market and household finances are supportive, higher financing costs continue to restrict mobility, reducing the flow of first-time and move-up buyers who typically purchase across multiple rooms. Categories such as home office and bathrooms have captured share as messaging around comfort, wellness, and productivity resonates more than purely cyclical appeals. Overall, the market favours steady execution, clear value propositions, and strong omnichannel capabilities while demand for large-ticket items remains constrained by financing pressures.
Segment Analysis
By Product Type: Home Office Decor Outpaces Traditional Categories
Furniture commanded 39.36% of market size in 2025, while home office furnishings and Decor posted the fastest trajectory with an 11.87% CAGR projected through 2031 as hybrid work patterns persist. Consumers are increasingly investing in ergonomic chairs, adjustable desks, lighting, and sound management solutions to support flexible work routines and video calls at home. Telework has become a stable part of employment trends, sustaining demand for functional yet stylish home office infrastructure. Retailers are emphasizing multipurpose solutions such as modular shelving and cable-managed desks that integrate technology without compromising living space aesthetics. The market has adapted by balancing productivity essentials with decorative accents, boosting the popularity of curated bundles and room sets in both online and in-store experiences.
Home textiles continue to perform strongly, driven by regular refresh cycles and wellness-oriented features, while performance fabrics gain traction for their durability and comfort properties. Flooring and carpet demand shows mixed momentum as households prioritize materials that offer long-term resilience and easy maintenance. Wall Decor is experiencing a modest resurgence as homeowners seek personalization, with customization and made-to-order options helping differentiate retailers. Lighting is shifting toward smart, modular solutions that serve both task and ambient needs while optimizing energy use. Overall, the United States Home Decor market is increasingly focused on spaces that serve multiple functions, with home office furnishings leading the transformation.

Note: Segment shares of all individual segments available upon report purchase
Get Detailed Market Forecasts at the Most Granular Levels
Download PDF
By Material: Sustainable Wood Commands Premium While Synthetics Gain Share
Wood retained a 44.44% market share in 2025, supported by durability, repairability, and cross-style appeal, while sustainable and reclaimed wood posted a 10.29% CAGR outlook as certifications and responsible sourcing become stronger differentiators. This is valued for its durability, repairability, and broad design appeal, while sustainable and reclaimed wood is gaining traction as responsible sourcing becomes a key differentiator. Retailers have expanded certified assortments, and brands adopting rigorous sourcing and traceability standards are seeing measurable gains in consumer trust and market positioning. Initiatives such as increasing certified content in products and switching packaging to sustainable paper are becoming part of broader environmental strategies. Collaborations with international suppliers ensure the availability of certified wood for imported furniture, while niche manufacturers emphasize domestic and regional sourcing to appeal to sustainability-conscious buyers. Overall, certified and reclaimed wood are capturing a premium, while mass-market offerings balance affordability with responsible material choices.
Other materials, such as metal, textiles, glass, plastics, and stone, serve targeted purposes within home Decor assortments, meeting distinct functional and aesthetic needs. Metal benefits from recycled content and structural stability, although tariffs can influence costs and delivery timing. Textiles vary between organic fibres and advanced synthetics, with adoption influenced by household budgets and preference for premium features in bedding and upholstery. Recycled glass is popular in lighting and decorative tiles, while plastics and synthetics dominate outdoor and storage applications due to weather resistance and ease of maintenance. Stone and ceramic continue to stand out in premium spaces, and the market increasingly emphasizes durability, care guidance, and clearly labelled material claims to extend product life and enhance perceived value.
By Distribution Channel: E-Commerce Surges While Physical Stores Anchor High-Touch Categories
Home-improvement and furniture stores held a 46.74% market share in 2025, which underscores the importance of sensory validation and project support for big-ticket and bulky purchases, while online and e-commerce channels recorded a 12.84% CAGR. Online penetration is expanding as digital-first platforms combine logistics density with tools that simplify discovery and purchasing. Innovative solutions, such as AI-driven room visualization and curated shopping experiences, allow consumers to move from inspiration to purchase with less reliance on in-person browsing. Large omnichannel retailers are experimenting with conversational commerce and integrated curation, linking inspiration, checkout, and pickup to encourage multi-category baskets. The market increasingly favours hybrid models that merge speed, visualization, design support, and installation capability across both physical and digital channels.
Home centers and specialty retailers are investing heavily in delivery networks and professional services to enhance reliability for Decor items that accompany building projects. Strategic acquisitions and partnerships strengthen design, distribution, and installation capabilities, supporting both professional and consumer spending. Smaller specialty boutiques face pressure from scaled omnichannel players and pure e-commerce platforms that offer broader selection and faster delivery. Supermarkets and hypermarkets continue to play a minor role, focusing mainly on small Decor items and textiles that complement regular shopping. Overall, physical stores remain critical for high-touch categories, while e-commerce drives growth and sets higher expectations for visualization, delivery speed, and seamless returns.

Note: Segment shares of all individual segments available upon report purchase
Get Detailed Market Forecasts at the Most Granular Levels
Download PDF
By Price Range: Mass Market Dominates Volume, Premium Captures Margin Growth
Mass-market products held 69.47% market share in 2025, which reflects broad price sensitivity and the strength of accessible formats, while premium and luxury segments are projected to grow at a 9.24% CAGR due to sustained demand for craftsmanship, customization, and transparent sourcing. Premium players in the United States Home Decor market leverage supply chain efficiencies and proprietary product designs to maintain strong operating margins even during periods of uneven demand. High-income consumers are drawn to differentiated brand narratives, artisanal materials, FSC-certified wood, and elevated finishes, which increase willingness to pay. Retailers like Ingka Group focus on affordability and operational efficiency while expanding formats that cater to planning-intensive categories such as kitchens and wardrobes. These strategies create a broad price spectrum, enabling households to mix high-end and value items within rooms as budgets evolve. The combination of premium offerings and operational discipline allows brands to capture both aspirational and core segments effectively.
Value-driven retailers emphasize price leadership, flexible financing, and durable assortments to attract households that delay large-ticket purchases but continue to refresh rooms with accessories and textiles. Mass-market offerings focus on versatile designs and resilient finishes that extend product lifecycles across multiple aesthetics. At the premium end, curated collaborations and made-to-order programs maintain freshness and support margins even when volumes fluctuate. The market continues to expand at the premium tier, driven by high-income demand and supply chain advantages that protect service levels and availability. Overall, clear communication of total value, including durability, service, and delivery speed, helps retailers succeed across the full price spectrum.
Get Detailed Market Forecasts at the Most Granular Levels
Download PDF
By Room: Living Room Leads Share, Home Office Commands Growth
Living rooms held 30.37% of the total market size within the room segments in 2025, which reflects their central role in household life, while the home office remains the fastest-growing room at an 11.87% CAGR outlook as hybrid work stabilizes. Bedrooms continue to see steady demand, driven by a wellness focus on sleep systems and textiles, with innovations that enhance comfort and functionality. Kitchens and dining areas exhibit a split in consumer behaviour, as high-income households pursue renovations featuring premium appliances and surfaces, while budget-conscious buyers update in stages. Bathroom projects benefit from aging-in-place considerations and comfort-oriented features, with upgrades often triggering additional accessory and Decor purchases. Outdoor and patio furnishings are expanding to support entertaining and relaxation, with durable materials and performance fabrics extending product lifecycles in varying climates. Overall, these trends highlight the importance of both functional improvements and aesthetic appeal across core living spaces.
The home office segment reflects space reallocation within existing homes rather than major expansions, sustaining demand for modular furniture that fits into living rooms, bedrooms, and dens. Desks with built-in power management and cable organization cater to long-term hybrid work requirements, while adjustable lighting supports video calls and reading tasks. Sound management solutions, such as rugs and panelling, address open-plan acoustics and encourage coordinated Decor across adjoining areas. While living rooms remain the largest segment by market share, the fastest spending growth occurs in rooms that support productivity and recovery, including home offices and bathrooms. Regional differences shape product selection, with larger Southern homes favouring full-suite office setups and urban apartments prioritizing compact, space-saving solutions.
Geography Analysis
The South accounted for a 35.87% market share in 2025, supported by lower housing costs, net in-migration, and a younger housing stock that shapes product mix and installation needs. The South holds a significant share of the United States Home Decor market, driven by lower housing costs, net in-migration, and a younger housing stock that shapes product needs and installation priorities. Dense home centre networks in the region strengthen last-mile delivery for bulky renovation items, often paired with Decor purchases. Value-oriented strategies remain prominent, as national chain expansions improve access and accelerate fulfilment. Outdoor living categories perform well due to milder climates and larger yards, supporting demand for durable and weather-resistant materials. Overall, stable household formation and migration from higher-cost areas help maintain project activity even when national sales volumes soften.
The West, with a smaller base, is projected to grow at the fastest regional pace with an 8.84% CAGR, supported by technology sector incomes and sustainability preferences that favour certified materials and premium craftsmanship. California leads with format innovations that combine design support, digital ordering, and planning-focused experiences for kitchens, wardrobes, and storage solutions. Households prioritize sustainability and material provenance, boosting demand for FSC-certified wood, low-emission finishes, and ethically sourced textiles. Port logistics can create lead-time challenges for imports, which favours retailers with diversified sourcing and strategically located warehouses. This regional growth emphasizes the importance of curated assortments and efficient logistics to meet consumer expectations.
The Northeast and Midwest provide complementary market dynamics, supporting both renovation and refresh cycles. The Northeast’s older housing stock drives replacement-heavy projects and space-saving solutions tailored to urban living, while strong concentrations of knowledge workers sustain home office demand. In the Midwest, renovation needs align with affordability, enabling full-suite furniture purchases and leveraging North American sourcing to reduce freight delays. Omnichannel approaches across both regions enhance in-store validation, visualization tools, and fast delivery, meeting consumer expectations for Decor items. These geographic trends collectively ensure that the United States Home Decor market remains diverse, resilient, and adaptable through 2031.
Competitive Landscape
The United States home decor market exhibits low concentration, reflecting a highly fragmented landscape where the largest companies collectively hold a modest share, and no single player dominates. This structure creates opportunities for national and regional specialists to carve out positions across channels and price tiers. Home Depot and Lowe’s capture significant portions of the broader home goods landscape, leveraging dense store networks, professional partnerships, and fast delivery that also support Decor categories tied to renovation projects. Home Depot’s deal for SRS Distribution to acquire GMS expands access to specialty building product distribution, enhancing contractor relationships and delivery capabilities that complement Decor sales. Similarly, Lowe’s acquisition of Artisan Design Group strengthens its design, distribution, and installation offerings for interior surfaces, which drives adjacent Decor demand. Together, these moves reinforce omnichannel strategies that integrate product availability, visualization, and fulfillment across categories.
IKEA USA continues to focus on affordability and footprint expansion, opening new formats that combine consultative selling with digital ordering for kitchens and storage planning. Ingka Group reported improvements in operating income and net profit while expanding its North American presence, reflecting a long-term commitment to the United States market. Williams-Sonoma executes a premium strategy, maintaining high margins through proprietary designs, supply chain efficiencies, and a mix of Decor and seasonal accessories that turn quickly. Wayfair returned to growth in 2025 and introduced Muse, a generative AI-powered discovery tool, which converts inspiration into actionable furniture and Decor purchases. Collectively, these companies illustrate different approaches to scale, from logistics-driven efficiency to design-led differentiation, that shape competitive dynamics.
Competition is centered on three key battlegrounds that will define performance through 2031. Speed favors scaled networks that deliver bulky items quickly, meeting customer expectations around remodel schedules. Discovery is increasingly driven by AI and AR tools that reduce hesitation and build confidence in online Decor and furniture purchases. Brand authority, fueled by sustainability credentials, proprietary designs, and multi-brand portfolios, allows premium pricing and cohesive room solutions. In this fragmented market, second-tier and regional players can still grow by focusing on localized assortments, service quality, and partnerships with marketplaces to extend reach, while larger players leverage scale, design, and omnichannel strength to maintain durable advantages.
United States Home Decor Industry Leaders
The Home Depot Inc.
Lowe’s Companies Inc.
IKEA USA (Ingka Holding)
Williams-Sonoma Inc.
Wayfair Inc.
- *Disclaimer: Major Players sorted in no particular order
Need More Details on Market Players and Competitors?
Download PDF
Recent Industry Developments
- June 2025: The Home Depot announced that SRS Distribution entered a definitive agreement to acquire GMS Inc. for an enterprise value of USD 5.5 billion, expanding specialty building products distribution and enhancing reach into professional contractor spend.
- June 2025: Lowe’s completed the acquisition of Artisan Design Group, a nationwide provider of design, distribution, and installation services for interior surface finishes serving home builders and property managers.
- February 2025: Wayfair introduced Muse, an AI-powered tool that generates photorealistic room scenes from text prompts and allows direct shopping from those scenes on its app and website.
Research Methodology Framework and Report Scope
Market Definitions and Key Coverage
Our study defines the United States home decor market as the aggregate sales value of new residential furniture, soft home textiles, floor and wall coverings, indoor decorative lighting, and small decorative accessories sold through physical and digital retail across all fifty states. Imported items are counted once they clear U.S. customs, and values are expressed in current-year dollars at the first point of retail.
Major appliances, consumer electronics, building materials, and any second-hand or rental products are excluded.
Segmentation Overview
- By Product Type
- Furniture
- Home Textiles
- Flooring & Carpets
- Wall Décor (Paintings, Wallpapers)
- Lighting Fixtures
- Decorative Accessories (Vases, Candles, Clocks)
- By Material
- Wood
- Metal
- Textile
- Glass
- Plastic & Other Synthetics
- Stone & Ceramic
- By Distribution Channel
- Home-Improvement & Furniture Stores
- Specialty Décor Stores
- Supermarkets & Hypermarkets
- Online / E-commerce
- Others (Boutiques, Art Galleries)
- By Price Range
- Mass
- Premium / Luxury
- By Room
- Living Room
- Bedroom
- Kitchen & Dining
- Bathroom
- Home Office
- Outdoor & Patio
- By Geography
- Northeast
- Midwest
- South
- West
- Cross-Segmentation: Region × Product Type
Detailed Research Methodology and Data Validation
Primary Research
Mordor analysts interviewed store managers, category buyers, logistics partners, and decor artisans across the Northeast, Midwest, South, and West. Conversations clarified average selling prices, emerging style themes, and the true online share, closing gaps that secondary data left open and grounding our forecasts in day-to-day market reality.
Desk Research
We began by tying Census Monthly Retail Trade data with Bureau of Economic Analysis supply-use tables, import statistics from USITC DataWeb, and Federal Reserve manufacturing shipments, which are then complemented by insights from trade bodies such as the Home Furnishings Association and National Retail Federation. Company 10-Ks, investor decks, and credible business media illustrate price moves and channel mix. Paid resources, including D&B Hoovers for company financials and Dow Jones Factiva for archival news, enrich the fact base. These references are illustrative; numerous additional public and subscription sources were consulted during data collection and validation.
Market-Sizing & Forecasting
We employ a top-down construct that starts with government retail turnover, domestic output, and landed import value, which are then aligned to our product taxonomy. Select bottom-up checks, sampled retailer ASP x unit sales and channel audits, validate totals. Key drivers in the model include single-family housing starts, disposable personal income, average renovation spend, e-commerce penetration, seasonal discount depth, and imported wood-furniture duty rates. A multivariate regression links these variables to historic demand, and an ARIMA overlay captures cyclical swings before projecting to 2030. Data voids within sub-segments are bridged using weighted inputs from expert interviews.
Data Validation & Update Cycle
Outputs pass two layers of analyst review, during which anomalies are traced back to driver inputs and reconciled with third-party indicators. Reports refresh annually, with interim updates triggered by material events such as tariff shocks or major retailer bankruptcies, ensuring clients receive our latest calibrated view.
Why Mordor's United States Home Decor Baseline Commands Reliability
Published market values often diverge because firms draw category lines differently, convert trade data in assorted ways, and refresh models on uneven schedules.
Key gap drivers we observe include inclusion of outdoor garden décor, exclusion of pure-play online retailers, uniform price escalation rules, and refresh cycles longer than the annual cadence our team follows.
Benchmark comparison
| Market Size | Anonymized source | Primary gap driver |
|---|---|---|
| USD 215.2 B (2025) | Mordor Intelligence | - |
| USD 237.9 B (2024) | Global Consultancy A | Includes outdoor garden décor and applies fixed 8.9 % growth without retail channel checks |
| USD 185.0 B (2024) | Industry Association B | Omits online pure-play sales and relies on pre-pandemic price indices |
These comparisons show that our disciplined scope, blended model logic, and yearly refresh deliver a balanced, transparent baseline that decision-makers can trace to clear variables and replicate with confidence.
Need A Different Region or Segment?
Customize Now
Key Questions Answered in the Report
What is the current size and growth outlook for the United States Home Decor market?
The United States Home Decor market size is USD 227.43 billion in 2026 and is projected to reach USD 292.71 billion by 2031 at a 5.18% CAGR.
Which categories are growing fastest within United States home Decor?
Home office furnishings and Decor lead growth with an 11.87% CAGR as hybrid work stabilizes and rooms get reconfigured for productivity.
How are channels shifting in the United States Home Decor market?
Online/E-commerce are growing at a 12.84% CAGR, while home-improvement and furniture stores remain the largest channel at 46.74% share.
Which materials and sustainability signals matter most to United States buyers?
FSC-certified and reclaimed wood lead premium growth, supported by retailer commitments and broader sustainability programs that build trust.
Which United States regions are most influential for home Decor demand?
The South holds the largest share at 35.87%, while the West is projected to post the fastest growth at 8.84% CAGR through 2031.
How are leading companies competing in the United States home Decor?
Leaders invest in speed, visualization, and brand authority, seen in logistics expansions, AI-led discovery tools, and proprietary design portfolios that sustain margins.


