Energy & Power
30th JulyUnlocking Market Potential for Solid-State Transformers
3 Min Read
The United States Electric Vehicle Charging Equipment Market Report is Segmented by Charging Level (Level 1, Level 2, DC Fast, Ultra-Fast, and Megawatt Class), Installation Site (Residential, Commercial and Retail, Public Municipal, and Transportation Hubs), and Application (Home, Workplace, Public Urban, Highway Corridor/En-Route, and Fleet and Depot). The Market Sizes and Forecasts are Provided in Terms of Value (USD).
Market Overview
| Study Period | 2020 - 2030 |
|---|---|
| Base Year For Estimation | 2024 |
| Forecast Data Period | 2025 - 2030 |
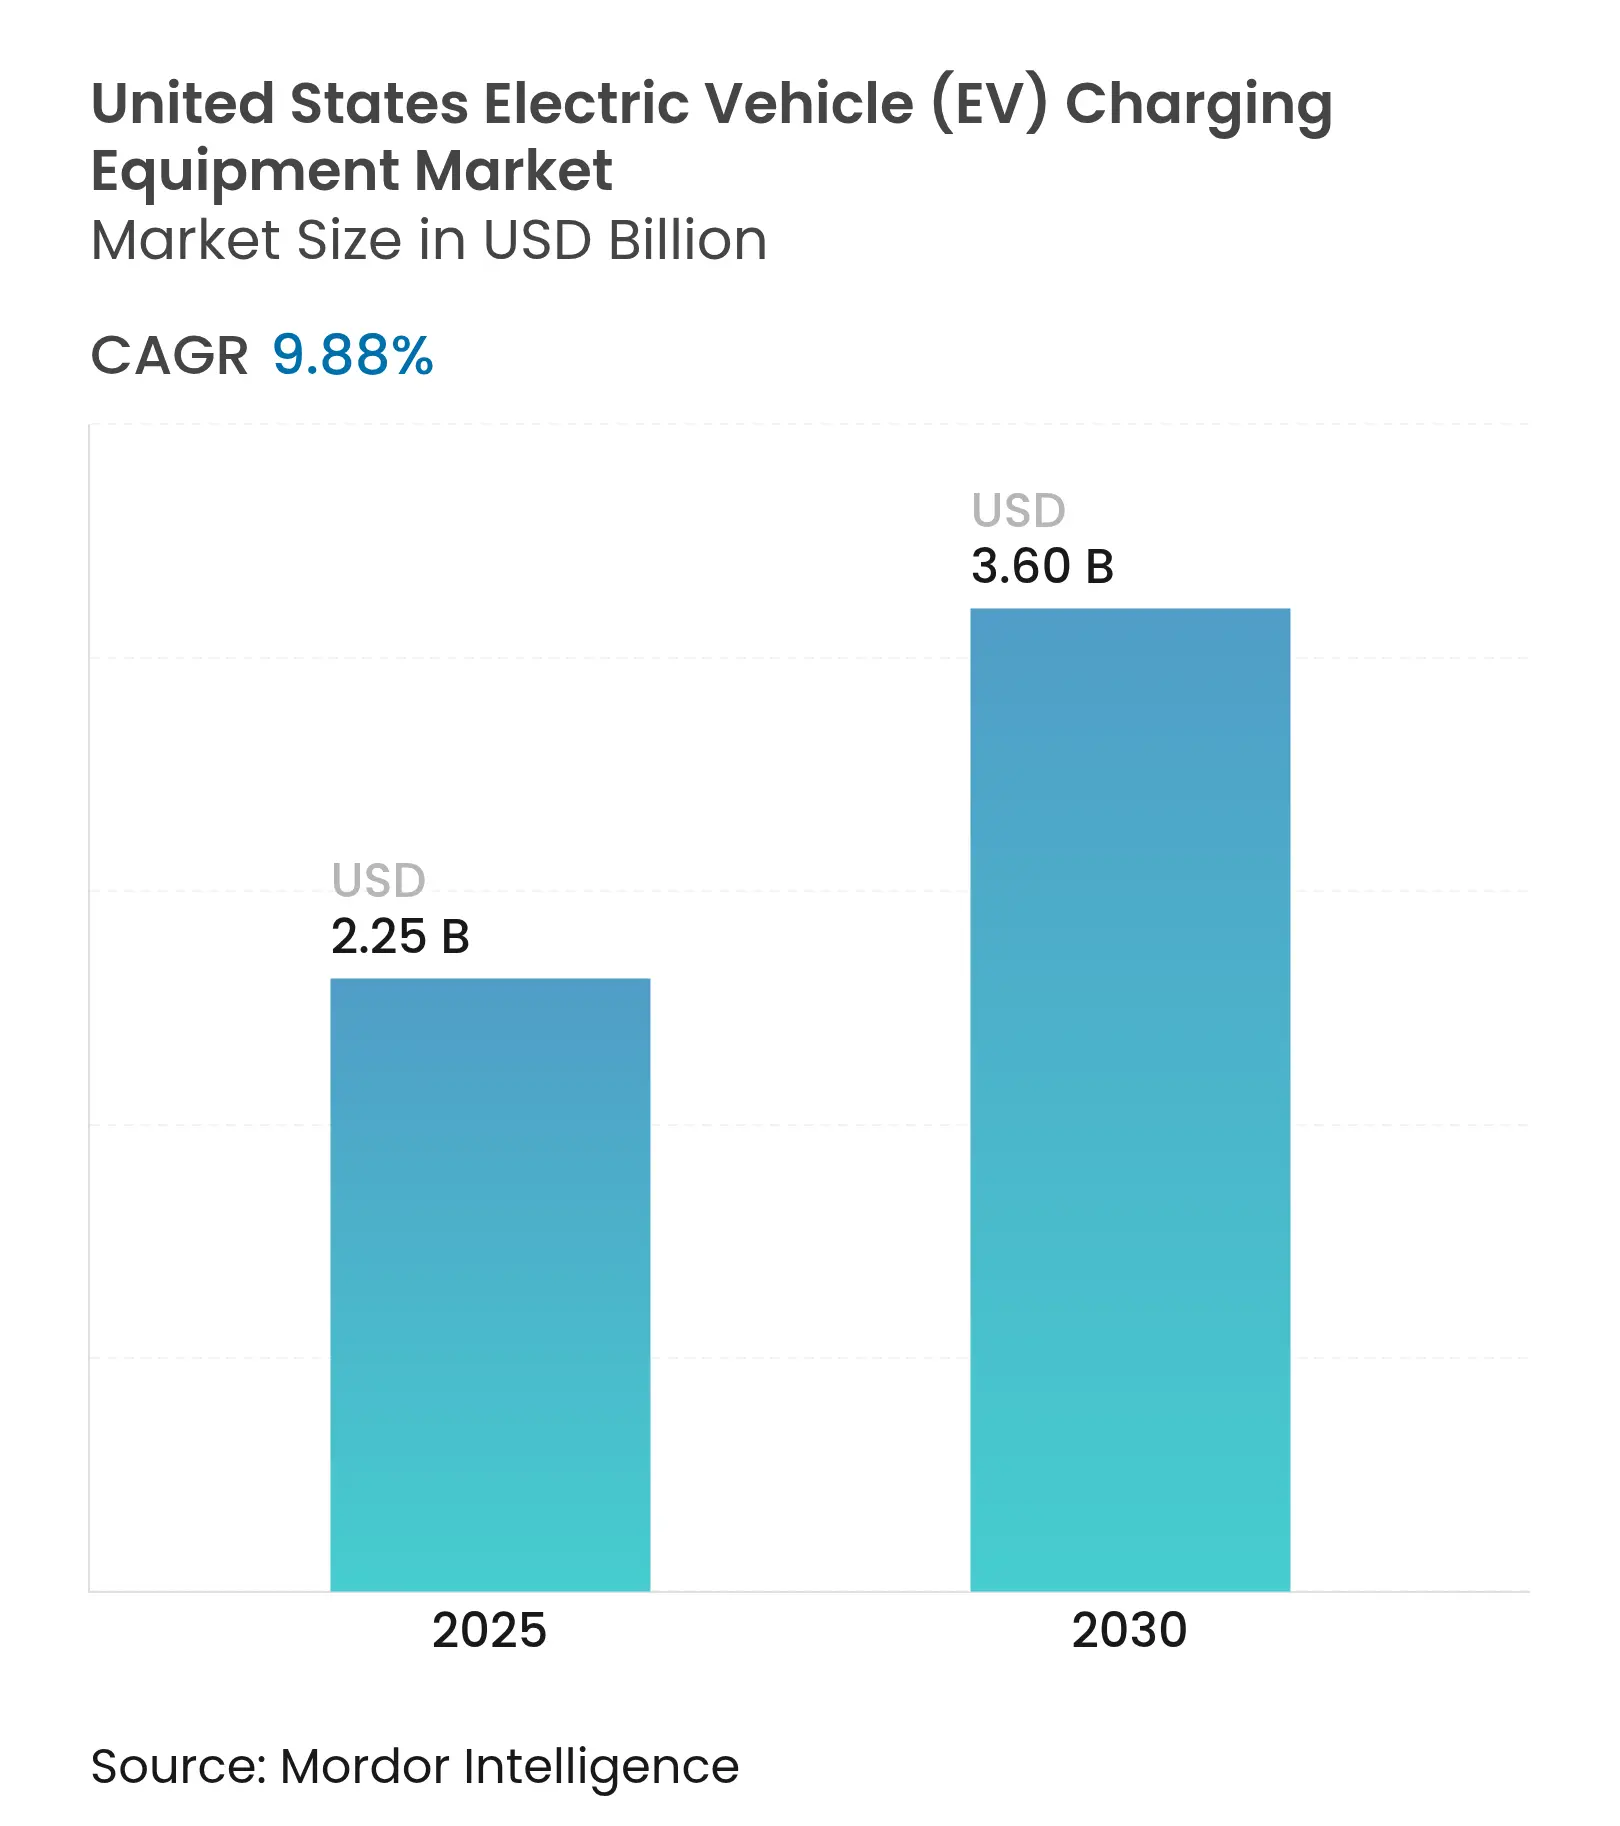
| Market Size (2025) | USD 2.25 Billion |
| Market Size (2030) | USD 3.60 Billion |
| Growth Rate (2025 - 2030) | 9.88 % CAGR |
| Market Concentration | High |
Major Players_Charging_Equipment_Market.webp&w=828&q=100) *Disclaimer: Major Players sorted in no particular order. Image © Mordor Intelligence. Reuse requires attribution under CC BY 4.0. |
Strong battery-electric vehicle (BEV) uptake, the codification of the North American Charging Standard (NACS) as SAE J3400, and rapidly scaling private-sector capital are reshaping investment priorities. State incentive programs increasingly offset the pause in NEVI grant disbursements, while utilities explore rate-based recovery and battery-integrated sites to mitigate demand-charge risk. Interoperability improvements stemming from multi-OEM adoption of NACS have accelerated site utilization and tempered range anxiety for non-Tesla drivers. Meanwhile, megawatt-class hardware aimed at heavy-duty trucks is emerging as the next revenue pool as fleets electrify under California Air Resources Board (CARB) regulations. Competitive positioning has shifted toward operators able to self-finance and navigate utility queues, with demand-charge abatement and software-defined load management now core differentiators.
Key Report Takeaways
Drivers Impact Analysis
| Driver | (~) % Impact on CAGR Forecast | Geographic Relevance | Impact Timeline | |||
|---|---|---|---|---|---|---|
Increasing BEV adoption and record OEM investments Increasing BEV adoption and record OEM investments | +2.50% | National, with concentration in California, Northeast corridor, and Pacific Northwest | Medium term (2-4 years) | (~) % Impact on CAGR Forecast:+2.50% | Geographic Relevance:National, with concentration in California, Northeast corridor, and Pacific Northwest | Impact Timeline:Medium term (2-4 years) |
Federal NEVI funding and state-level incentives Federal NEVI funding and state-level incentives | +1.80% | National, with highest allocations in Texas, California, Florida, and New York | Short term (≤ 2 years) | |||
Corporate fleet electrification road-maps Corporate fleet electrification road-maps | +1.50% | National, with early deployment in urban logistics hubs (Los Angeles, New York, Chicago) | Medium term (2-4 years) | |||
Rapid shift to NACS improving interoperability Rapid shift to NACS improving interoperability | +1.20% | National, accelerating in regions with dense Tesla Supercharger coverage | Short term (≤ 2 years) | |||
Utility demand-charge mitigation via onsite batteries Utility demand-charge mitigation via onsite batteries | +0.80% | California, Texas, Northeast states with time-of-use rates | Long term (≥ 4 years) | |||
Mandatory smart-charging enrollment in utility DR programs Mandatory smart-charging enrollment in utility DR programs | +0.70% | California (SB 676), Texas ERCOT territory, select Northeast utilities | Medium term (2-4 years) | |||
| Source: Mordor Intelligence | ||||||
Increasing BEV Adoption And Record OEM Investments
Battery-electric vehicle sales hit 1.2 million units in 2024, and automakers have earmarked USD 312 billion for domestic EV and battery plants through 2030. General Motors and Ford have funneled USD 35 billion and USD 50 billion, respectively, into electric platforms, forming regional charging clusters near Tennessee, Michigan, and Kentucky assembly hubs. Tesla’s Gigafactory Texas and Rivian’s Illinois operation employ more than 20,000 workers, driving workplace charging demand along commuter corridors. Dedicated EV architectures such as Ultium trim production costs, reducing total cost of ownership for fleets and quickening replacement cycles. As battery prices fall, first-cost parity with internal-combustion vehicles narrows, expanding the addressable pool for residential and fleet charging.
Federal NEVI Funding And State-Level Incentives
The Infrastructure Investment and Jobs Act allocated USD 5 billion to the NEVI program, but Executive Order 14154 paused fresh disbursements in January 2025, temporarily stalling corridor build-outs. By December 2024, 31 NEVI-funded stations were online, while California deployed USD 1.4 billion of state funds to install 90,000 public and shared-private ports. Texas devoted USD 408 million primarily to freight corridors, and New York’s ChargeNY targets 10,000 public ports by 2025. The NEVI pause shifts risk to private capital and favors operators able to finance through utility tariffs and loan guarantees.
Corporate Fleet Electrification Road-Maps
Amazon fielded 17,000 Rivian vans by 2024, supported by 17,000 depot chargers, aiming for 100,000 vans by 2030. FedEx operated 9,884 alternative-fuel vehicles and 1,000 charging stations, while USPS ordered up to 165,000 battery-electric delivery vehicles requiring infrastructure at 400 facilities. Fleet depots access off-peak tariffs of USD 0.08–0.12 per kWh, far below public DC fast-charging rates, improving economics and accelerating the US EV charging equipment market adoption curve.
Rapid Shift To NACS Improving Interoperability
SAE J3400 formalized Tesla’s connector as an open standard in December 2023, prompting Ford, GM, Rivian, and others to equip 2025 models with native NACS ports. Tesla opened 20,000 Supercharger connectors to non-Tesla drivers, and ChargePoint, along with EVgo, are retrofitting CCS sites with NACS cables. Convergence lowers capex for site hosts by eliminating dual-standard dispensers and lifts utilization during off-peak hours.(1)SAE International, “SAE J3400: NACS Connector Standard,” sae.org
Restraints Impact Analysis
| Restraint | (~) % Impact on CAGR Forecast | Geographic Relevance | Impact Timeline | |||
|---|---|---|---|---|---|---|
High installation and grid-upgrade costs High installation and grid-upgrade costs | -1.20% | National, acute in rural and exurban areas lacking three-phase service | Short term (≤ 2 years) | (~) % Impact on CAGR Forecast:-1.20% | Geographic Relevance:National, acute in rural and exurban areas lacking three-phase service | Impact Timeline:Short term (≤ 2 years) |
Lengthy utility interconnection and permitting delays Lengthy utility interconnection and permitting delays | -0.90% | California, Texas, Northeast corridor with utility queue backlogs | Medium term (2-4 years) | |||
Distribution-transformer shortages lengthening project lead-times Distribution-transformer shortages lengthening project lead-times | -0.70% | National, with severe impact on DC fast-charging and megawatt-class projects | Medium term (2-4 years) | |||
Anti-EV policy movements slowing site approvals in select states Anti-EV policy movements slowing site approvals in select states | -0.50% | Wyoming, select Midwest and Southern states with fossil-fuel economies | Long term (≥ 4 years) | |||
| Source: Mordor Intelligence | ||||||
High Installation And Grid-Upgrade Costs
A single 150-kW DC fast charger can cost USD 50,000–150,000 to install, while service upgrades may add USD 50,000–500,000 and 18–36 months of lead time. Ultra-fast and megawatt systems demand three-phase high-voltage feeds rarely available at gas stations, pushing total installed cost up by 60–80%. Residential Level 2 retrofits requiring panel upgrades can reach USD 8,000, hampering uptake among renters and lower-income households.
Lengthy Interconnection Delays, Transformer Shortages, And Policy Headwinds
California and Texas utility interconnection queues stretched to 12–24 months in 2024, and transformer lead times ballooned to 12–24 months, forcing operators to deploy interim battery storage or delay openings. Wyoming’s House Bill 259 to phase out new EV sales, though stalled, reflected regional resistance that adds planning uncertainty.(2)California Public Utilities Commission, “Interconnection Queue Data,” cpuc.ca.gov
By Charging Level: Megawatt Systems Target Heavy-Duty Fleets
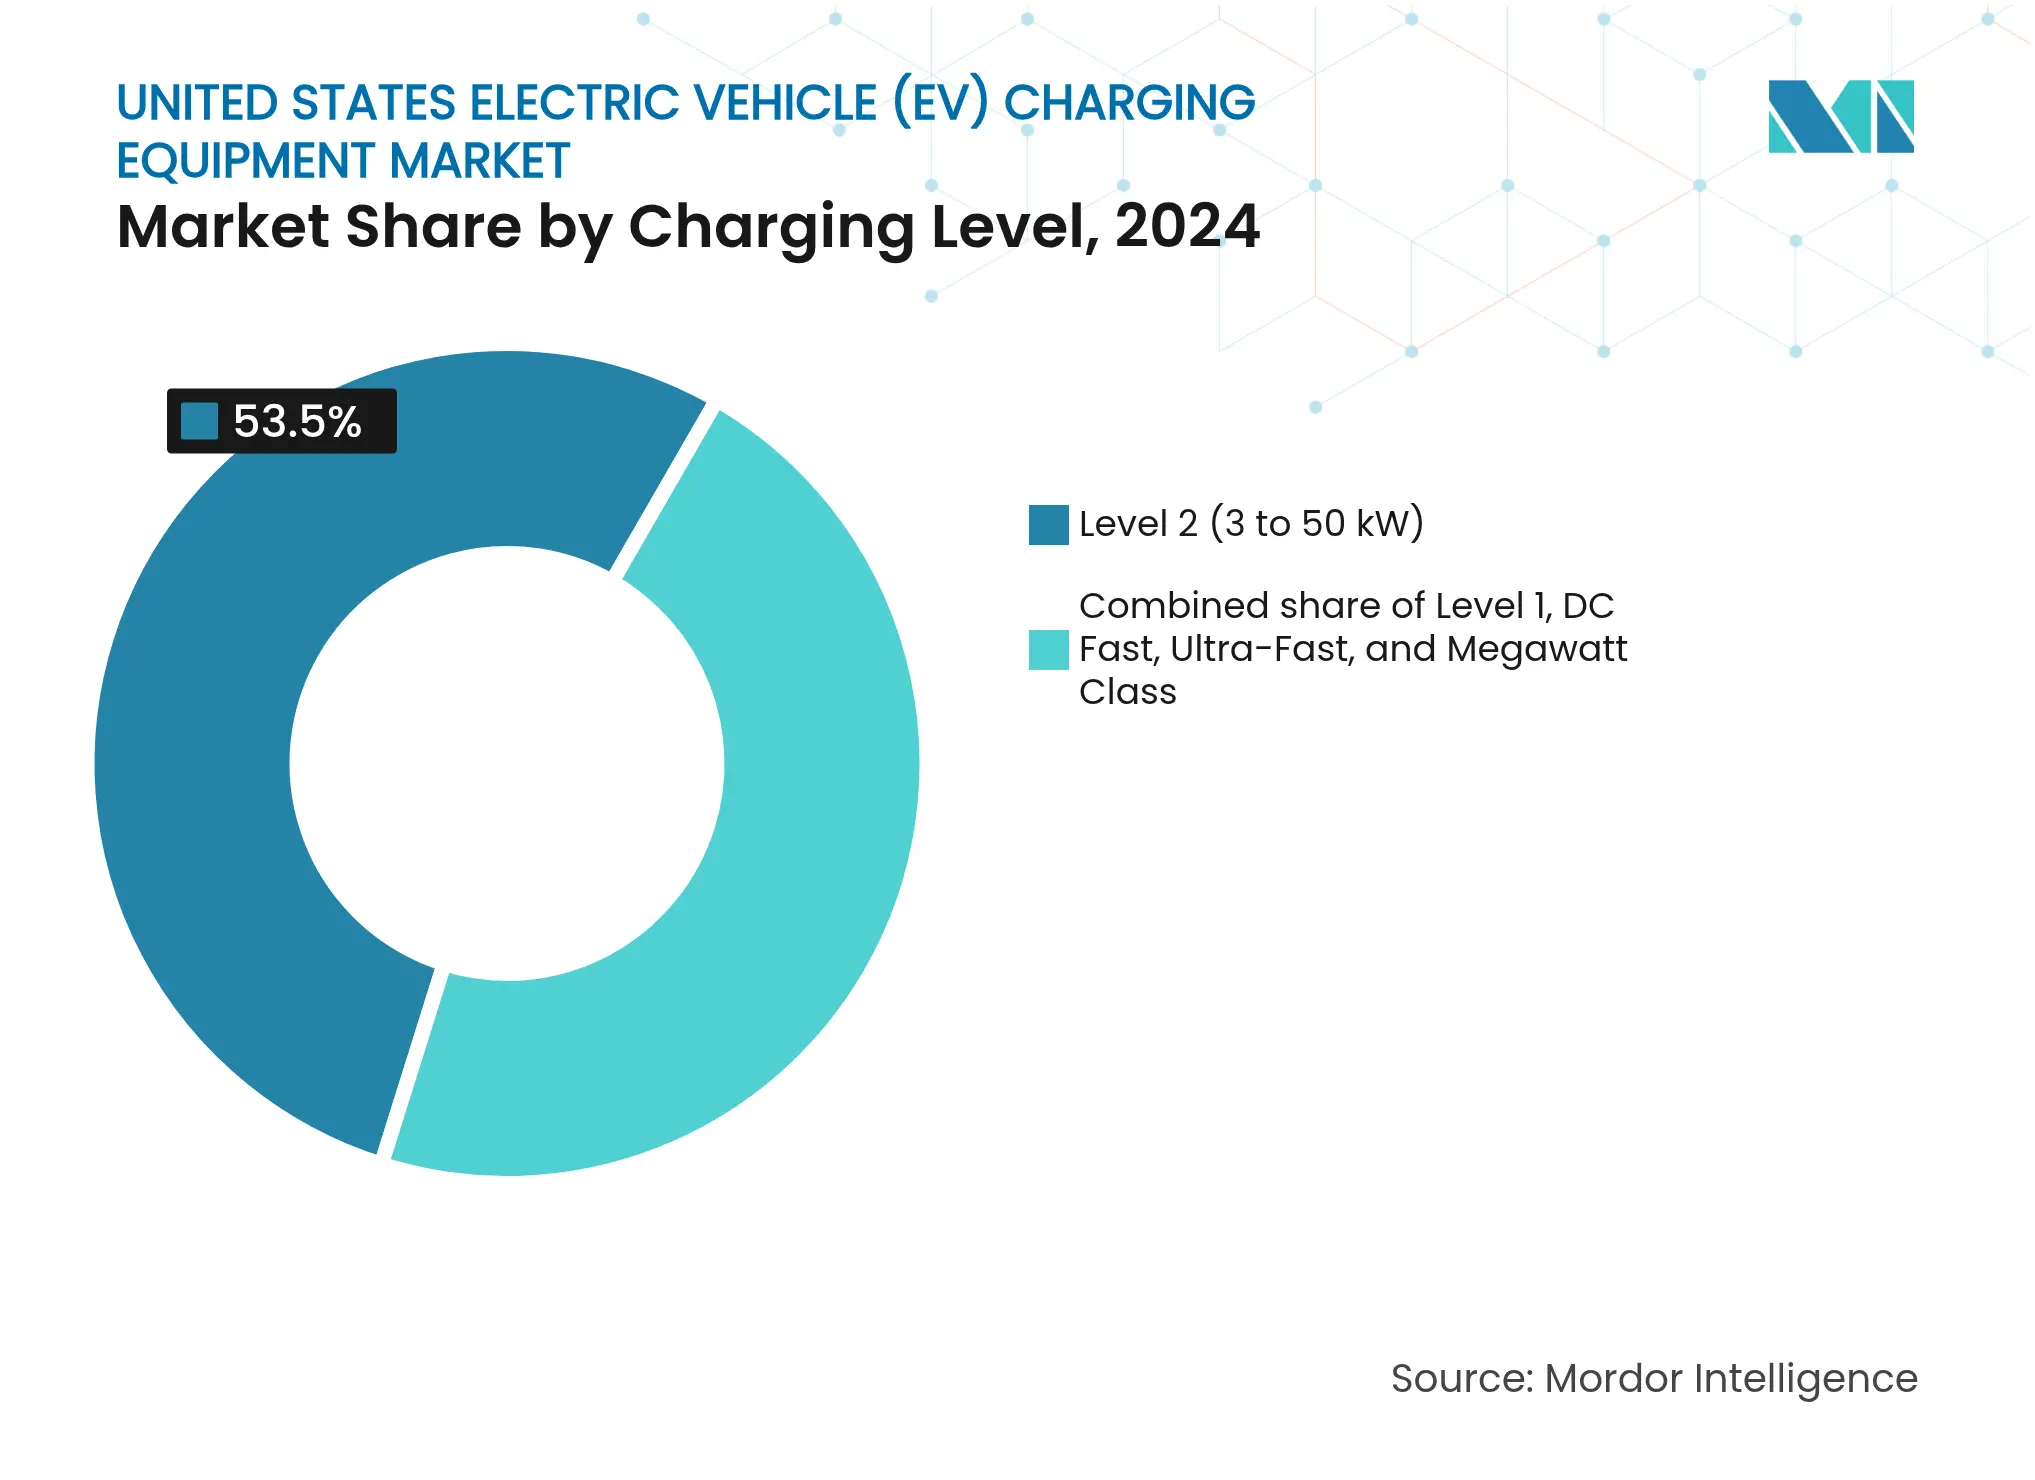
Level 2 equipment captured 53.5% of the US EV charging equipment market share in 2024, driven by residential and workplace dwell times that align with 25–40 miles of range per hour. Megawatt systems, however, are projected to grow at a 25.5% CAGR as Class 8 trucks enter service, creating a USD 920 million revenue pool by 2030. The US EV charging equipment market size for megawatt-class chargers is expected to reach USD 650 million by 2030, reflecting accelerated depot electrification among logistics carriers. ABB’s Terra 360 allows modular upgrades from 50 kW to 360 kW, reducing stranded-asset risk. ChargePoint’s Express Plus and Kempower’s satellite architectures minimize capex per port, while Tritium’s liquid-cooled dispensers cut footprint by 40%, opening urban brownfield sites. Utility-grade switchgear, thermal management, and higher transformer capacity raise upfront cost but triple throughput, boosting revenue per square foot.
The rise of megawatt charging aligns with stricter emissions timelines for drayage fleets at the Ports of Los Angeles and Long Beach and CARB’s Advanced Clean Fleets mandate. Tesla’s Interstate 5 Semi corridor demonstrates 1-MW stalls that add 400 miles in under 30 minutes. International Electrotechnical Commission 62196 and SAE J3400 ensure US–Canada cross-border compatibility, essential for freight operators. Modular hardware also fits phased utility upgrades, allowing depots to start at 500 kW aggregate demand and scale to multi-megawatt feeds without civils rework. These features collectively reinforce the US EV charging equipment market growth momentum in the heavy-duty segment.(3)Los Angeles World Airports, “LAX Electrification Plan,” lawa.org
Note: Segment shares of all individual segments available upon report purchase
By Installation Site: Transportation Hubs Capture Logistics Shift
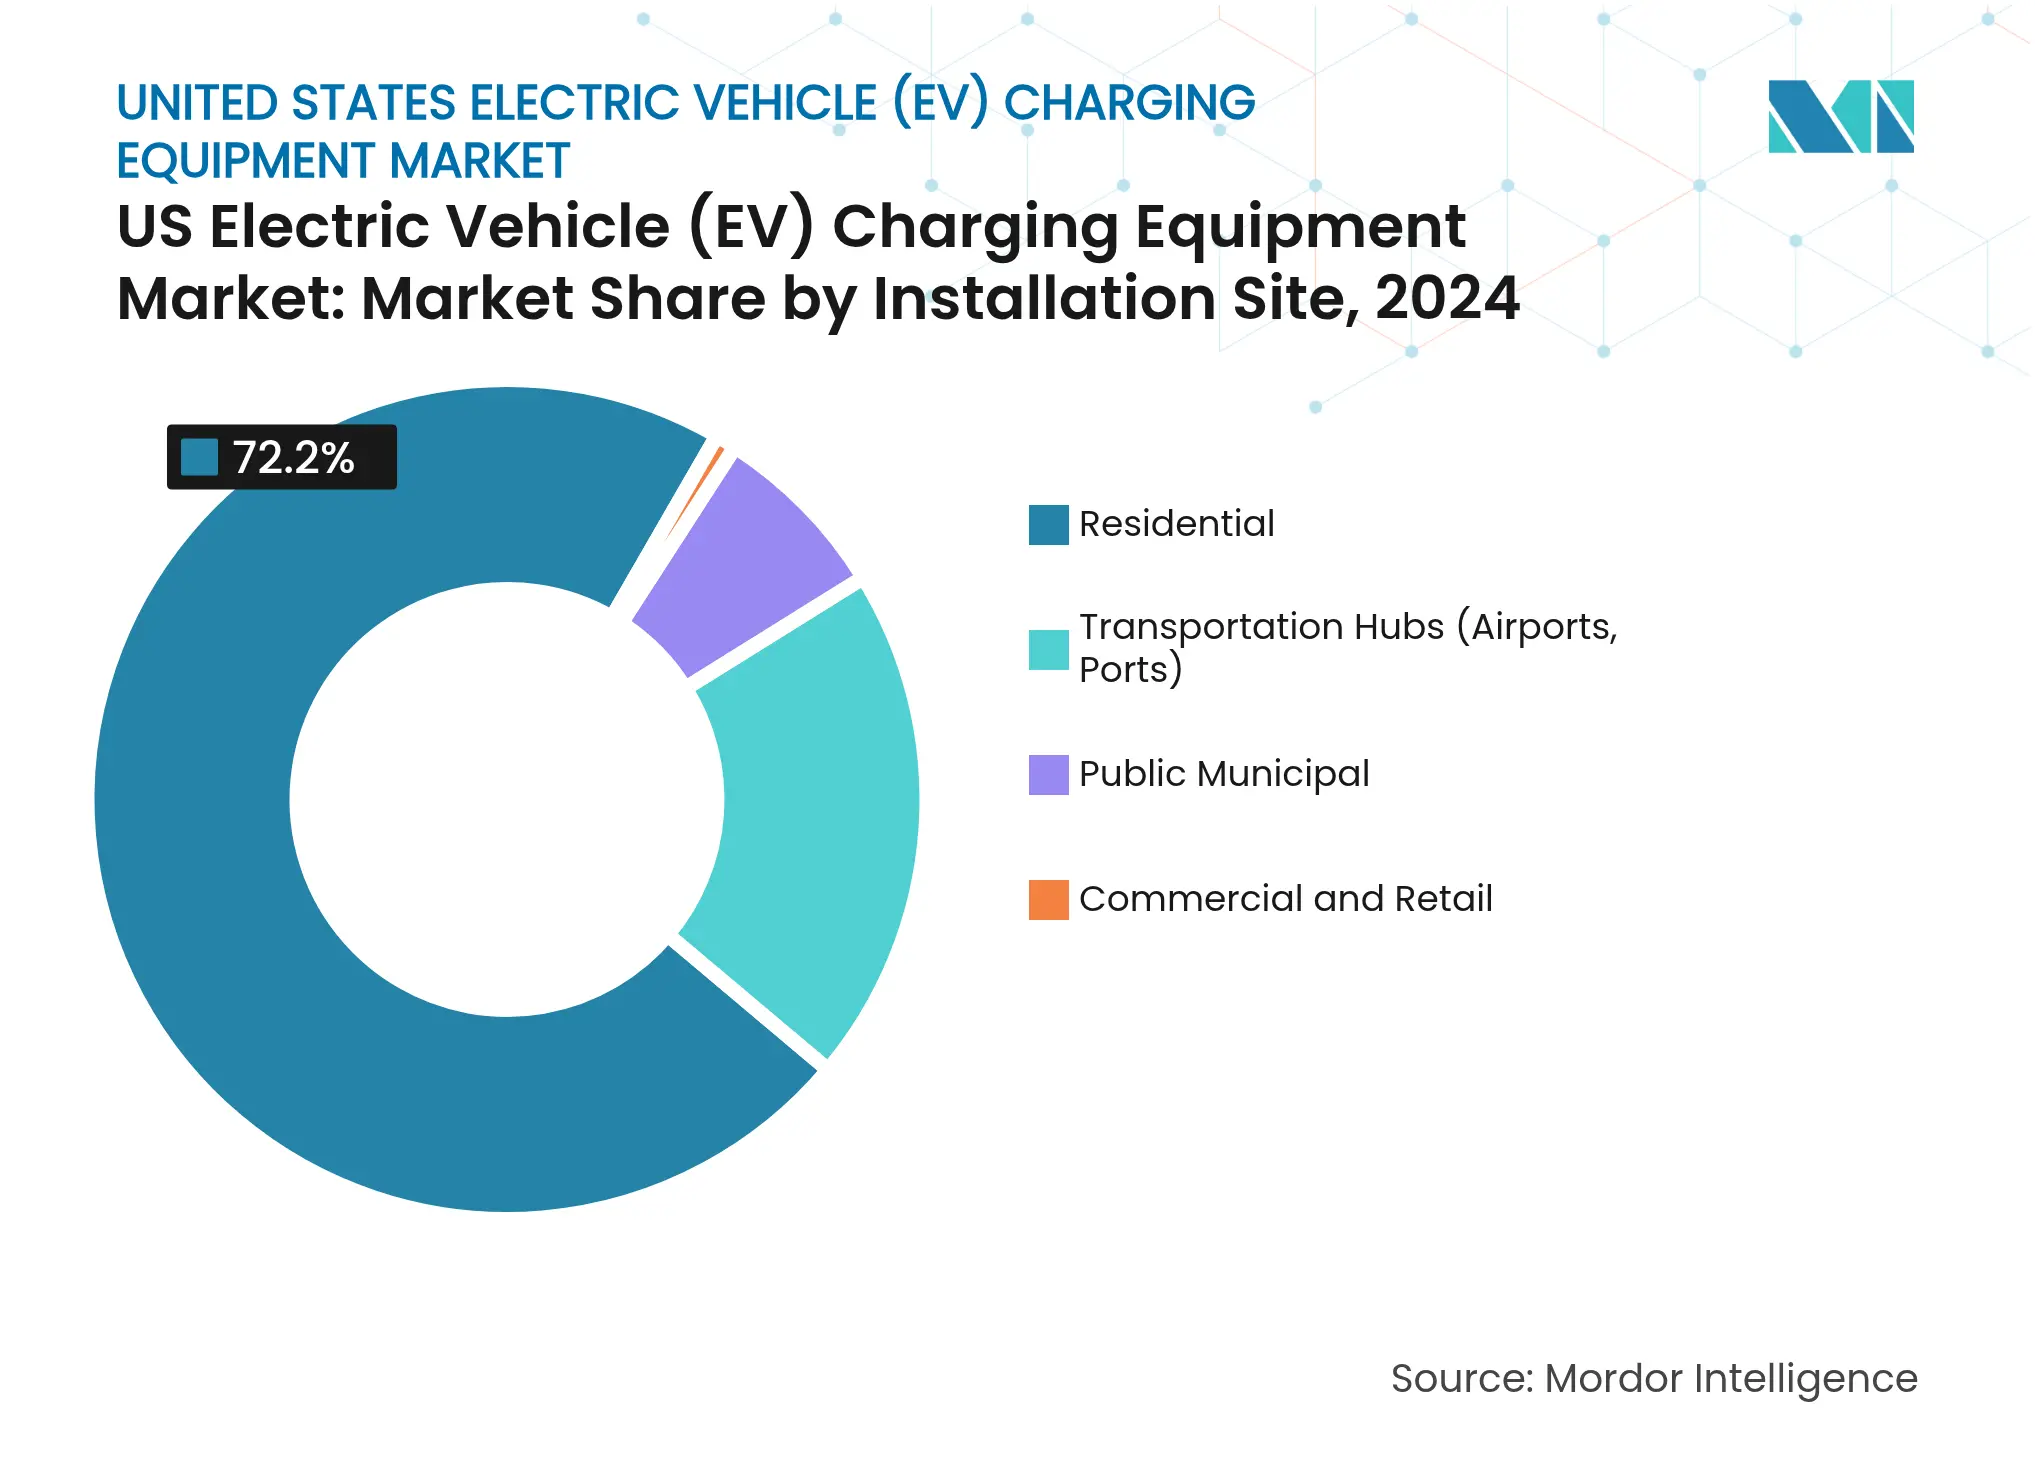
Residential properties represented 72.2% of the US EV charging equipment market size in 2024, with single-family homes enjoying panel capacity and driveway parking. Transportation hubs are forecast to post a 30.2% CAGR through 2030, spurred by zero-emission ground-support mandates at airports and ports. Los Angeles International Airport installed over 1,000 ports under a USD 200 million plan, while the Port of Los Angeles targets 1,500 stalls for 16,000 drayage trucks. John F. Kennedy International Airport contracted 550 chargers for ride-hail fleets, broadening urban access.
Commercial retailers leverage dwell-time monetization, with Walmart operating 1,300 fast chargers at 280 stores nationwide. Public municipal programs fill multi-family housing gaps; New York City’s curbside pilot installed 1,000 Level 2 posts by mid-2024. Fleet depots exploit off-peak tariffs, installing 20–50 ports per site with ChargePoint Fleet software orchestrating load to stay under demand-charge thresholds. The diversity of site archetypes cements the US EV charging equipment market as a multi-channel opportunity rather than a single-format rollout.
Note: Segment shares of all individual segments available upon report purchase
By Application: Fleet Depots Outpace Home-Charging Growth
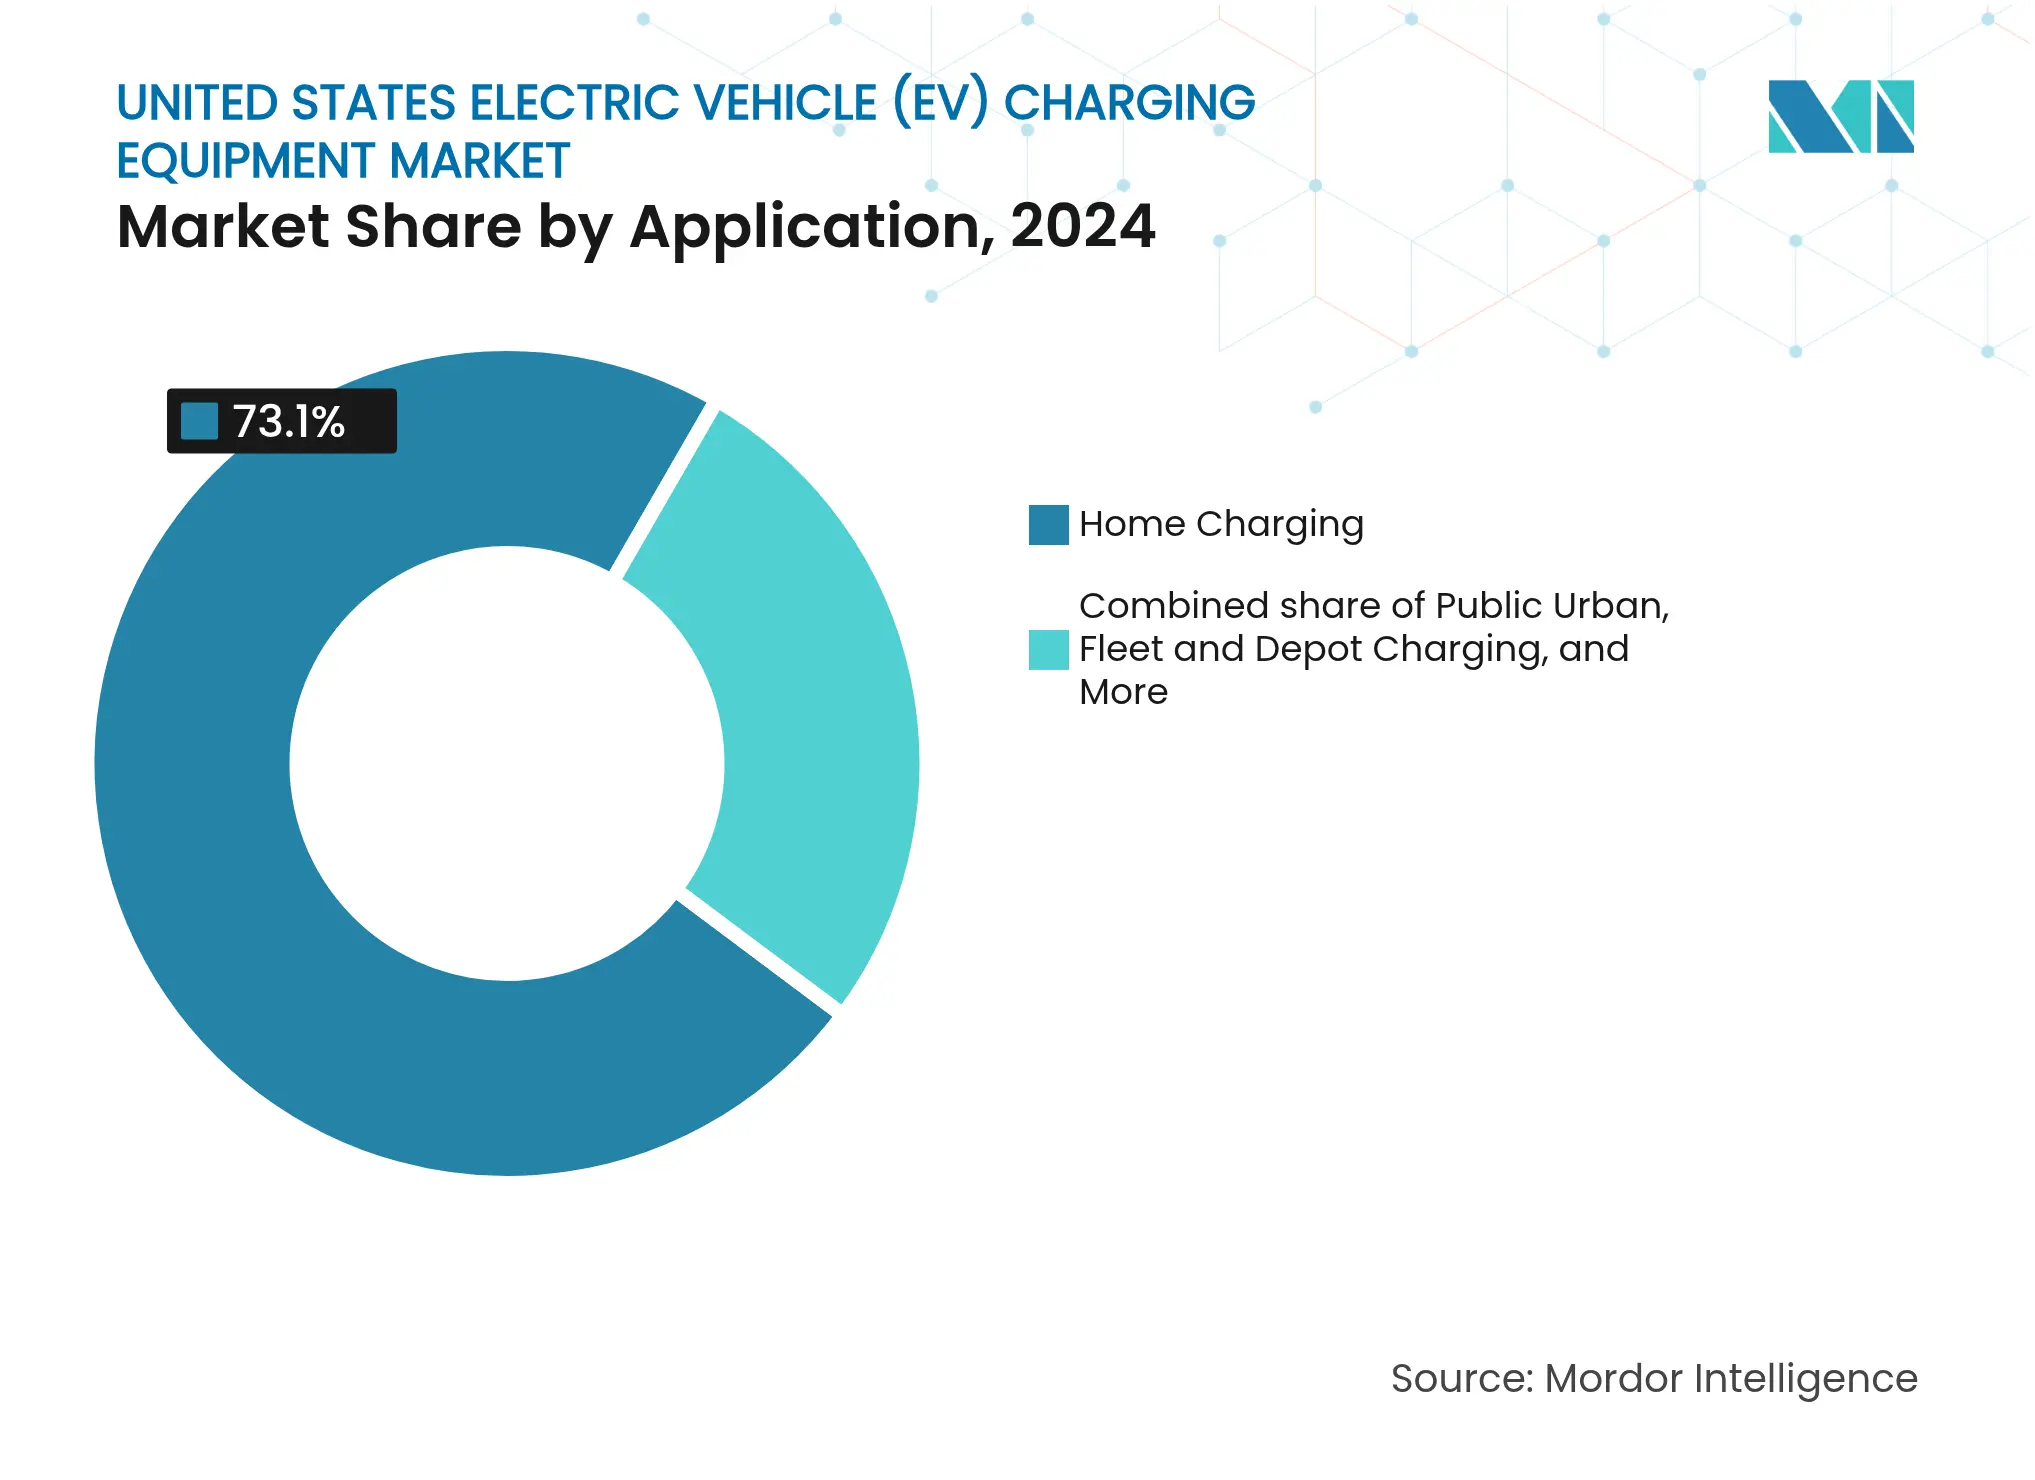
Home charging delivered 73.1% of 2024 demand, but fleet depots are forecast to grow at 35.8% CAGR, outstripping every other use case. The US EV charging equipment market size attributed to home garages remains dominant in unit terms, yet depot and public fast charging capture higher revenue per port. Operating costs for electric vans average USD 0.15 per mile against diesel at USD 0.30 per mile, pushing corporate fleets to electrify.
Workplace charging appears at 38% of Fortune 500 campuses, reinforcing employee retention goals. Public urban networks face 15%–25% utilization, requiring cross-subsidy from highways and fleets, while the US EV charging equipment industry invests in dynamic pricing to improve asset turnover. Highway corridors remain a strategic backbone, especially along Interstates 5, 10, and 95, where Tesla and Electrify America dominate. USPS’s nationwide rollout of 165,000 electric vans demands depot power upgrades at 400 mail-processing facilities, injecting long-tail volume into the equipment pipeline.
Note: Segment shares of all individual segments available upon report purchase
California accounted for 35% of installed public ports in 2024, underpinned by a 22% EV sales share and USD 1 billion in utility make-ready programs. The state’s aggressive incentives and building codes expedite residential uptake, reinforcing leadership in the US EV charging equipment market. Texas followed, leveraging ERCOT’s deregulated wholesale market to let charging operators capture ancillary-service revenue, and prioritizing freight corridors critical to Interstate commerce. The Northeast corridor, buoyed by RGGI auction proceeds, supports Charge NY and New Jersey’s It Pay$ to Plug In rebate, expanding Level 2 density in densely populated zones.
The Pacific Northwest enjoys sub-USD 0.10 per kWh hydroelectric power, fostering 18% EV penetration and rapid Level 2 adoption in Seattle-Portland corridors. Florida’s tourism belt anchors fast chargers along Interstate 95 and Interstate 75, with Miami, Orlando, and Tampa representing the highest utilization outside California. The Midwest lags at 3%–5% EV share despite automotive manufacturing centers, although Ford and GM investments in Michigan are expected to galvanize regional demand post-2025. Rural Mountain West corridors remain dependent on NEVI funds, whose pause now threatens coverage targets.
Overall, coastal states contribute 70% of total deployments, but interior corridors are vital for nationwide range confidence. Utilities in these regions face transformer shortages, emphasizing the need for battery buffering. Consequently, geographic disparities will persist until transformer capacity expands and alternative financing fills the NEVI gap, yet the US EV charging equipment market continues to track double-digit growth nationally.(4)Electric Reliability Council of Texas, “Ancillary Services Pilot,” ercot.com

Reports are available across multiple geographies.
Gain in-depth market insights across regions to support informed decisions.
Market Concentration

Tesla controlled around 60% of public DC fast-charging ports through its Supercharger network in 2024, underscoring significant scale advantages. ChargePoint leads Level 2 with 30,000 networked ports, monetizing software subscriptions rather than session fees, while EVgo partners with General Motors and Kroger for high-traffic urban sites. European suppliers ABB, Siemens, and Schneider Electric differentiate via grid-interactive and vehicle-to-grid capabilities that utilities increasingly pilot for virtual power plants.
Smaller manufacturers such as Kempower, BTC Power, and Noodoe focus on modular, software-defined designs, allowing remote diagnostics to cut truck-roll maintenance by 30%. Wallbox and Enphase integrate solar-plus-storage for homeowners, expanding recurring software revenue. Patent filings hit 1,247 in 2024, with ABB, Siemens, and Tesla leading in thermal management and power electronics.
The NEVI pause favors networks with balance-sheet strength; EVgo secured a USD 1.05 billion DOE loan in November 2024, while Blink expanded via acquisitions in the Southeast. Tesla’s NACS openness erodes connector exclusivity, pushing rivals toward amenities, dynamic pricing, and demand-charge mitigation. Overall competitive dynamics reflect moderate concentration, yet technology convergence and utility partnerships continue to reshape leadership positions within the US EV charging equipment market.

*Disclaimer: Major Players sorted in no particular order
1. Introduction
2. Research Methodology
3. Executive Summary
4. Market Landscape
5. Market Size & Growth Forecasts
6. Competitive Landscape
7. Market Opportunities & Future Outlook
Electric vehicle (EV) charging equipment refers to the infrastructure used to charge electric vehicles. The EV charging equipment plays a crucial role in the widespread adoption of electric vehicles. The availability of robust EV charging infrastructure is essential for overcoming range anxiety, a primary concern for potential EV buyers. It helps in reducing carbon emissions and improving air quality.
The United States electric vehicle charging equipment market is segmented by charging level, installation site, and application. By charging level, the market is segmented into level 1, level 2, DC fast, ultra-fast, and megawatt-class. By installation site, the market is segmented by residential, commercial and retail, public municipal, and transportation hubs. By application, the market is segmented into home, workplace, public urban, highway corridor, fleet, and depot charging. For each segment, the market sizing and forecasts have been provided based on value (USD).
Unlocking Market Potential for Solid-State Transformers
3 Min Read
When decisions matter, industry leaders turn to our analysts. Let’s talk.