
Market Overview
| Study Period | 2019 - 2031 |
|---|---|
| Forecast Data Period | 2026 - 2031 |
| Base Year Market Size (2025) | USD 15.5 Billion |
| Market Size (2026) | USD 15.69 Billion |
| Market Size (2031) | USD 16.66 Billion |
| Growth Rate (2026 - 2031) | 1.21 % |
| Market Concentration | Medium |
Major Players *Disclaimer: Major Players sorted in no particular order Image © Mordor Intelligence. Reuse requires attribution under CC BY 4.0. | |
US Business Jet Market Analysis by Mordor Intelligence
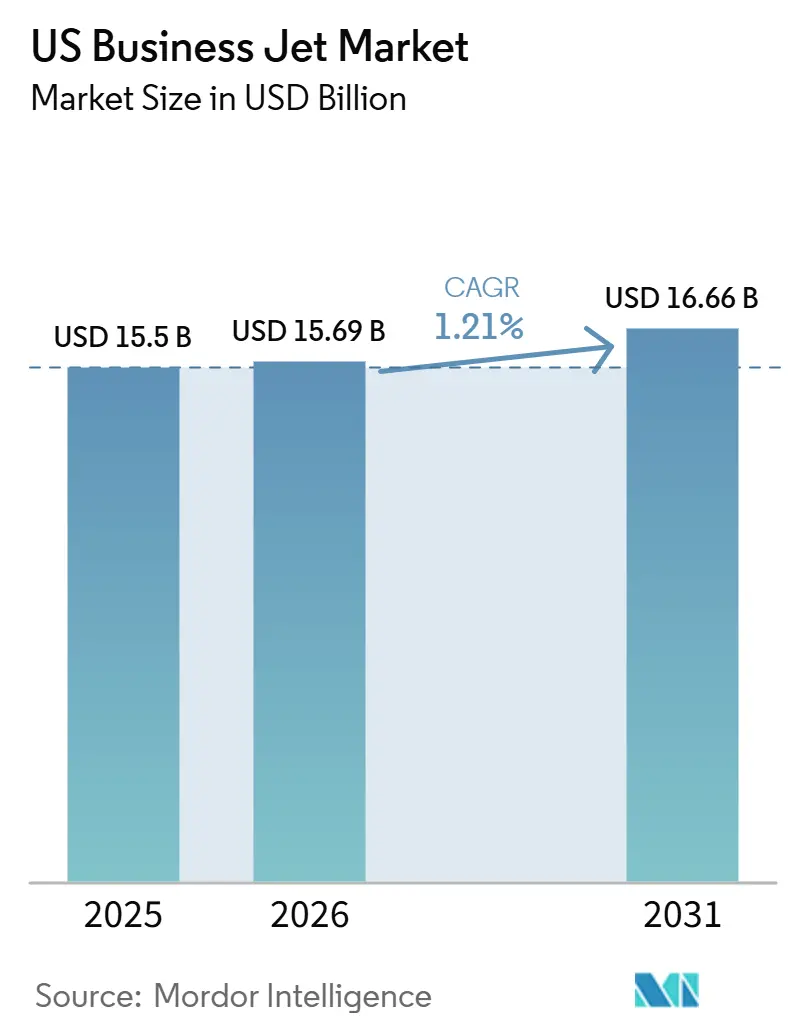
The US business jet market size was valued at USD 15.50 billion in 2025 and estimated to grow from USD 15.69 billion in 2026 to reach USD 16.66 billion by 2031, at a CAGR of 1.21% during the forecast period (2026-2031). Stable growth among high-net-worth individuals, persistent corporate demand for time-sensitive travel, and a structural shift toward fractional ownership continue to keep the US business jet market on a steady, albeit modest, trajectory. At the same time, supply chain bottlenecks, labor shortages, and escalating operating costs temper order momentum even as tax incentives briefly lift near-term deliveries. Manufacturers counter these pressures by introducing SAF-ready models, cabin connectivity packages, and extensive service networks to differentiate their offerings amid an increasingly value-focused buyer base. Environmental scrutiny, rising insurance premiums, and longer lead times collectively restrain fleet expansion; yet, the extensive US airport network and sustained capital-market liquidity underpin the sector’s long-term prospects.
Key Report Takeaways
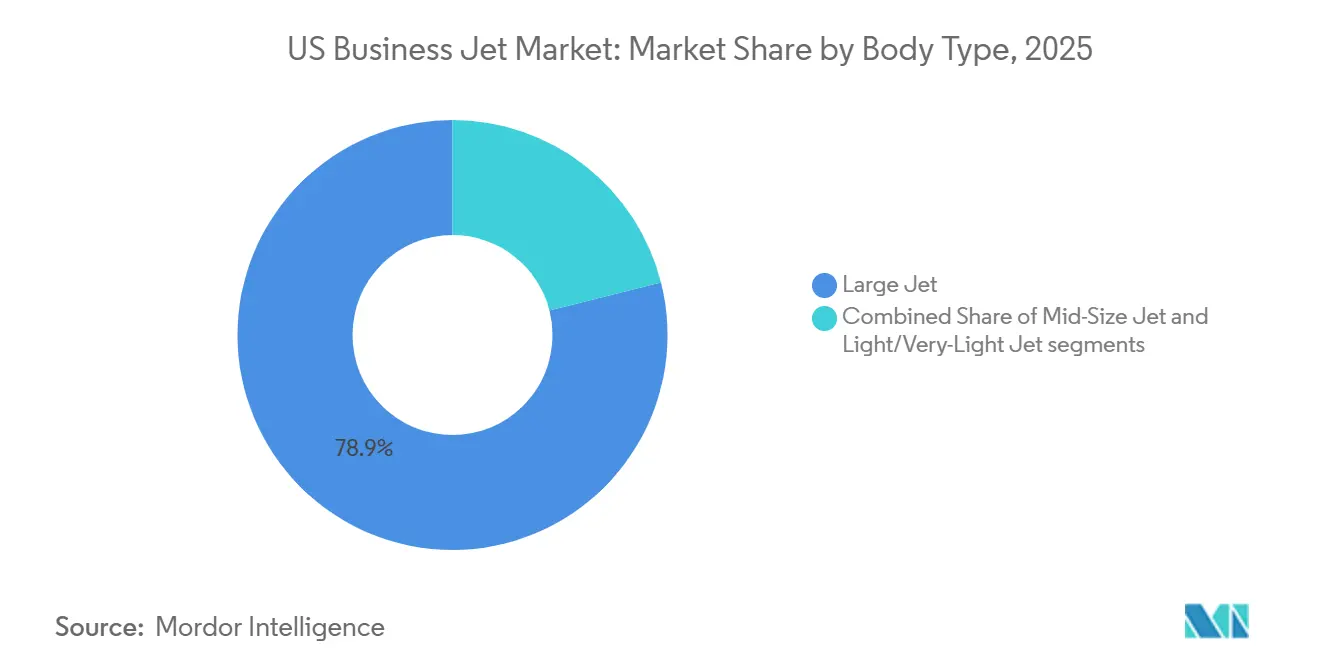
- By body type, large jets held 78.92% of the US business jet market share in 2025, while mid-size jets are forecast to witness the highest growth at a 2.11% CAGR through 2031.
- By end user, individual owners accounted for 43.56% of the US business jet market size in 2025; charter and air-taxi operators are forecast to advance at a 2.87% CAGR through 2031.
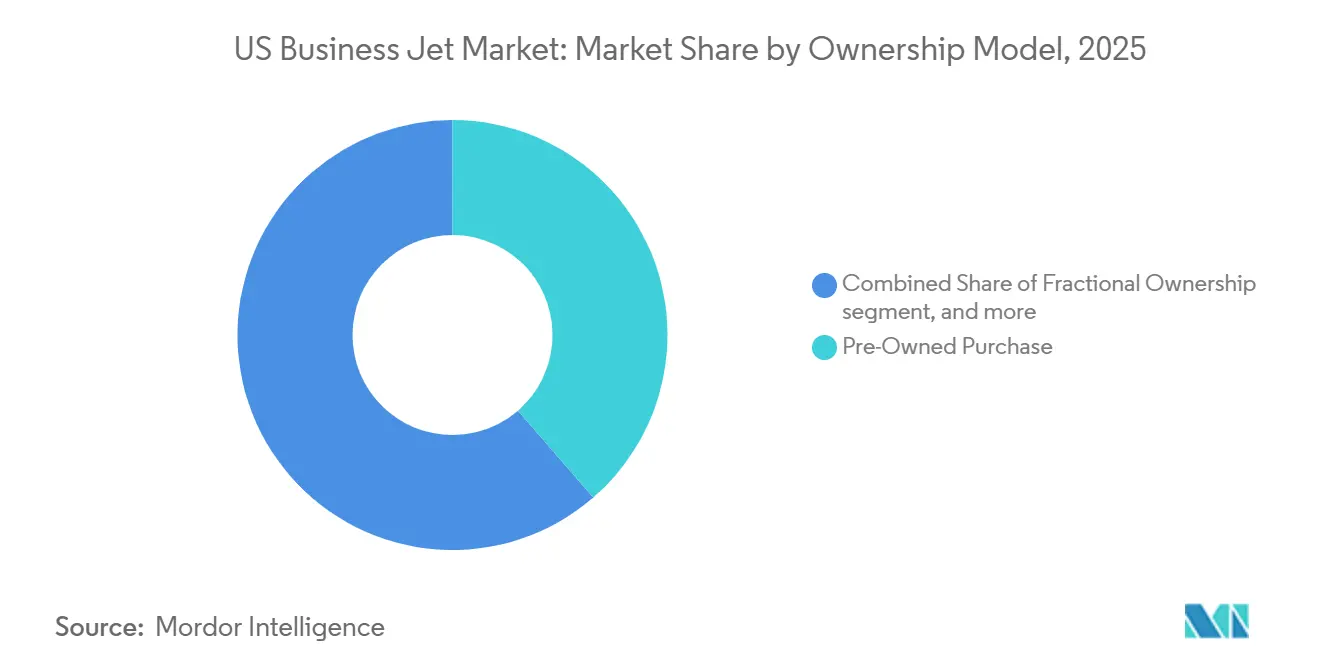
- By ownership model, pre-owned purchases accounted for 38.65% of the US business jet market in 2025, whereas fractional shares are forecast to grow at a 2.74% CAGR through 2031.
Note: Market size and forecast figures in this report are generated using Mordor Intelligence’s proprietary estimation framework, updated with the latest available data and insights as of 2026.
US Business Jet Market Trends and Insights
Drivers Impact Analysis*
| Driver | (~) % Impact on CAGR Forecast | Geographic Relevance | Impact Timeline |
|---|---|---|---|
| Growth in HNWI and UHNWI population | +0.30% | National, with the strongest concentration in California, New York, Texas, and Florida | Short term (≤ 2 years) |
| Rising corporate demand for flexible and time-sensitive air travel | +0.25% | National, with early momentum across business corridors in the Northeast and West Coast | Medium term (2–4 years) |
| Launch of new aircraft models with SAF readiness and advanced cabin technologies | +0.20% | National, with spillover benefits for transpacific routes from West Coast hubs | Medium term (2–4 years) |
| Tax benefits from 100% bonus depreciation under the Build Back Better Act | +0.15% | National | Short term (≤ 2 years) |
| Increasing adoption of fractional ownership programs to maximize fleet utilization | +0.15% | National, with the Midwest serving as a key fractional fleet positioning hub | Long term (≥ 4 years) |
| Growing focus on sustainability-linked procurement by publicly traded companies | +0.10% | National, with early adoption among California-regulated fleets | Long term (≥ 4 years) |
| Source: Mordor Intelligence | |||
Growth in High-Net-Worth Individual Population Drives Premium Demand
Knight Frank’s 2024 Wealth Report measured a more than 7.0% rise in US ultra-high-net-worth individuals- those with assets above USD 30 million-with marked concentration in California and Texas.[1]Knight Frank Research Team, “The Wealth Report 2024,” Knight Frank, knightfrank.com This wealth expansion fortifies demand for large-cabin aircraft that routinely link the coasts and reach Europe nonstop, allowing executives to pair complex itineraries with minimal fuel stops. Cabin volume advantages, low ambient noise, and bespoke interiors position flagship models such as the Gulfstream G700 and Bombardier Global 7500 at the apex of purchasing lists, even as operating budgets tighten. Manufacturers prioritize cabin personalization, range extensions, and enhanced ground-to-air connectivity to convert prospective clients before tax incentives sunset. UHNWIs often deploy aircraft as business tools and lifestyle assets; their purchasing cadence remains relatively insulated from broader economic swings, supporting baseline stability in the US business jet market.
Corporate Travel Flexibility Reshapes Procurement Strategies
Fortune 500 companies reported 23% higher private aviation usage in 2024 than pre-pandemic levels, driven by pharmaceutical and technology firms that must move teams swiftly among R&D centers. Management treats point-to-point jet access as critical infrastructure rather than a discretionary luxury, reframing board-level capital allocation debates. On-demand scheduling, guaranteed cabin hygiene protocols, and the avoidance of commercial disruptions help justify ownership, charter, or share commitments despite general cost inflation. Procurement teams increasingly favor mid-size platforms that blend regional range with lower variable costs, while retaining at least one large-cabin aircraft for transcontinental missions. This functional segmentation prompts operators to maintain mixed fleets or partner with fractional providers that can ensure appropriate lift across various mission sets. Digital flight-scheduling tools integrate with corporate travel-management systems to reinforce data-driven ROI analyses, further institutionalizing business aviation within enterprise logistics planning.
Advanced Aircraft Technologies Command Premium Pricing
Next-generation airframes debuting between 2024 and 2025 will embed fly-by-wire, predictive maintenance analytics, and SAF-ready propulsion packages, collectively reducing the direct operating cost per hour by up to 15% compared to prior variants.[2]Gulfstream Aerospace Technical Communications, “G700 Ultra-Long-Range Business Jet,” Gulfstream, gulfstream.com Abundant USB-C ports, high-bandwidth Ka-band satellite links, and cabin app-based climate controls elevate passenger productivity metrics, allowing CFOs to quantify employee billable-hour recapture. Upfront list prices nonetheless edge higher, compelling OEM financing arms to expand lease-back and pay-by-the-hour support programs that mitigate sticker shock. For operators, tech-laden jets reduce maintenance downtime through prognostic health tracking, which dispatches parts before AOG events. Early adopters leverage these savings to offset inflation in fuel and insurance, reinforcing a virtuous cycle that accelerates fleet renewal and underpins the US business jet market.
Tax Depreciation Benefits Accelerate Acquisition Timelines
The Build Back Better Act grants 100% bonus depreciation on new business aircraft placed in service through 2026, enabling firms with sizable tax liabilities to expense the entire purchase in the first year. Treasury and finance teams fast-track acquisition approvals, sometimes superseding operational sequencing, to capture immediate cash-flow relief. OEM orderbooks swell as a result, yet extended supply chain lead times impose delivery slots that may outlast the incentive window. Some buyers hedge timing risk by converting to purchase agreements for available pre-owned aircraft or by entering fractional programs that allow pro rata depreciation on shared assets. Once the allowance drops to 80% in 2027, pent-up demand may soften, amplifying the importance of manufacturers in diversifying their after-sales revenue streams through service contracts and avionics upgrades.
Restraints Impact Analysis*
| Restraint | (~) % Impact on CAGR Forecast | Geographic Relevance | Impact Timeline |
|---|---|---|---|
| High capital and operational costs associated with business jet ownership | –0.3% | National; high-cost metros | Short term (≤2 years) |
| Persistent supply chain disruptions and skilled labor shortages in aviation | –0.2% | National manufacturing hubs | Medium term (2-4 years) |
| Rising regulatory scrutiny and public activism against private jet usage | –0.1% | National; advocacy regions | Long term (≥4 years) |
| Financial instability and liquidity risks among charter operators | –0.1% | National; competitive markets | Short term (≤2 years) |
| Source: Mordor Intelligence | |||
Escalating Ownership Costs Pressure Market Accessibility
Total annual ownership expense for a mid-size jet climbed to USD 3.2 million in 2024, an 18% surge from 2019 as fuel volatility, insurance hikes, and wage inflation converge.[3]Aircraft Cost Calculator Editors, “2024 Operating Cost Analysis,” Aircraft Cost Calculator, aircraftcostcalculator.com Insurance premiums increased by 25% annually amid tighter underwriting linked to recent incident trends, thereby elevating barriers for smaller corporations. Hangar leases in New York and Los Angeles now exceed USD 15,000 per month for large-cabin airframes, while Part 135 pilot salaries have risen 12% as airlines have tapped the same labor pool. Without economies of scale, single-aircraft owners must either absorb higher fixed costs or migrate to fractional or charter solutions. These cost dynamics narrow the addressable market for first-time buyers and curb growth in the US business jet market.
Supply Chain Constraints Extend Delivery Timelines
Post-pandemic raw material shortages and avionics backlogs lengthen new-jet delivery queues by 12–18 months, compelling OEMs to prioritize high-margin models. Meanwhile, the FAA projects a deficit of 15,000 certified Airframe and Powerplant technicians by 2030, exacerbating maintenance capacity pinch points that drive up labor rates. Operators face prolonged downtimes during scheduled inspections when parts arrive late or MRO slots are unavailable, eroding utilization and revenue potential. The ripple effects cascade into the pre-owned market, where well-maintained aircraft command premiums and close quickly. Until supply chain normalization appears, delivery uncertainty remains a structural headwind for fleet planners and dampens the near-term growth potential of the US business jet market.
*Our forecasts treat driver/restraint impacts as directional, not additive. The impact forecasts reflect baseline growth, mix effects, and variable interactions.
Segment Analysis
By Body Type: Large Jets Maintain Dominance While Mid-Size Platforms Accelerate
Large jets accounted for 78.92% of the US business jet market share in 2025, driven by their 7,000-plus nautical-mile range, full-stand-up cabins, and robust resale values, resulting in consistent residual-value retention curves. Heavy airframes enable nonstop links among countries, allowing corporate schedulers to consolidate routes and minimize positioning legs. This endurance is paired with low 50-cycle maintenance intervals and advanced environmental control systems that meet heightened wellness protocols.
Mid-size aircraft nonetheless deliver the segment’s fastest 2.11% CAGR through 2031, as platforms such as the Citation Longitude and Embraer Praetor 600 bridge transcontinental gaps at 20–30% lower hourly costs than large-cabin peers. Cabin heights above 6 ft, flat floors, and digital flight decks refute earlier perceptions of cramped interiors or limited avionics capability. For charter brokers, mid-size jets often hit optimal price-comfort equilibria in the 3–4-hour stage length, broadening client appeal. The resulting dual-tier demand pattern underpins steady value growth, balancing the overall risk profile of the US business jet market within this segmentation.



By End User: Individual Owners Dominate Despite Charter Growth
Full private ownership accounted for 43.56% of the US business jet market in 2025, reflecting deep capital reserves among UHNWIs and large public companies that prize direct scheduling authority. Such owners routinely implement bespoke interior refurbishments and maintain dedicated flight departments to safeguard brand reputation. The dominance endures despite cost pressures because outright owners enjoy bare-bones budgets on their balance sheets, a contingent workforce, maximum operational privacy, and the ability to tailor aircraft availability around dynamic corporate calendars.
Fractional ownership, however, is expanding at a 2.87% CAGR, propelled by NetJets, Flexjet, and more recent entrants that market guaranteed-hour solutions bundled with maintenance, crew, and dispatch services. The model minimizes idle time and predictable, bare-bones propositions that resonate with CFOs steering asset-light strategies on their balance sheet. Charter and air-taxi operators adjust by offering membership tiers and dynamic pricing engines to retain clients who are migrating up the utilization curve. As procurement teams sharpen ROI assessments, the blended ecosystem enhances accessibility without cannibalizing the premium aura that distinguishes the US business jet market.
By Ownership Model: Pre-Owned Transactions Lead, Fractional Shares Signal Structural Shift
Pre-owned acquisitions accounted for 38.65% of the 2025 transaction value, bolstered by faster closing timelines and a ready pool of inventory as fleet owners transitioned to newer models. Buyers sidestep 18-month OEM waits and leverage historically compressed depreciation curves to justify capital outlays. MRO centers report brisk refurbishment activity that tailors avionics and interiors to modern connectivity standards, sustaining high aircraft turnover velocity.
Fractional shares, at a 2.74% CAGR, illustrate a durable commitment to shared-asset economics; providers optimize residual risk through age-based fleet rotation and bulk procurement agreements with OEMs. New aircraft purchases, while vital for technological infusion, lag in share growth due to elevated list prices and delivery uncertainties. Jet-card and membership programs serve as feeder channels, enabling customers to test the utility before committing to a more significant investment. Collectively, ownership-model diversification maintains liquidity channels that are essential to the long-term health of the US business jet market.
Geography Analysis
The US accounted for the most significant number of global business aircraft deliveries in 2025, maintaining its position as the world's leading market. California, Texas, Florida, and New York collectively host the highest registration densities, underscoring correlations among tech wealth, favorable tax codes, and corporate headquarters clustering.
The West Coast is experiencing elevated transpacific traffic, leading to large-jet dominance in the San Jose and Seattle corridors. In contrast, the Southeast capitalizes on lower operating overhead and hospitable tax environments, drawing new maintenance and completions facilities to states such as Georgia and Florida. Midwest hubs utilize their central geography to support fractional-fleet positioning, thereby reducing ferry legs and optimizing crew duty cycles.
State-level incentive packages, including fuel-tax holidays and accelerated depreciation on based aircraft, further reinforce regional competitive advantages. These geographic factors anchor sustained utilization rates, fortifying the US business jet market against shorter-cycle economic swings.
Competitive Landscape
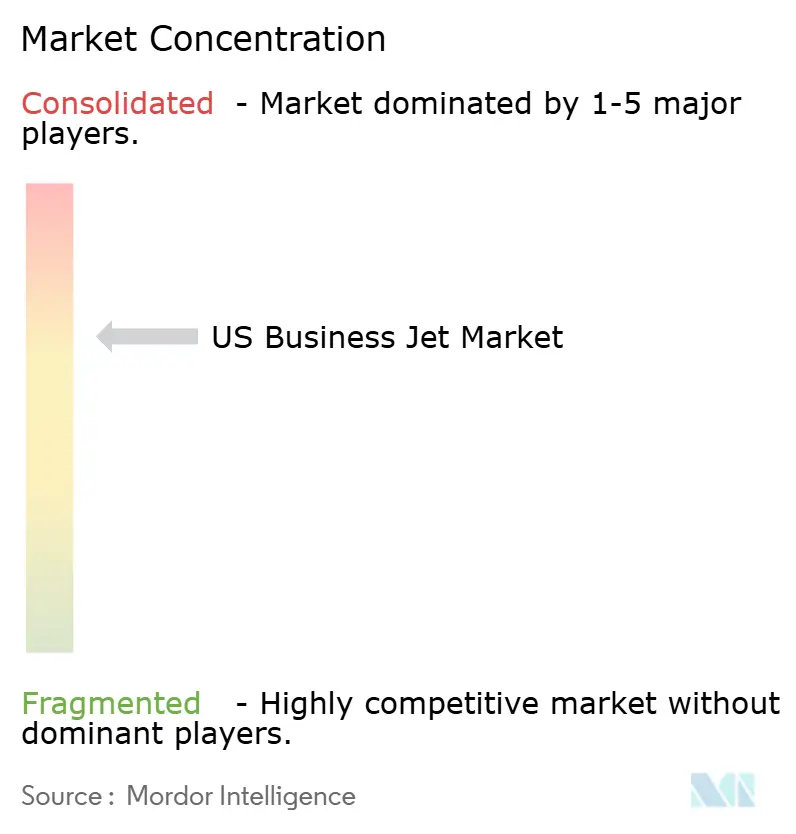
Market concentration remains moderate, with Gulfstream Aerospace Corporation (General Dynamics Corporation), Bombardier Inc., Textron Inc., and Embraer S.A. retaining apparent breadth of product portfolio and after-sales infrastructure that smaller OEMs cannot emulate. Their combined share of annual US deliveries consistently hovers above 60%, a level sufficient to exercise pricing power while still encouraging innovation.
Technology is the current battleground: Gulfstream Aerospace Corporation and Bombardier Inc. allocate significant resources to R&D focused on alternative propulsion, advanced composites, and integrated connectivity suites, aiming to lock in next-cycle loyalty. Concurrently, NetJets and Flexjet leverage fleets exceeding 500 aircraft to negotiate bulk-fuel contracts and deploy predictive-maintenance AI that reduces unscheduled downtime. These scale advantages put pressure on niche charter operators, many of whom are facing liquidity bottlenecks exacerbated by rising debt costs.
White-space opportunities persist around sustainable aviation fuel sourcing, carbon-offset subscription models, and digital booking platforms that compress legacy broker spreads. OEMs increasingly bundle cabin upgrades and emissions-tracking dashboards within maintenance programs, signaling convergence between hardware innovation and service monetization. This interplay between product and platform strategies defines the future competitive dynamics in the US business jet market.
US Business Jet Industry Leaders
Gulfstream Aerospace Corporation (General Dynamics Corporation)
Textron Inc.
Bombardier Inc.
Embraer S.A.
Dassault Aviation SA
- *Disclaimer: Major Players sorted in no particular order

Recent Industry Developments
- June 2026: Flexjet announced the acquisition of London-based aircraft brokerage and advisory firm The Jet Business. The deal expands Flexjet’s capabilities across whole-aircraft sales, procurement, and advisory services. It also brings together Flexjet’s existing FXSolutions brokerage entity and The Jet Business under a single global platform. The business will continue to operate under The Jet Business brand while benefiting from the expanded resources, infrastructure, and global reach of the Flexjet ecosystem.
- September 2025: Otto Aerospace announced Flexjet as the first fleet customer for its Phantom 3500 business jet. The aircraft features laminar-flow aerodynamics and carbon-fiber composites, reducing fuel consumption by over 60%. The agreement includes a firm order for 300 Phantom 3500 jets with additional options. The company plans the first flight in 2027, with deliveries starting in 2030.
- October 2023: Textron Aviation announced that it entered a purchase agreement with Fly Alliance for up to 20 Cessna Citation business jets, with options for 16 additional aircraft. Fly Alliance is expected to use the aircraft for its luxury private jet charter operations.
- June 2023: Gulfstream Aerospace Corporation announced the further expansion of its completions and outfitting operations at St. Louis Downtown Airport. With this latest expansion, Gulfstream is expected to increase completion operations at the site while modernizing its existing spaces by adding new, state-of-the-art equipment and tooling, representing a total capital investment of USD 28.50 million.


US Business Jet Market Report Scope
A business jet is a private aircraft designed for transporting small groups of passengers, typically business executives, high-net-worth individuals, government officials, or specialized mission operators. It offers flexibility, privacy, and time efficiency compared to commercial aviation. The US business jet market encompasses sales, leasing, fractional ownership, and membership-based access to business aircraft across various body types and ownership models. The market includes new aircraft purchases, pre-owned aircraft transactions, fractional ownership programs, and jet card or membership-based services that provide on-demand access to business aviation. It covers aircraft used for corporate transportation, individual private travel, charter and air taxi operations, training and academic purposes, and government or special mission applications across the US.
The US business jet market is segmented by body type, end user, ownership model, and geography. By body type, the market is segmented into large, mid-size, and light/very light jets. By end user, the market is segmented into individual owners, businesses, corporate entities, charter/air taxi operators, training and academic institutions, and government and special-mission operators. By ownership model, the market is segmented into new aircraft purchase, pre-owned purchase, fractional ownership, and jet cards/membership programs. For each segment, the market size is provided in terms of value (USD).
By Body Type
| Large Jet |
| Mid-Size Jet |
| Light/Very-Light Jet |
By End User
| Individual Owners |
| Business and Corporate Entities |
| Charter/Air-Taxi Operators |
| Training and Academic Institutions |
| Government and Special-Mission Operators |
By Ownership Model
| New Aircraft Purchase |
| Pre-Owned Purchase |
| Fractional Ownership |
| Jet Cards/Membership |
| By Body Type | Large Jet |
| Mid-Size Jet | |
| Light/Very-Light Jet | |
| By End User | Individual Owners |
| Business and Corporate Entities | |
| Charter/Air-Taxi Operators | |
| Training and Academic Institutions | |
| Government and Special-Mission Operators | |
| By Ownership Model | New Aircraft Purchase |
| Pre-Owned Purchase | |
| Fractional Ownership | |
| Jet Cards/Membership |


Market Definition
- Aircraft Type - General Aviation includes aircraft used for corporate aviation, business aviation and other aerial works.
- Sub-Aircraft Type - Business Jets which are private jets and are designed to carry small groups of people and are used for various roles are included in this study.
- Body Type - Light Jets, Mid-Size Jets, and Large Jets according to their ability to carry passengers and flying distance ranges have been included under this study.
| Keyword | Definition |
|---|---|
| IATA | IATA stands for the International Air Transport Association, a trade organization composed of airlines around the world that has an influence over the commercial aspects of flight. |
| ICAO | ICAO stands for International Civil Aviation Organization, a specialized agency of the United Nations that supports aviation and navigation around the globe. |
| Air Operator Certificate (AOC) | A certificate granted by a National Aviation Authority permitting the conduct of commercial flying activities. |
| Certificate Of Airworthiness (CoA) | A Certificate Of Airworthiness (CoA) is issued for an aircraft by the civil aviation authority in the state in which the aircraft is registered. |
| Gross Domestic Product (GDP) | Gross domestic product (GDP) is a monetary measure of the market value of all the final goods and services produced in a specific time period by countries. |
| RPK (Revenue Passenger Kilometres) | The RPK of an airline is the sum of the products obtained by multiplying the number of revenue passengers carried on each flight stage by the stage distance - it is the total number of kilometers traveled by all revenue passengers. |
| Load Factor | The load factor is a metric used in the airline industry that measures the percentage of available seating capacity that has been filled with passengers. |
| Original Equipment Manufacturer (OEM) | An original equipment manufacturer (OEM) traditionally is defined as a company whose goods are used as components in the products of another company, which then sells the finished item to users. |
| International Transportation Safety Association (ITSA) | International Transportation Safety Association (ITSA) is an international network of heads of independent safety investigation authorities (SIA). |
| Available Seats Kilometre (ASK) | This metric is calculated by multiplying Available Seats (AS) in one flight, defined above, multiplied by the distance flown. |
| Gross Weight | The fully-loaded weight of an aircraft, also known as “takeoff weight,” which includes the combined weight of passengers, cargo, and fuel. |
| Airworthiness | The ability of an aircraft, or other airborne equipment or system, to operate in flight and on the ground without significant hazard to aircrew, ground crew, passengers or to other third parties. |
| Airworthiness Standards | Detailed and comprehensive design and safety criteria applicable to the category of aeronautical product (aircraft, engine or propeller). |
| Fixed Base Operator (FBO) | A business or organization that operates at an airport. An FBO provides aircraft operating services like maintenance, fueling, flight training, charter services, hangaring, and parking. |
| High Net worth Individuals (HNWIs) | High Net worth Individuals (HNWIs) are individuals with over USD 1 million in liquid financial assets. |
| Ultra High Net worth Individuals (UHNWIs) | Ultra High Net worth Individuals (UHNWIs) are individuals with over USD 30 million in liquid financial assets. |
| Federal Aviation Administration (FAA) | The division of the Department of Transportation is concerned with aviation. It operates Air Traffic Control and regulates everything from aircraft manufacturing to pilot training to airport operations in the United States. |
| EASA (European Aviation Safety Agency) | The European Aviation Safety Agency is a European Union agency established in 2002 with the task of overseeing civil aviation safety and regulation. |
| Airborne Warning and Control System (AW&C) aircraft | Airborne Warning and Control System (AEW&C) aircraft is equipped with a powerful radar and on-board command and control center to direct the armed forces. |
| The North Atlantic Treaty Organization (NATO) | The North Atlantic Treaty Organization (NATO), also called the North Atlantic Alliance, is an intergovernmental military alliance between 30 member states – 28 European and two North American. |
| Joint Strike Fighter (JSF) | Joint Strike Fighter (JSF) is a development and acquisition program intended to replace a wide range of existing fighter, strike, and ground attack aircraft for the United States, the United Kingdom, Italy, Canada, Australia, the Netherlands, Denmark, Norway, and formerly Turkey. |
| Light Combat Aircraft (LCA) | A light combat aircraft (LCA) is a light, multirole jet/turboprop military aircraft, commonly derived from advanced trainer designs, designed for engaging in light combat. |
| Stockholm International Peace Research Institute (SIPRI) | Stockholm International Peace Research Institute (SIPRI) is an international institute that provides data, analysis, and recommendations for armed conflict, military expenditure, and arms trade as well as disarmament and arms control. |
| Maritime Patrol Aircraft (MPA) | A maritime patrol aircraft (MPA), also known as maritime reconnaissance aircraft is a fixed-wing aircraft designed to operate for long durations over water in maritime patrol roles, in particular, anti-submarine warfare (ASW), anti-ship warfare (AShW), and search and rescue (SAR). |
| Mach Number | The Mach number is defined as the ratio of true airspeed to the speed of sound at the altitude of a given aircraft. |
| Stealth Aircraft | Stealth is a Common term applied to low observable (LO) technology and doctrine, that makes an aircraft near invisible to radar, infrared or visual detection. |


Research Methodology
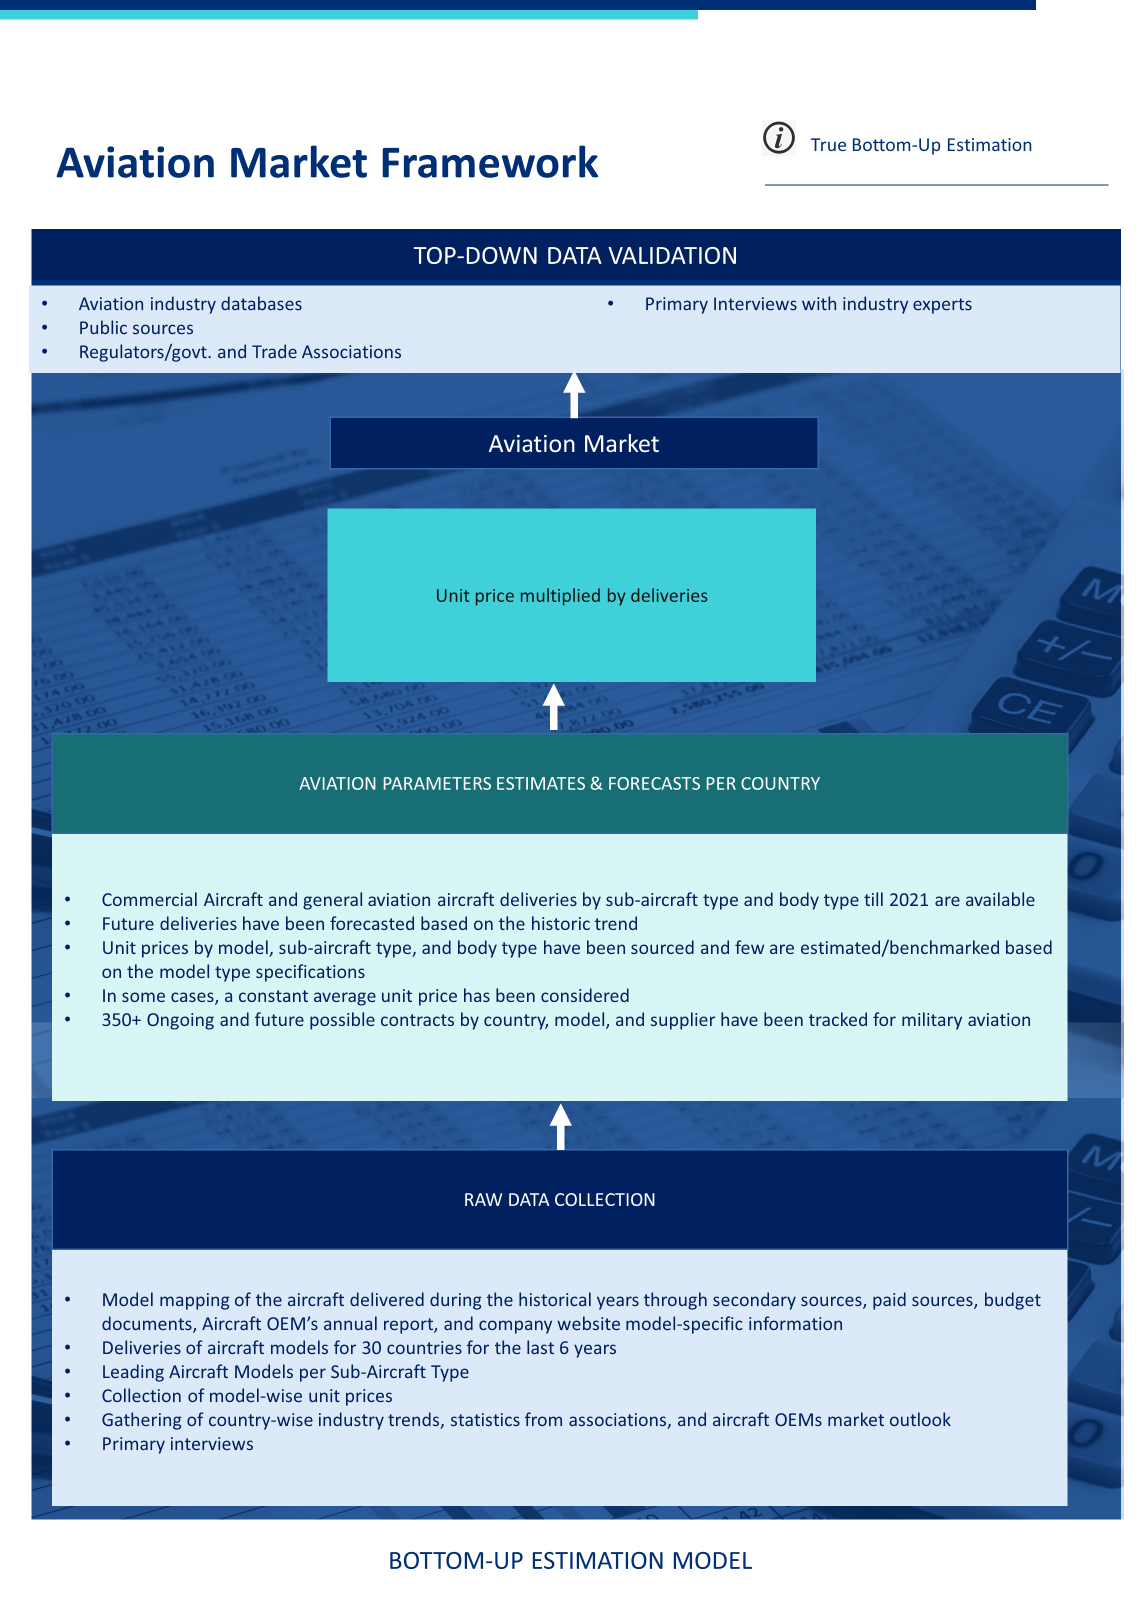
Mordor Intelligence follows a four-step methodology in all our reports.
- Step-1: Identify Key Variables: In order to build a robust forecasting methodology, the variables and factors identified in Step-1 are tested against available historical market numbers. Through an iterative process, the variables required for market forecast are set and the model is built on the basis of these variables.
- Step-2: Build a Market Model: Market-size estimations for the historical and forecast years have been provided in revenue and volume terms. For sales conversion to volume, the average selling price (ASP) is kept constant throughout the forecast period for each country, and inflation is not a part of the pricing.
- Step-3: Validate and Finalize: In this important step, all market numbers, variables and analyst calls are validated through an extensive network of primary research experts from the market studied. The respondents are selected across levels and functions to generate a holistic picture of the market studied.
- Step-4: Research Outputs: Syndicated Reports, Custom Consulting Assignments, Databases & Subscription Platforms





 Your data is secure and never sold or shared.


