Philippines Container Glass Market Size and Share
Market Overview
| Study Period | 2020 - 2031 |
|---|---|
| Base Year For Estimation | 2025 |
| Forecast Data Period | 2026 - 2031 |
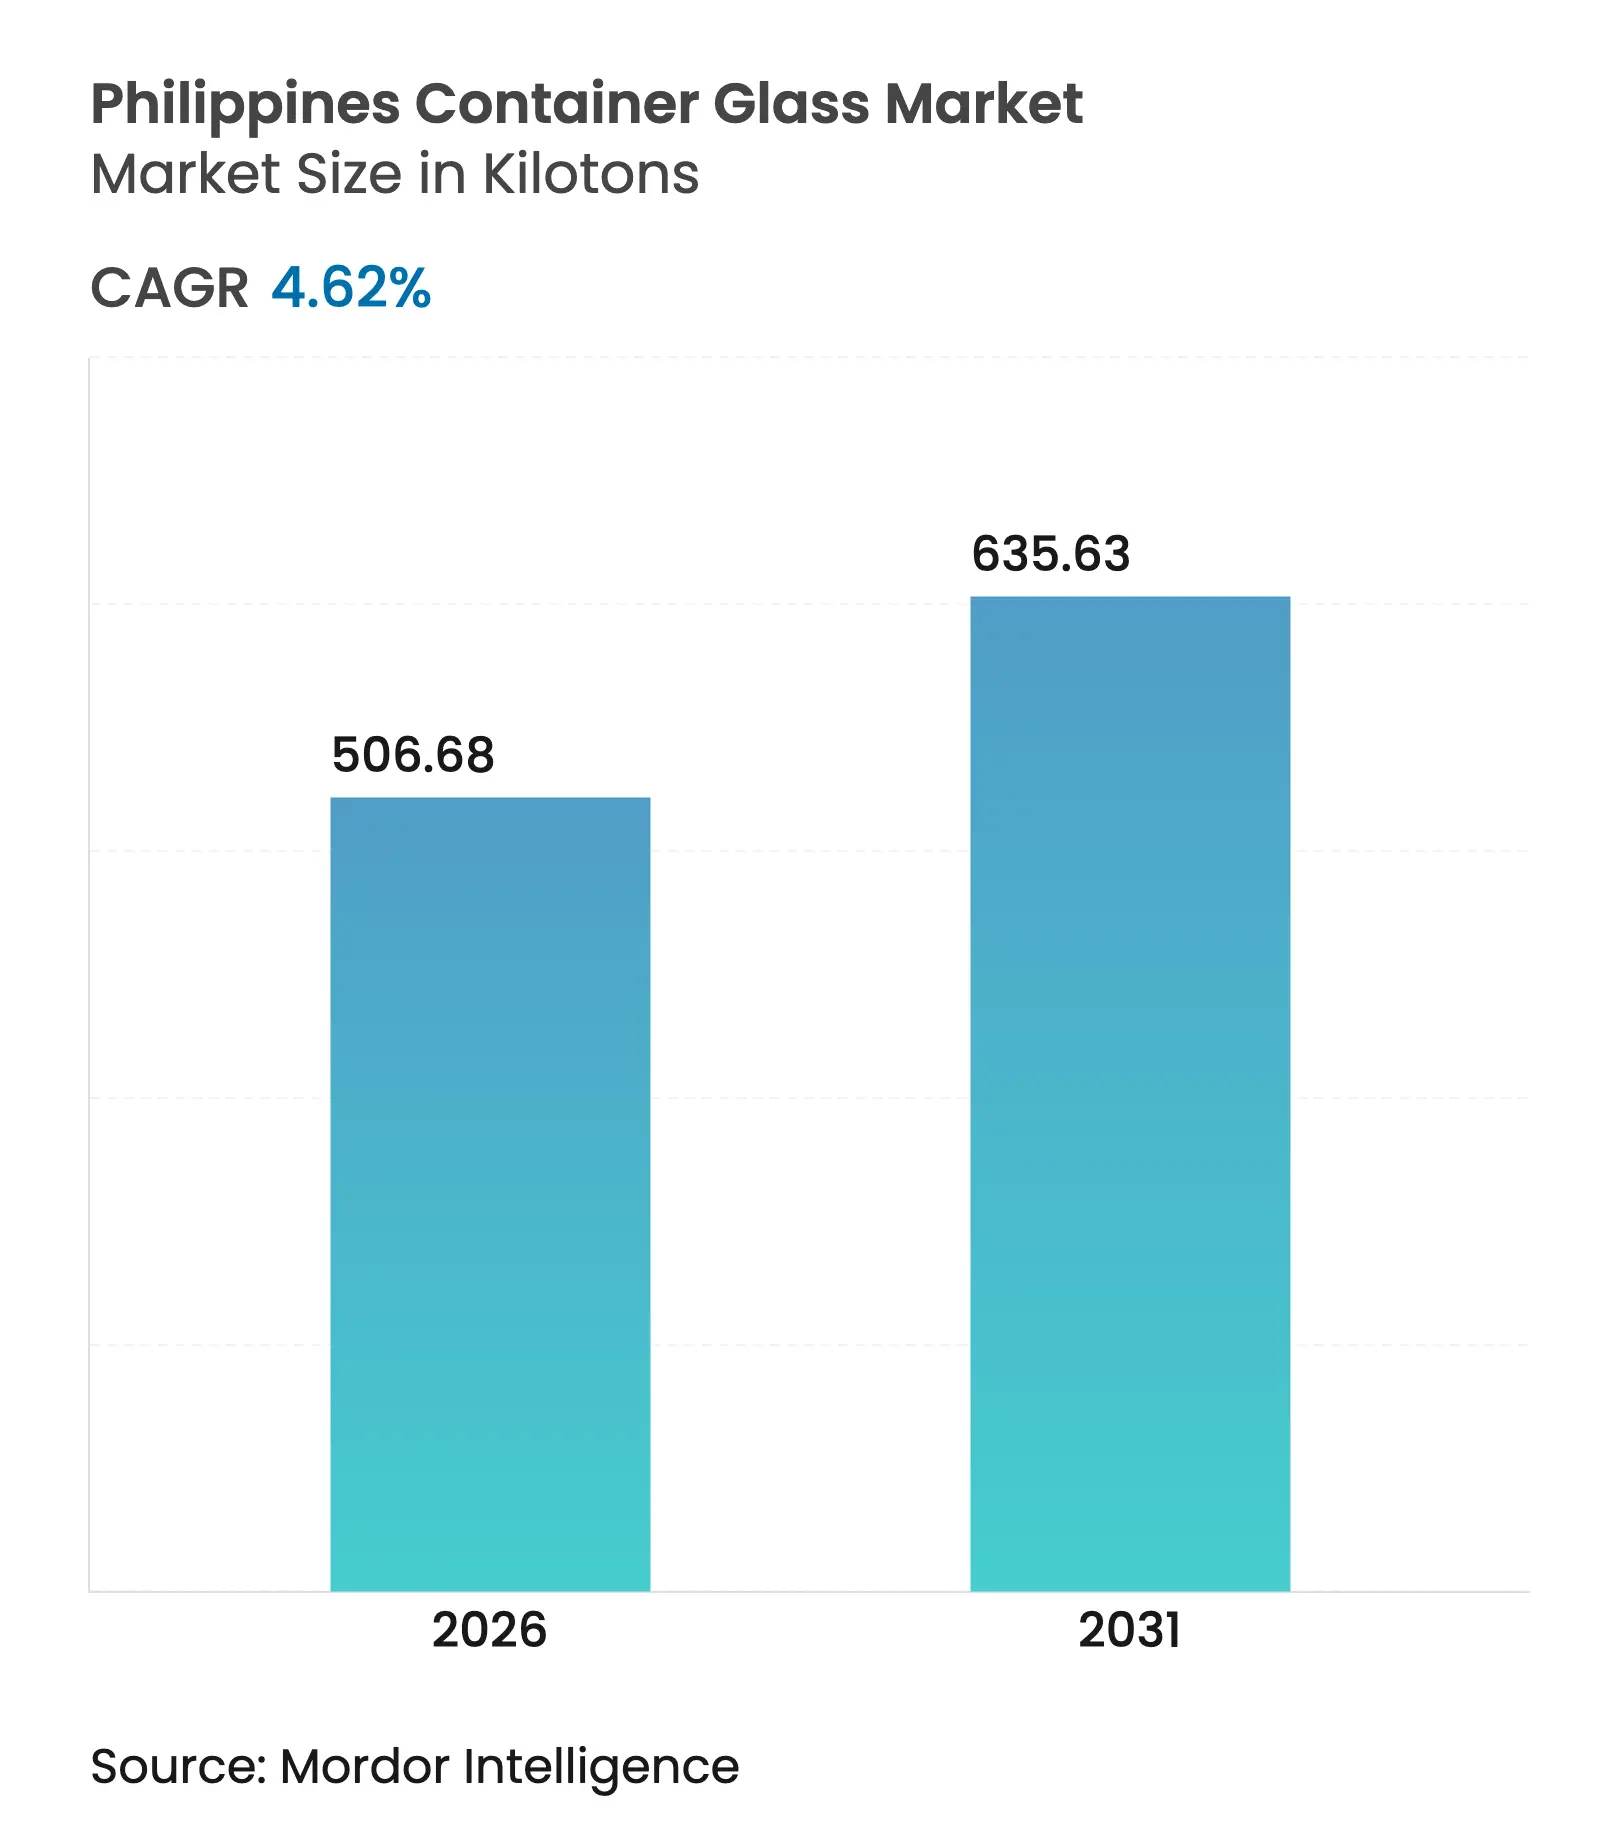
| Market Volume (2026) | 506.68 kilotons |
| Market Volume (2031) | 635.63 kilotons |
| CAGR | 4.62 % |
| Market Concentration | Medium |
Major Players *Disclaimer: Major Players sorted in no particular order. Image © Mordor Intelligence. Reuse requires attribution under CC BY 4.0. |
Philippines Container Glass Market Analysis by Mordor Intelligence
The Philippines' container glass market size is expected to grow from 484.3 kilotons in 2025 to 506.68 kilotons in 2026 and is forecast to reach 635.63 kilotons by 2031 at 4.62% CAGR over 2026-2031. Momentum stems from multibillion-peso beverage investments, growing pharmaceutical demand for amber vials, and regulatory pressure favoring highly recyclable formats. Returnable bottle programs adopted by global bottlers reinforce volume stability, while premiumization across cosmetics and craft spirits opens new niche opportunities. Elevated import costs for soda ash and persistent power-rate premiums temper competitiveness, yet domestic capacity additions and fiscal incentives continue to mitigate supply risk. The Philippines' container glass market also benefits from the Extended Producer Responsibility Act, which increases the comparative cost of plastic packaging and positions glass as a compliant solution for a circular economy.[1]Ruth Abbey Gita-Carlos, “Coca-Cola Commits USD 1 Billion to Expand Ops in PH,” Philippine News Agency, pna.gov.ph
Key Report Takeaways
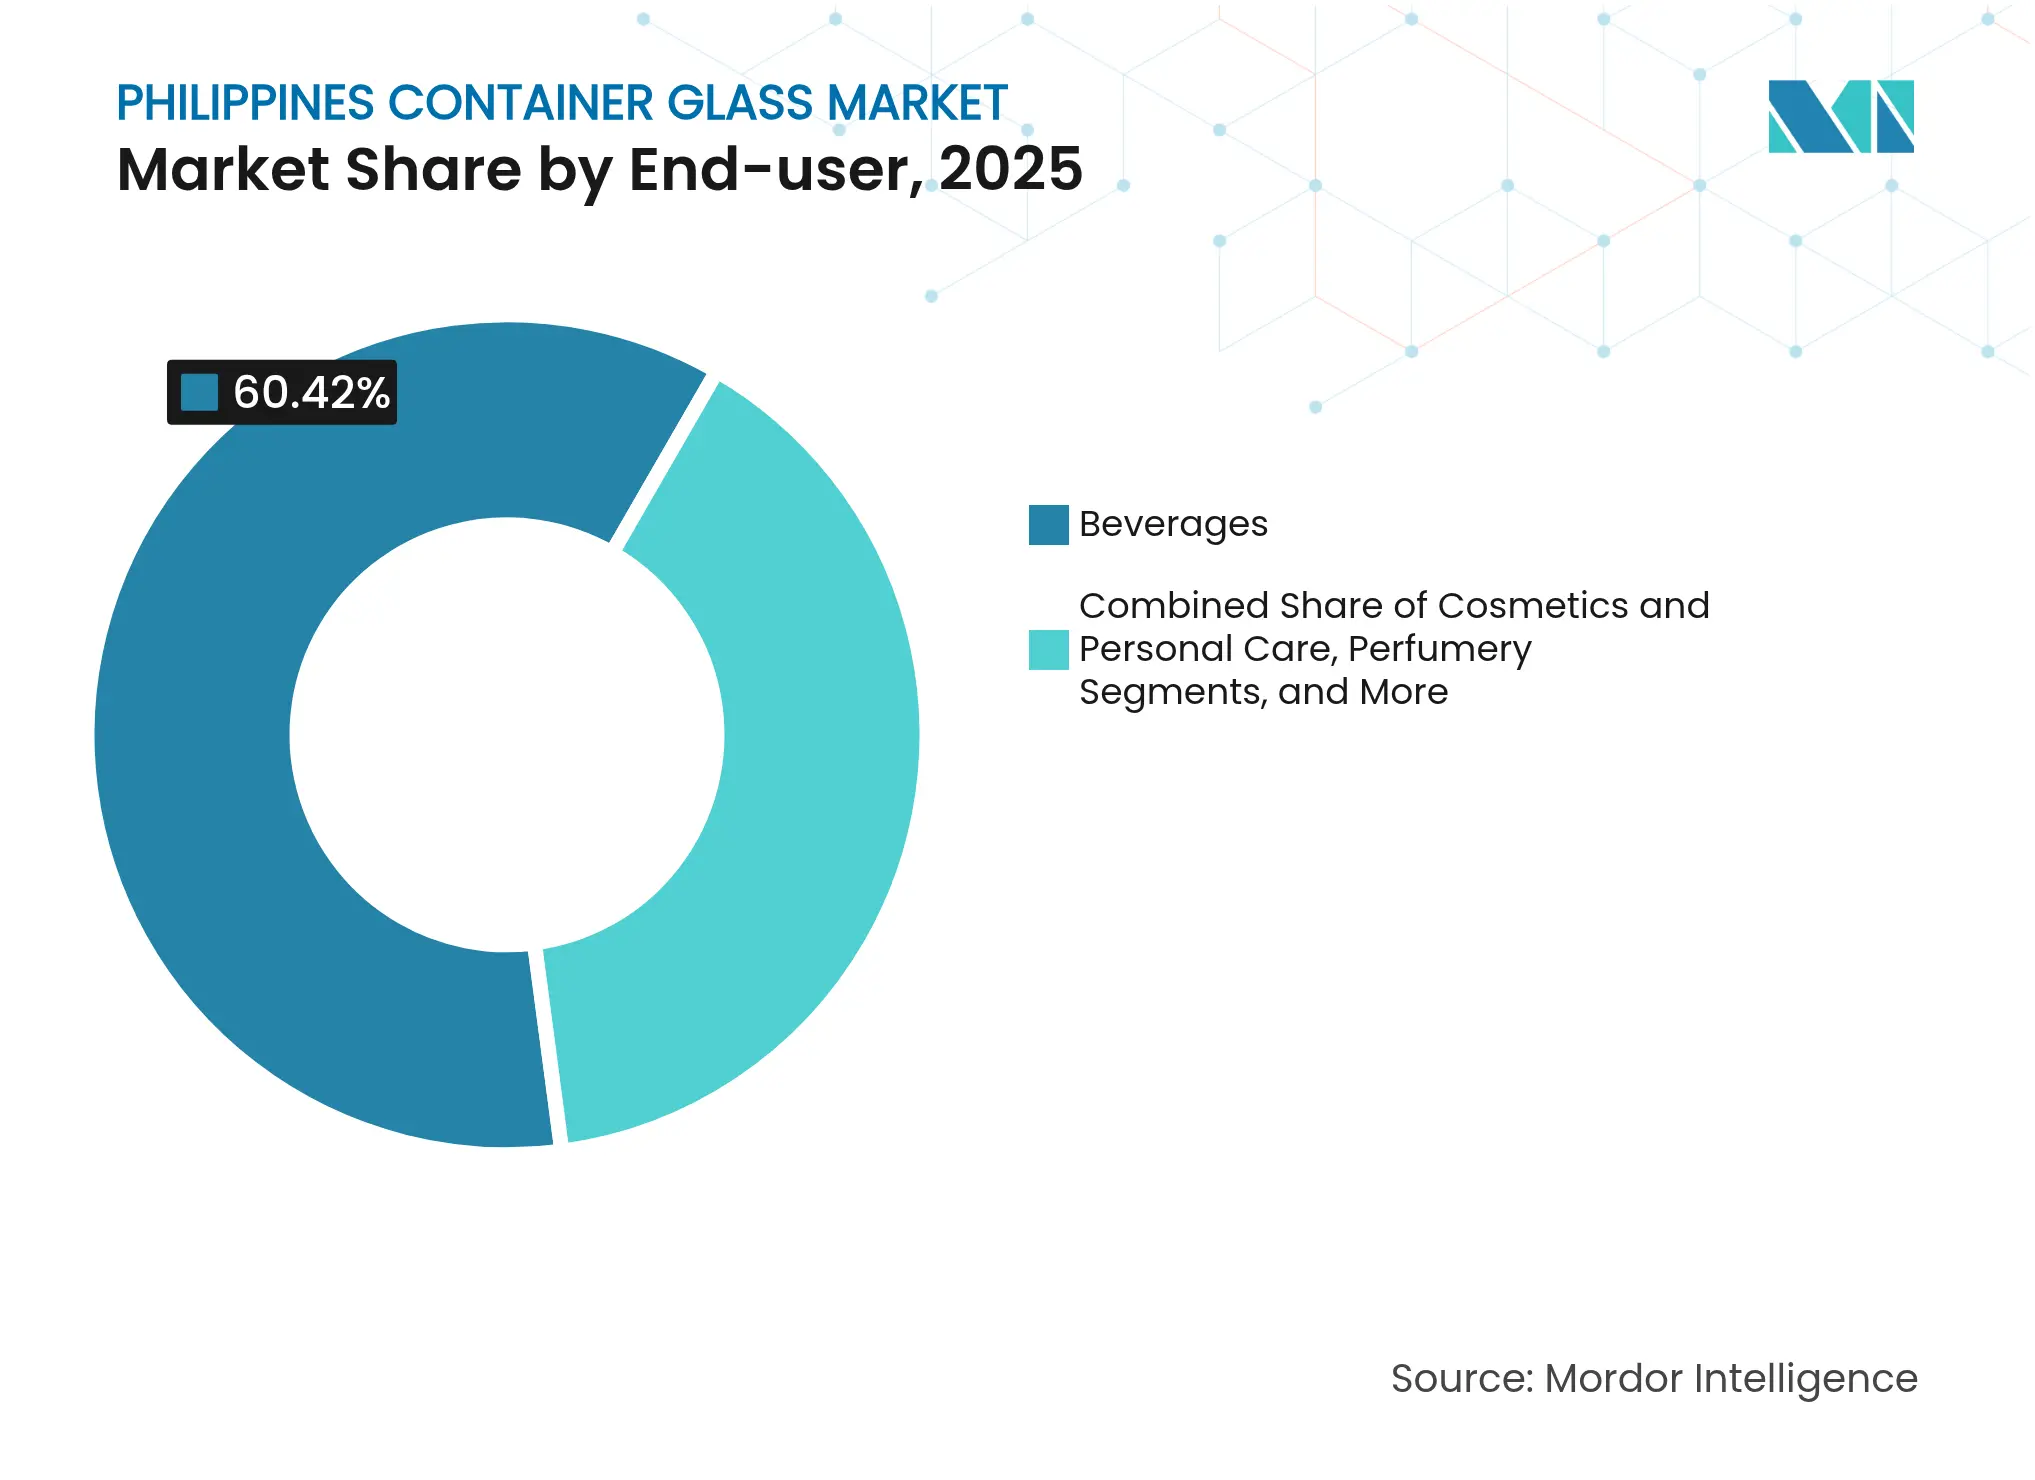
- By end-user, beverages captured 60.42% of the Philippines' container glass market share in 2025.
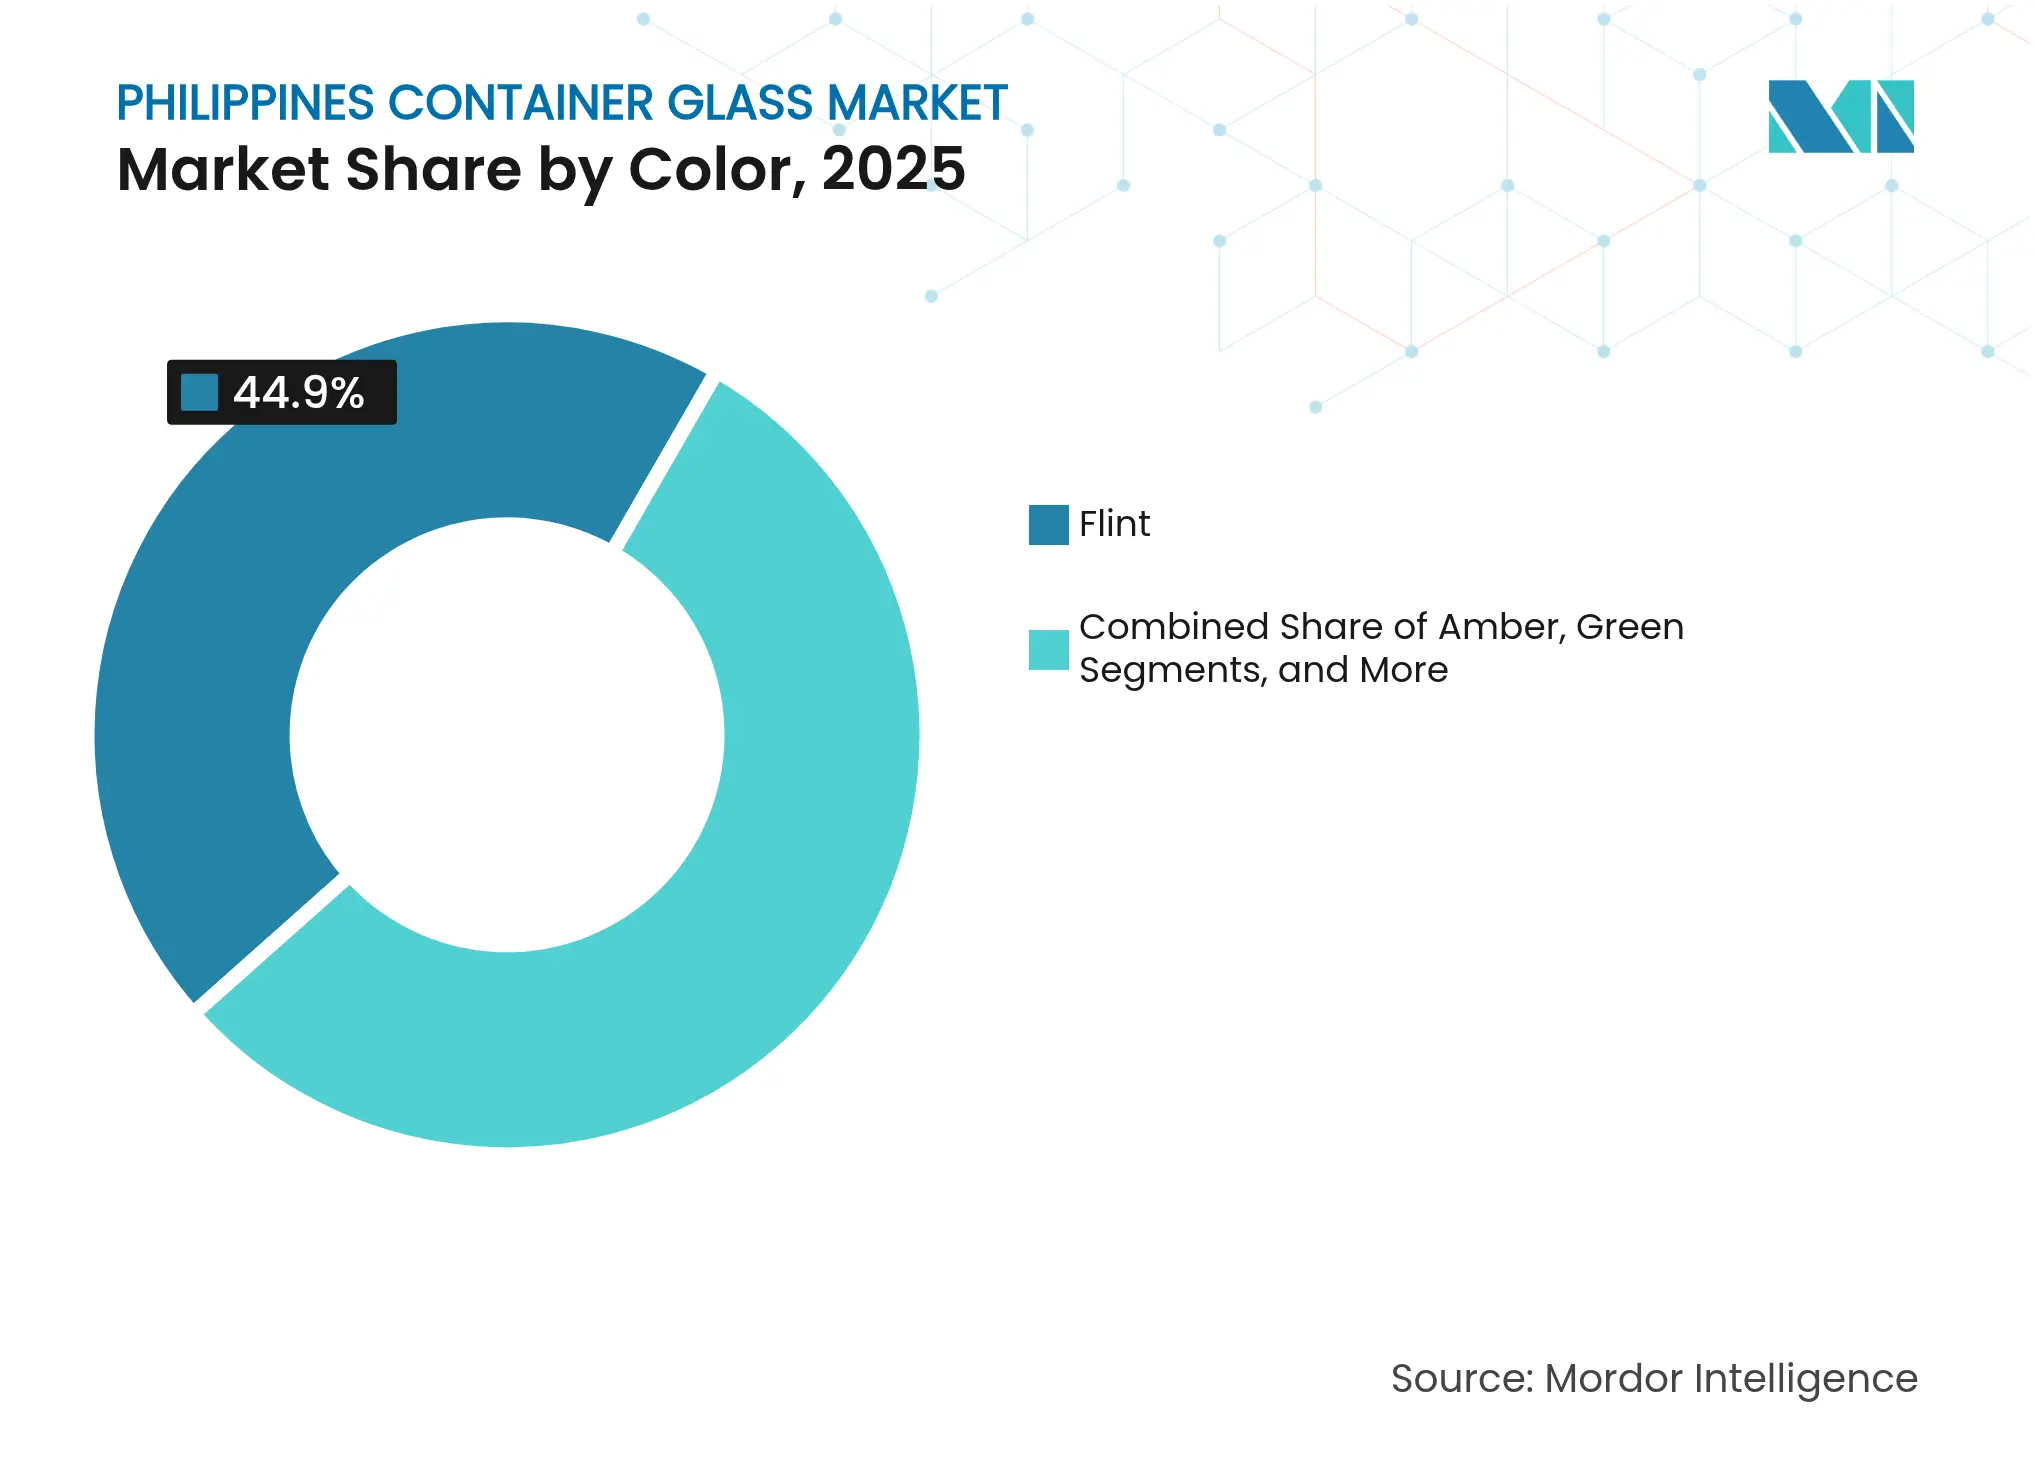
- By color, the Philippines' container glass market size for the amber segment is projected to grow at a 5.46% CAGR between 2026-2031.
Note: Market size and forecast figures in this report are generated using Mordor Intelligence's proprietary estimation framework, updated with the latest available data and insights as of 2026.
Philippines Container Glass Market Trends and Insights
Drivers Impact Analysis
| Driver | (~) % Impact on CAGR Forecast | Geographic Relevance | Impact Timeline | |||
|---|---|---|---|---|---|---|
Expansion of domestic beverage manufacturing capacity Expansion of domestic beverage manufacturing capacity | +1.2% | National, Luzon industrial zones | Medium term (2-4 years) | (~) % Impact on CAGR Forecast:+1.2% | Geographic Relevance:National, Luzon industrial zones | Impact Timeline:Medium term (2-4 years) |
Rising demand for sustainable packaging Rising demand for sustainable packaging | +0.8% | Metro Manila and major urban centers | Long term (≥4 years) | |||
Government incentives for local manufacturing Government incentives for local manufacturing | +0.6% | National, priority economic zones | Medium term (2-4 years) | |||
Growth of food exports requiring premium glass Growth of food exports requiring premium glass | +0.4% | Export-oriented regions, Luzon | Long term (≥4 years) | |||
Niche growth in craft spirits and artisanal beverages Niche growth in craft spirits and artisanal beverages | +0.3% | Urban centers and tourist hubs | Medium term (2-4 years) | |||
Surge in amber glass demand for vaccine fill-finish Surge in amber glass demand for vaccine fill-finish | +0.5% | National healthcare network | Short term (≤2 years) | |||
| Source: Mordor Intelligence | ||||||
Expansion of Domestic Beverage Manufacturing Capacity
Coca-Cola’s USD 1 billion, five-year investment program features a new Tarlac plant designed around returnable bottles, guaranteeing steady pull-through for the Philippines container glass market. Universal Robina’s 30.7-hectare Batangas complex, expected to employ 3,000 workers, signals parallel expansion within local soft drink, water, and ready-to-drink tea lines. These projects anchor long-run furnacing plans, reduce import dependence, and deepen partnerships with domestic glass suppliers.
Rising Demand for Sustainable Packaging
Metro Manila shoppers are increasingly willing to pay premiums for eco-friendly formats, and survey data show a positive correlation between environmental values and a preference for glass over plastic.[2]Tricia Rheinne A. Del Prado et al., “Exploring the Consumer Preference for Sustainable Packaging in Metro Manila,” Journal of Business and Strategic Management, carijournals.org The Extended Producer Responsibility Act requires large firms to recover up to 80% of post-consumer plastic by 2028, thereby increasing compliance costs for polymer options and indirectly shifting preference toward the Philippines' container glass market. Registration of 947 EPR programs by August 2024 underscores corporate alignment with glass’s infinite recyclability.
Government Incentives for Local Manufacturing
Republic Act 11960 institutionalizes the One Town, One Product initiative, providing packaging improvement grants and OTOP hubs at airports and tourist sites. Philippine Economic Zone Authority incentives, including up to seven-year income-tax holidays and duty-free capital imports, improve the return on furnace upgrades, trimming project payback for new entrants by as much as 25%. The Philippines' container glass market gains incremental orders from SMEs that now find export-ready glass packs financially accessible.
Growth of Food Exports Requiring Premium Glass
Artisanal coconut vodka (lambanog), fruit preserves, and high-value sauces rely on premium flint and specialty amber containers to satisfy Codex-aligned food-safety rules cited by the Philippines. OTOP trade-fair subsidies expose niche producers to overseas buyers, and export contracts require tamper-evident glass, bolstering the Philippines' container glass market as shipments scale.
Restraints Impact Analysis
| Restraint | (~) % Impact on CAGR Forecast | Geographic Relevance | Impact Timeline | |||
|---|---|---|---|---|---|---|
High energy costs and imported raw materials High energy costs and imported raw materials | -1.8% | Nationwide, energy-intensive facilities | Long term (≥4 years) | (~) % Impact on CAGR Forecast:-1.8% | Geographic Relevance:Nationwide, energy-intensive facilities | Impact Timeline:Long term (≥4 years) |
Substitution threat from PET and metal packaging Substitution threat from PET and metal packaging | -1.1% | Urban markets and modern retail | Medium term (2-4 years) | |||
Logistics bottlenecks at key ports Logistics bottlenecks at key ports | -0.4% | Manila, Cebu, Davao ports | Short term (≤2 years) | |||
Cullet shortages from weak recycling collection Cullet shortages from weak recycling collection | -0.6% | National, urban concentration | Medium term (2-4 years) | |||
| Source: Mordor Intelligence | ||||||
High Energy Costs and Imported Raw Materials
Industrial power tariffs in the Philippines are 38-67% higher than those of regional peers, a structural drag because melting furnaces allocate 10-20% of their conversion costs to electricity.[3]World Bank Group, “Market Study for Philippines: Plastics Circularity Opportunities and Barriers,” worldbank.org With 74.23% of installed capacity held by 11 families, cost-effective supply contracts remain scarce. Dependence on imported soda ash and limestone from China and Japan amplifies foreign-exchange exposure, lengthening working-capital cycles for the Philippines' container glass market.
Substitution Threat from PET and Metal Packaging
Disposable PET bottles weigh 10-70 g per liter, compared to glass at 300-600 g, driving distribution savings that resonate in the sachet-economy retail landscape. Aluminum cans enjoy a mature collection infrastructure, and 163 million sachets are sold daily, illustrating entrenched single-use habits. While glass retains its premium appeal, price-sensitive segments continue to migrate toward lighter substrates, thereby restraining the addressable base for the Philippines container glass market.
Segment Analysis
By End-user: Beverages Dominate, Personal Care Outpaces
The beverages segment contributed 60.42% of the Philippines' container glass market share in 2025, driven by established returnable systems for beer and carbonated soft drinks. Coca-Cola’s plant pipeline and San Miguel’s brewery-glass synergy sustain bulk orders, while craft beer and ready-to-drink cocktails add diversified SKUs. Spirits demand is projected to rise at a 4.55% CAGR through 2028, and the growing cocktail culture is expected to boost premium bottle formats, thereby elevating their shelf presence.
Food processors present steady throughput for smaller flint formats used in condiments, sauces, and shelf-stable meals entering export channels. Pharmaceutical buyers account for moderate but quality-intensive volumes, as Type I amber containers safeguard injectable vaccines and nutraceuticals amid expanding immunization coverage. Cosmetics and personal care advance at a 5.05% CAGR through 2031, fueled by rising middle-class incomes and the export of beauty serums that rely on air-tight glass droppers. Collectively, these trends keep the Philippines' container glass market on an upward trajectory, despite gains in substitute materials for select high-velocity SKUs.
Note: Segment shares of all individual segments available upon report purchase
By Color: Flint Retains Scale, Amber Accelerates
Flint containers represented 44.90% of the Philippines' container glass market size in 2025, serving mainstream beer, water, and food brands where transparency enhances product presentation. Stable furnace runs and established colorant recipes hold production cost advantages that encourage fill-and-return loops. Green glass maintains relevance for traditional lager and wine portfolios but faces slower growth as brand owners seek clear-label visibility.
Amber variants, by contrast, expand at a 5.46% CAGR owing to pharmaceutical sterility norms and UV-sensitive craft spirits. Vaccine fill-finish cycles require USP-compliant amber vials, and local generics manufacturers prequalify domestic suppliers to reduce lead times. On the beverage side, Emperador’s PHP 300 million (USD 5.16 million) one-way bottle plant underscores brand investment in differentiated jar finishes that convey heritage cues. San Miguel Yamamura’s heavy-metal-free label technology further lifts premium positioning, establishing amber containers as a strategic growth pillar within the Philippines container glass market.
Note: Segment shares of all individual segments available upon report purchase
Geography Analysis
Luzon captures the largest portion of the Philippines' container glass market because industrial corridors around Batangas, Cavite, and Tarlac are concentrated with both glass furnaces and beverage fillers. Proximity reduces freight on heavy bottles and enables synchronized production planning between breweries and container suppliers. Metro Manila remains the epicenter of premium personal care and pharmaceutical demand, channeling high-value SKUs through modern trade.
Visayas contributes notable volumes through Cebu’s growing craft beer scene and food processing clusters. Port infrastructure upgrades streamline the outbound shipments of flint jars packed with dried mangoes and gourmet sauces, which helps the Philippines' container glass market size grow beyond its historical dominance in Luzon. Mindanao’s beverage market is gaining traction as agribusiness investments spur the development of bottled juice lines using lightweight flint bottles, which are adapted for long-haul distribution to northern retailers.
Tourism-rich islands such as Boracay and Palawan support artisanal spirits and resort-oriented beverages packaged in eye-catching glass. While volumes are smaller, high unit margins encourage design innovation and specialty color runs, which raise the average selling price for the Philippine container glass market. Across all regions, bottle pool management systems are evolving to address archipelago logistics, and glass makers are collaborating with shipping lines on reverse logistics models to backhaul empties at lower costs.

Competitive Landscape
Market Concentration
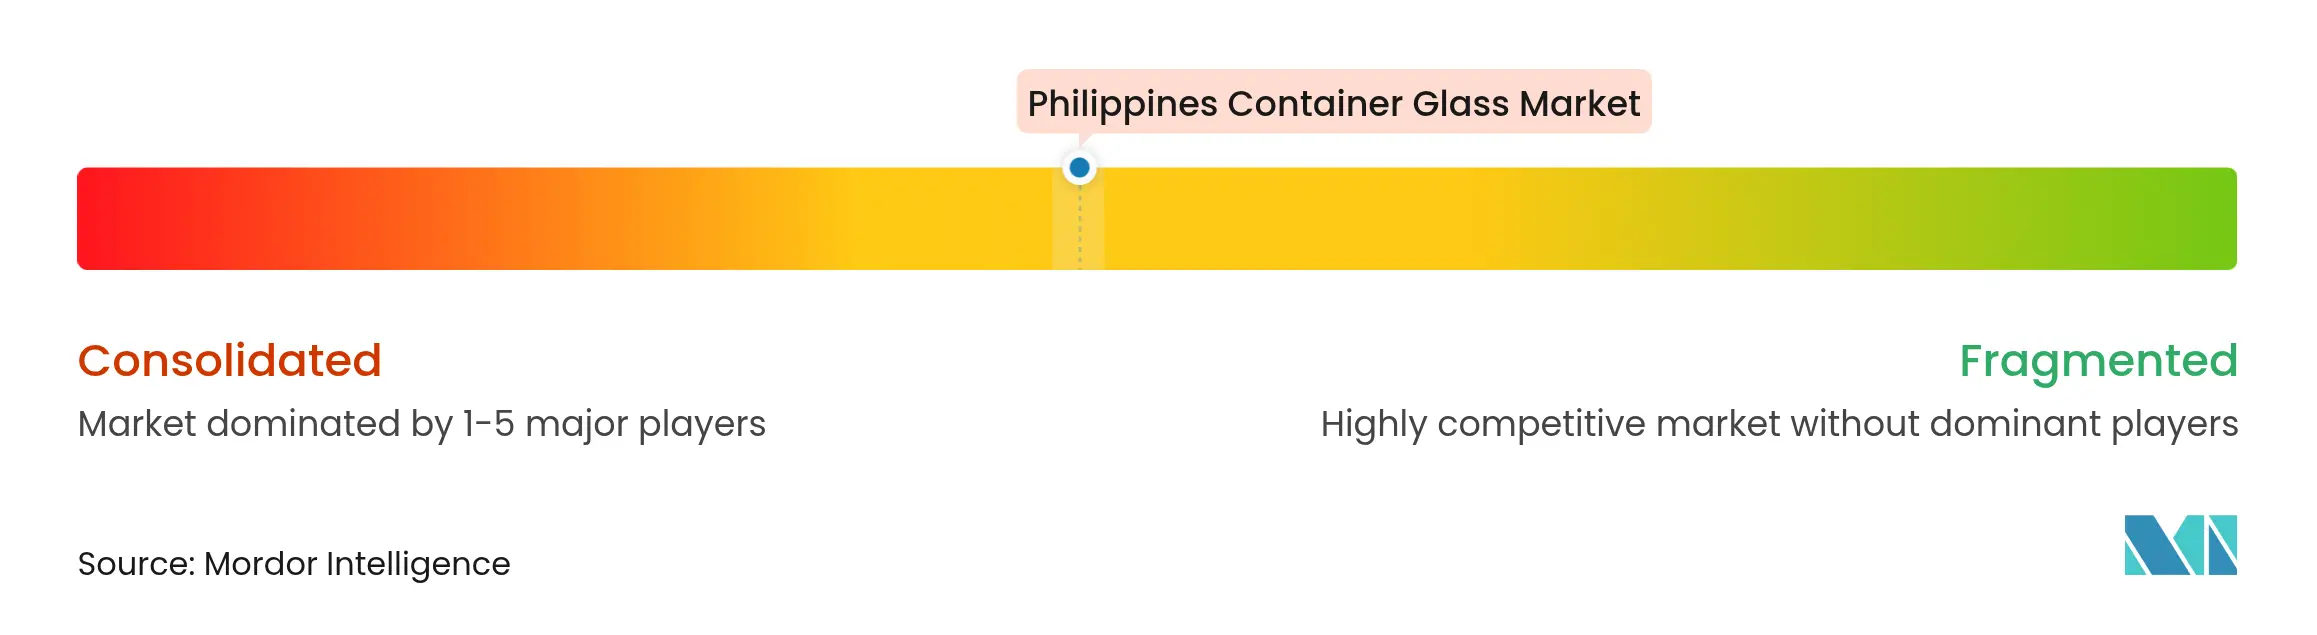
The Philippines' container glass market features moderate concentration, anchored by San Miguel Yamamura Asia Corporation’s vertically integrated furnace network. Its technology alliance with Nihon Yamamura Glass delivers batch-plant automation and electrostatic precipitators that align with tightening emission rules. Anglo Watsons Glass pursues cost leadership through renewable energy purchase contracts, cutting Scope 2 emissions and mitigating tariff risk. Asia Brewery’s in-house glass operation mirrors its parent firm, LT Group’s, beverage diversification, ensuring captive demand for refillable bottles across beer and iced tea brands.
White-space entrants focus on pharmaceutical vials and niche cosmetics jars where certification barriers deter low-spec importers. Firms leveraging PEZA incentives can quickly amortize furnace rebuilds, positioning themselves for export opportunities within the Regional Comprehensive Economic Partnership trade bloc. Nonetheless, energy-cost disparity keeps profit margins thin, and the Philippines' container glass industry requires continuous throughput to sustain furnace economics.
Downstream alliances represent a pivotal competitive lever. Glass producers secure multi-year offtake agreements with beverage majors, while fillers benefit from just-in-time delivery and co-designed bottle shapes that lock in brand equity. Technology roadmaps emphasize increased cullet ratios and oxy-fuel burners to limit carbon-tax exposure, maintaining regulatory compliance and customer goodwill within an evolving sustainability landscape.
Philippines Container Glass Industry Leaders

*Disclaimer: Major Players sorted in no particular order
Recent Industry Developments
- December 2024: The OECD published a capital-market review recommending financing reforms to spur manufacturing upgrades.
- May 2024: Anglo Watsons Glass executed a zero-emission power-supply pact with TeaM Philippines Energy, validated through International Renewable Energy Certificates.
- June 2024: The Philippine Statistics Authority hosted an International Merchandise Trade Statistics forum outlining export data transparency enhancements.
- March 2024: The Department of Energy released industrial power-rate data spanning 2013-2024, providing cost-benchmark clarity for furnace operators.
Table of Contents for Philippines Container Glass Industry Report
1. INTRODUCTION
- 1.1Study Assumptions and Market Definition
- 1.2Scope of the Study
2. RESEARCH METHODOLOGY
3. EXECUTIVE SUMMARY
4. MARKET LANDSCAPE
- 4.1Market Overview
- 4.2Market Drivers
- 4.2.1Expansion of domestic beverage manufacturing capacity
- 4.2.2Rising demand for sustainable packaging
- 4.2.3Government incentives for local manufacturing
- 4.2.4Growth of food exports requiring premium glass
- 4.2.5Niche growth in craft spirits and artisanal beverages
- 4.2.6Surge in amber glass demand for vaccine fill-finish
- 4.3Market Restraints
- 4.3.1High energy costs and imported raw materials
- 4.3.2Substitution threat from PET and metal packaging
- 4.3.3Logistics bottlenecks at key ports
- 4.3.4Cullet shortages from weak recycling collection
- 4.4PESTEL Analysis
- 4.5Industry Value Chain Analysis
- 4.6Container Glass Furnace Capacity and Locations in Philippines
- 4.6.1Plant Locations and Year of Commencement
- 4.6.2Production Capacities
- 4.6.3Types of Furnaces
- 4.6.4Color of Glass Produced
- 4.7Export-Import Data of Container Glass - Covering Key Import and Export Destinations
- 4.7.1Import Volume and Value, 2021-2024
- 4.7.2Export Volume and Value, 2021-2024
- 4.8Porter's Five Forces Analysis
- 4.8.1Threat of New Entrants
- 4.8.2Bargaining Power of Suppliers
- 4.8.3Bargaining Power of Buyers
- 4.8.4Threat of Substitutes
- 4.8.5Competitive Rivalry
- 4.9Raw Material Analysis
- 4.10Recycling Trends for Glass Packaging
- 4.11Demand vs Supply Analysis for Glass Packaging
5. MARKET SIZE AND GROWTH FORECASTS (VOLUME)
- 5.1By End-user
- 5.1.1Beverages
- 5.1.1.1Alcoholic
- 5.1.1.1.1Beer
- 5.1.1.1.2Wine
- 5.1.1.1.3Spirits
- 5.1.1.1.4Other Alcoholic Beverages (Cider and Other Fermented Drinks)
- 5.1.1.2Non-Alcoholic
- 5.1.1.2.1Juices
- 5.1.1.2.2Carbonated Drinks (CSDs)
- 5.1.1.2.3Dairy Product Based Drinks
- 5.1.1.2.4Other Non-Alcoholic Beverages
- 5.1.2Food (Jam, Jelly, Marmalades, Honey, Sausages and Condiments, Oil, Pickles)
- 5.1.3Cosmetics and Personal Care
- 5.1.4Pharmaceuticals (excluding Vials and Ampoules)
- 5.1.5Perfumery
- 5.2By Color
- 5.2.1Green
- 5.2.2Amber
- 5.2.3Flint
- 5.2.4Other Colors
6. COMPETITIVE LANDSCAPE
- 6.1Market Concentration
- 6.2Strategic Moves and Developments
- 6.3Company Market Share Analysis, (Based on Latest Production Capacity)
- 6.4Company Profiles (includes Global level Overview, Market level overview, Core Segments, Financials as available, Strategic Information, Market Rank/Share for key companies, Products and Services, and Recent Developments)
- 6.4.1Anglo Watsons Glass Inc.
- 6.4.2San Miguel Yamamura Packaging Corp.
- 6.4.3Bestpak Packaging Solutions Inc.
- 6.4.4Asia Brewery Inc.
- 6.4.5Arcya Glass Corporation
- 6.4.6The Grasse Fragrance Co.
- 6.4.7Mindanao Glass Containers Mfg. Corp.
- 6.4.8Philippine Glass Container Inc.
- 6.4.9Liberty Glass Containers Corp.
- 6.4.10Vitro Packaging Philippines Inc.
- 6.4.11Emperador Distillers Glassworks
- 6.4.12Liwayway Glass Manufacturing Corp.
- 6.4.13Synergy Pacific Packaging Corp.
- 6.4.14Dungon Glassworks Inc.
- 6.4.15PT Mulia Glass
- 6.4.16BJC-O-I Packaging
- 6.4.17Koa Glass Co., Ltd.
- 6.4.18Owens-Illinois Inc.
- 6.4.19Shandong Pharmaceutical Glass Co., Ltd.
- 6.4.20Saverglass Asia Pacific Pte Ltd.
7. MARKET OPPORTUNITIES AND FUTURE OUTLOOK
- 7.1White-space and Unmet-Need Assessment
Philippines Container Glass Market Report Scope
Container glass is designed for manufacturing glass containers, including bottles, jars, drinkware, and bowls. Its key attributes include chemical inertness, sterility, and non-permeability, rendering it especially sought after in the beverage, food, pharmaceutical, and cosmetic sectors. The research also examines underlying growth influencers and significant industry vendors, all of which help to support market estimates and growth rates throughout the anticipated period. The market estimates and projections are based on the base year factors and arrived at top-down and bottom-up approaches.
Philippines container glass market is segmented by end-user vertical (beverages [alcoholic beverages (beer, wine, spirits, and other alcoholic beverages {cider and other fermented drinks}), non-alcoholic beverages (juices, carbonated drinks (CSDs), dairy product-based drinks, other non-alcoholic beverages)], food [jam, jelly, marmalades, honey, sausages and condiments, oil, pickles], cosmetics and personal care, pharmaceuticals (excluding vials and ampoules), and perfumery), by color (green, amber, flint and other colors). The report offers market forecasts and size in volume (kilotons) for all the above segments.