
Autonomous BVLOS Drone Market Size and Share
Market Overview
| Study Period | 2020 - 2031 |
|---|---|
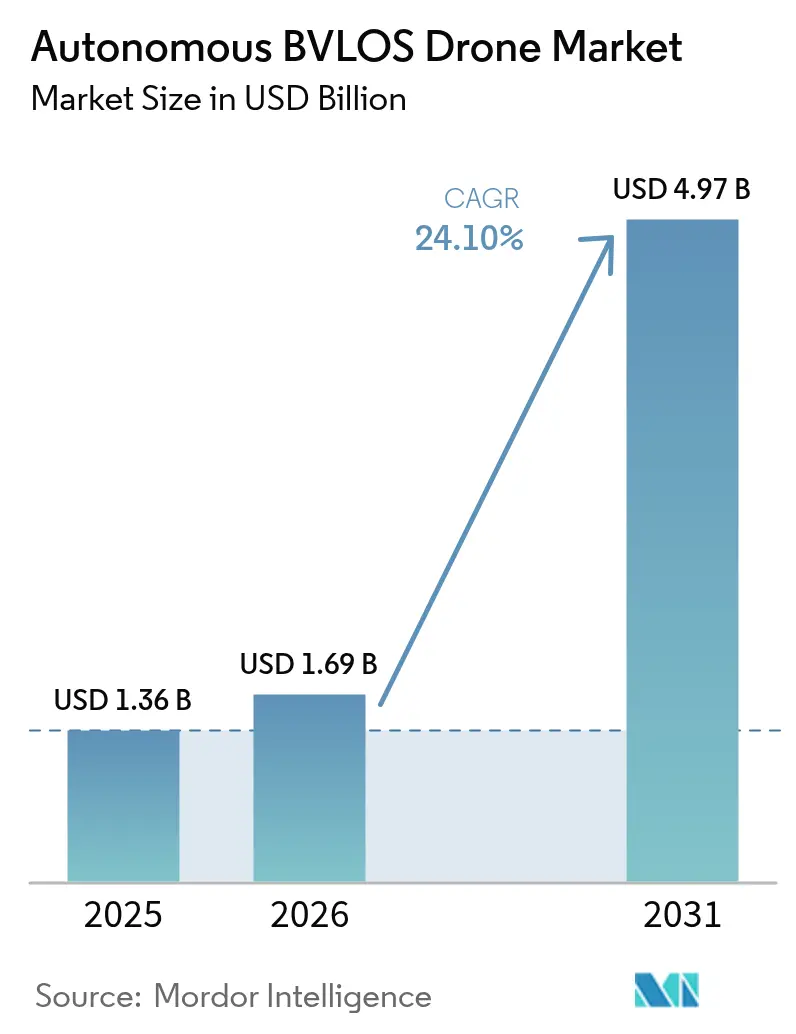
| Market Size (2026) | USD 1.69 Billion |
| Market Size (2031) | USD 4.97 Billion |
| Growth Rate (2026 - 2031) | 24.10 % |
| Fastest Growing Market | Asia Pacific |
| Largest Market | North America |
| Market Concentration | Medium |
Major Players *Disclaimer: Major Players sorted in no particular order Image © Mordor Intelligence. Reuse requires attribution under CC BY 4.0. | |
Autonomous BVLOS Drone Market Analysis by Mordor Intelligence
Autonomous BVLOS drone market size in 2026 is estimated at USD 1.69 billion, growing from 2025 value of USD 1.36 billion with 2031 projections showing USD 4.97 billion, growing at 24.10% CAGR over 2026-2031. Regulatory momentum in the US, Europe, and Canada is turning experimental programs into commercial services, while advances in detect-and-avoid systems, satellite connectivity, and unmanned traffic management (UTM) tools are lowering technical barriers. Demand from energy, utilities, and logistics users continues to validate business cases, and hybrid platforms are reshaping performance expectations by pairing vertical takeoff convenience with fixed-wing endurance. Supply-chain vulnerabilities around avionics and radio-frequency components remain a near-term concern, but vertically integrated manufacturers are responding through dual-sourcing strategies and regional assembly footprints. Overall growth potential is reinforced by rising public-sector investments in climate monitoring, infrastructure inspection, and emergency response that rely on long-range, high-payload operations.
Key Report Takeaways
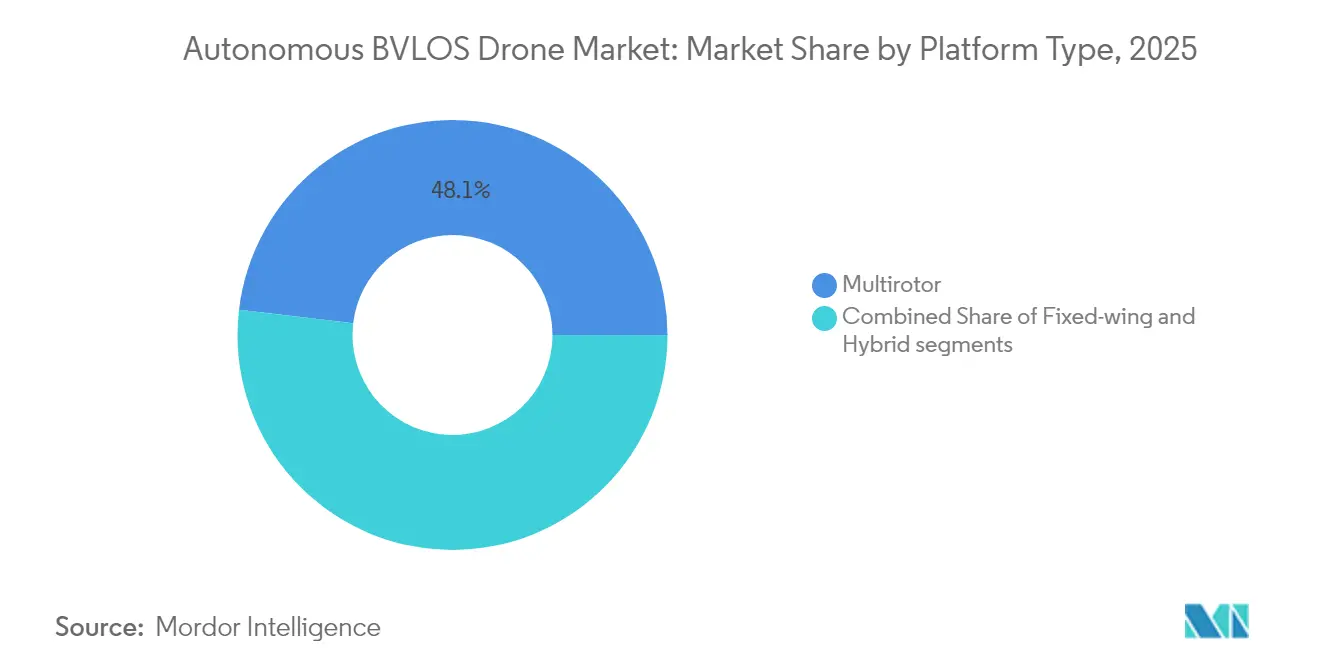
- By platform type, multirotor systems led with 48.12% of the autonomous BVLOS drone market share in 2025, while hybrid platforms are projected to expand at a 28.05% CAGR through 2031.
- By range, short-range operations accounted for 37.40% of the autonomous BVLOS drone market in 2025, yet the long-range segment is set to grow the fastest, with a 25.85% CAGR to 2031.
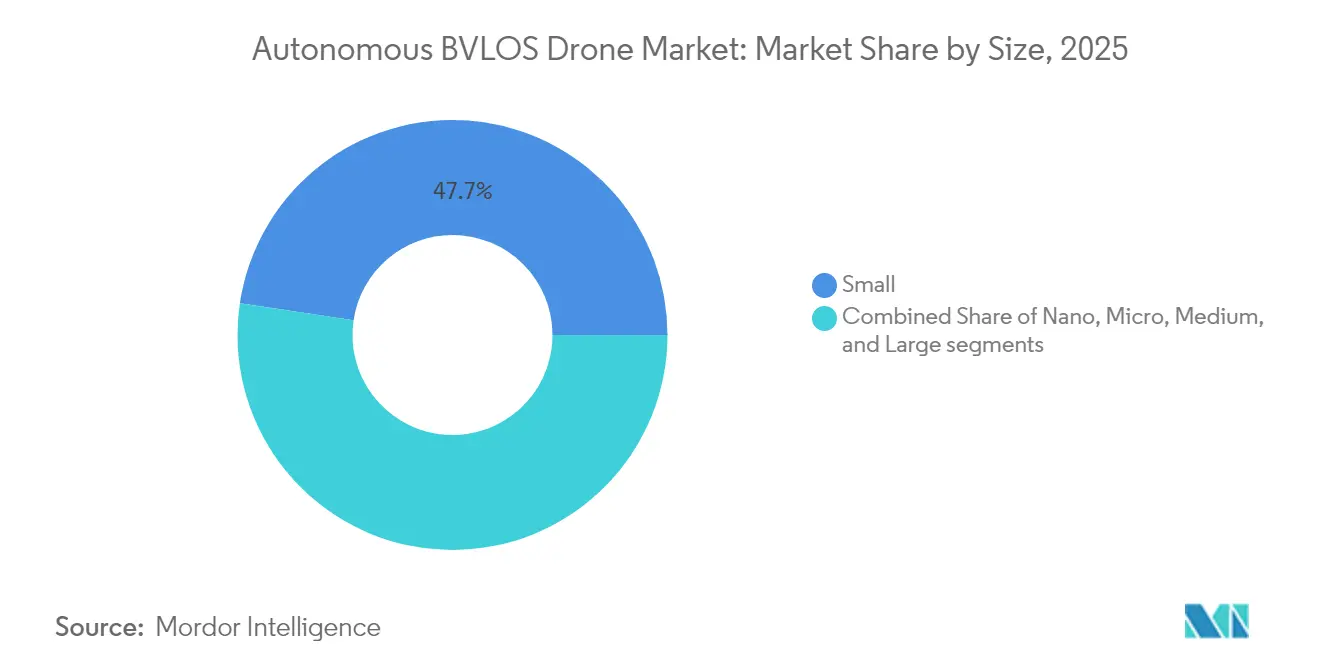
- By size, small platforms held 47.65% revenue share in 2025; large drones record the highest forecasted CAGR of 25.35% through 2031.
- By end-use industry, energy and utilities commanded 24.10% of 2025 revenue, whereas logistics and delivery led growth at 26.45% CAGR through 2031.
- By geography, North America maintained a 35.85% share in 2025, while Asia-Pacific posted the strongest 25.62% CAGR outlook to 2031.
Note: Market size and forecast figures in this report are generated using Mordor Intelligence’s proprietary estimation framework, updated with the latest available data and insights as of 2026.
Market Trends and Insights
Drivers Impact Analysis of Autonomous BVLOS Drone Market*
| Driver | (~) % Impact on CAGR Forecast | Geographic Relevance | Impact Timeline |
|---|---|---|---|
| Regulatory progress enabling routine BVLOS waivers and standards | +4.2% | Global – led by North America and Europe | Medium term (2-4 years) |
| Advances in detect-and-avoid and unmanned traffic management (UTM) technologies | +3.8% | Global – concentrated in developed markets | Long term (≥ 4 years) |
| Rapid growth in drone logistics and medical delivery pilots | +3.5% | Global – early adoption in North America and Asia-Pacific | Short term (≤ 2 years) |
| Energy and utilities sector demand for long linear-asset inspections | +3.1% | Global – emphasis on North America and Europe | Medium term (2-4 years) |
| Satellite-to-drone non-terrestrial network connectivity unlocking remote BVLOS operations | +2.9% | Global – priority in remote regions | Long term (≥ 4 years) |
| Adoption of BVLOS drones by national climate-monitoring fleets | +2.7% | Global – government-led initiatives | Long term (≥ 4 years) |
| Source: Mordor Intelligence | |||
Regulatory Progress Enabling Routine BVLOS Waivers and Standards
The new Part 108 Notice of Proposed Rulemaking released by the FAA in August 2025 introduces a rule-based path that replaces individual waivers, specifying mandatory detect-and-avoid equipment and standardized reporting, streamlining approval cycles. EASA mirrors this shift through its July 2024 Easy Access Rules update, which embeds BVLOS requirements into Standard Scenario STS-02 and harmonizes oversight across member states.[1]European Union Aviation Safety Agency, “U-space Concept of Operations,” easa.europa.eu Transport Canada reinforces North American alignment by finalizing an expanded BVLOS framework for drones up to 150 kg, effective November 2025, opening national airspace for routine long-range flights. As regulators converge on standard safety baselines, the autonomous BVLOS drone market gains predictable certification pathways that reduce time-to-deployment for commercial fleets. The improved clarity spurs investment in fleet expansion, integrated software platforms, and pilot training programs that anchor long-term revenue growth.
Advances in Detect-and-Avoid and Unmanned Traffic Management Technologies
Collision-avoidance innovation is moving from prototype to production. Optical, acoustic, and radar sensor fusion enables reliable non-cooperative traffic detection beyond 2 km. At the same time, lightweight Automatic Dependent Surveillance-Light (ADS-L) transponders provide affordable electronic conspicuity for general aviation users. Parallel progress in UTM networks means real-time traffic data can feed onboard navigation stacks. Europe’s U-space corridors, North America’s Remote ID rollout, and Japan’s nationwide drone registry all feed standardized APIs that allow dynamic airspace allocation. These improvements reduce pilot workload and shrink the technological gap between small-scale trials and high-density urban operations. As a result, insurers are beginning to offer tiered risk pricing tied to certified detect-and-avoid capability, incentivizing fleet owners to adopt next-generation avionics and strengthening the competitive edge of early movers.
Rapid Growth in Drone Logistics and Medical Delivery Pilots
Medical supply networks have emerged as a proving ground for long-distance flights, with Zipline surpassing 100 million autonomous miles in 2025 across Africa and the US. Regulatory preference for life-saving missions accelerates permit approvals, and successful operations reduce public perception barriers for broader parcel delivery uses. Nationwide BVLOS waivers granted to leading delivery players remove geographic limits that once capped route economics. Investments in automated loading docks, swap-and-go batteries, and cold-chain payload modules enable new revenue streams ranging from e-commerce packages to transplant organs. Volume growth in medical and consumer logistics also drives network effects: more landing nodes translate into denser coverage, shorter flight paths, and declining last-mile costs that reinforce the attractiveness of autonomous BVLOS drone market solutions.
Energy and Utilities Sector Demand for Long Linear-Asset Inspections
Electric utilities and pipeline operators increasingly leverage BVLOS patrols to inspect assets stretching across remote terrain. Georgia Power and Dominion Energy report cost reductions above 60% compared with helicopter charters, highlighting tripled inspection frequency that improves maintenance scheduling. Integrating thermal, LiDAR, and hyperspectral cameras allows automated detection of vegetation encroachment, corrosion, and heat anomalies. Linear-asset corridors often lie in sparsely populated airspace, lowering risk classifications and expediting waiver approvals. Service providers that bundle data analytics, cloud hosting, and maintenance dashboards gain sticky multiyear contracts. This dynamic propels recurring revenue growth and underpins the long-term outlook for the autonomous BVLOS drone market.
Restraints Impact Analysis of Autonomous BVLOS Drone Market*
| Restraint | (~) % Impact on CAGR Forecast | Geographic Relevance | Impact Timeline |
|---|---|---|---|
| Fragmented global regulatory timelines | -2.1% | Global | Medium term (2-4 years) |
| Battery energy density limitations reducing flight endurance | -1.8% | Global | Long term (≥ 4 years) |
| Supply chain vulnerability to critical avionics and RF components | -1.5% | Global – concentrated in Asia-Pacific dependencies | Short term (≤ 2 years) |
| Spectrum congestion impacting command-and-control (C2) links in urban corridors | -1.2% | Urban areas worldwide | Medium term (2-4 years) |
| Source: Mordor Intelligence | |||
Fragmented Global Regulatory Timelines
Differences in certification cycles across Asia-Pacific, South America, and Africa slow international expansion. While Japan’s Level 4 rules already permit autonomous operations over populated areas, neighboring markets like China still apply restrictive zone-based limits that constrain commercial viability. Operators flying trans-border logistics corridors must undergo parallel audits and training for each jurisdiction, inflating overhead. The absence of bilateral recognition between central aviation authorities forces duplicative testing of detect-and-avoid hardware and operational risk assessments. Smaller fleets divert scarce engineering resources toward compliance documentation, delaying product roadmaps and dampening the near-term trajectory for the autonomous BVLOS drone market.
Battery Energy Density Limitations Reducing Flight Endurance
Lithium-ion (Li-ion) chemistries average 250 Wh/kg, constraining multirotor endurance to 45-60 minutes under commercial payloads. Even promising silicon-nanowire cells from Amprius that reach 450 Wh/kg translate into incremental, not transformative, gains. Operators must trade payload weight against route length or invest in distributed charging and battery-swap infrastructure that inflates capital budgets. Until hydrogen fuel cells or hybrid propulsion systems reach cost parity, endurance limits will cap revenue per flight hour, particularly for long-range logistics services that underpin much of the projected growth of the BVLOS drone industry.
*Our forecasts treat driver/restraint impacts as directional, not additive. The impact forecasts reflect baseline growth, mix effects, and variable interactions.
Autonomous BVLOS Drone Market Segment Analysis
By Platform Type:
Hybrid Systems Expand Operational FlexibilityHybrid configurations merge multirotor vertical lift with efficient fixed-wing cruise, pivotal for missions exceeding 50 km while still requiring point-takeoff. The autonomous BVLOS drone market size for hybrid aircraft stood at USD 0.27 billion in 2025 and is predicted to triple by 2031 at a 28.05% CAGR. Operators favor these designs for corridor mapping, pipeline patrols, and parcel delivery outposts where ground infrastructure is minimal. The FVR-90 from L3Harris exemplifies endurance of 8 hours while lifting 15 lb payloads, underscoring how hybrids overcome the endurance ceiling of pure multirotors.
Hybrid demand also benefits from regulators who increasingly treat transition-airframes under fixed-wing rules once they enter cruise, simplifying airworthiness evaluations. Multirotor systems, however, remain entrenched in the autonomous BVLOS drone market due to their simplicity, lower unit cost, and near-zero launch footprint. These airframes hold 48.12% of 2025 revenue and will continue to dominate urban inspection and short-haul delivery missions. Fixed-wing units retain niche demand for agricultural spraying and very-long-range reconnaissance, but runway constraints limit their urban applicability. As software-defined flight controllers mature, fleet owners are expected to migrate toward modular architectures that allow rapid re-configuration between multirotor and hybrid modes, reinforcing platform diversification trends across the autonomous BVLOS drone market.



By Range:
Long-Distance Flights Unlock New Use-CasesLong-range operations represent the sharpest growth curve, climbing at 25.85% CAGR to 2031. Starlink’s non-terrestrial networks and similar low-Earth-orbit (LEO) constellations deliver low-latency command links beyond cellular reach, opening routes across deserts, offshore platforms, and mountain passes. Logistic firms leverage these links to bypass underserved road systems, while governments deploy long-range craft for border surveillance and wildfire monitoring.
Short-range BVLOS flights continue to serve inspection, mapping, and media capture assignments. Although they command 37.40% revenue share in 2025, growth moderates as penetration rises and regulatory paths stabilize. Medium-range flights fill the corridor between population centers and remote facilities, gaining relevance in regional parcel lanes and mid-stream pipeline inspections. Over time, expected gains in battery density and mesh-network radios will blur the current range classifications. Yet, demand stratification will persist because payload weight and regulatory hurdles differ by mission profile, ensuring that the autonomous BVLOS drone market caters to differentiated endurance niches.
By Size:
Large Airframes Support Industrial-Scale PayloadsLarge-class drones carry payloads above 25 kg and are now expanding at a 25.35% CAGR. Their heavy-lift capabilities enable offshore wind-farm component transport, mine-site resupply, and humanitarian aid drops. Larger fuselages also accommodate mixed-fuel or fuel-cell propulsion that extends endurance beyond six hours, meeting the economic break-even point for remote logistics.
Nonetheless, small platforms sustain leadership at 47.65% market share in 2025 due to lower regulatory thresholds and unit economics permitting fleet scaling. Nano and micro airframes gain traction in confined-space inspection of industrial boilers or under-bridge cavities, where rotor-wash sensitivity and collision risk are paramount considerations. Medium airframes balance payload and range, making them staples for forestry patrols and mid-stream oil-and-gas surveys. As composite materials and additive manufacturing trim structural weight, each class advances in parallel rather than cannibalizing others, illustrating the multipronged growth opportunity inside the autonomous BVLOS drone market.
By End-Use Industry:
Logistics Drives the Fastest UptakeLogistics and delivery fleets are forecasted to post a 26.45% CAGR between 2026 and 2031. Pilot programs have matured into national networks that handle blood samples, vaccines, and consumer parcels. Automated fulfillment centers integrate drone cells that receive electronic order cues, select payload modules, and load aircraft without human intervention, slashing pick-to-ship times to under five minutes. Regulatory agencies expedite approvals when operators prove redundancy, parachute recovery, and reliable detect-and-avoid functions—all now common on fleet-leading platforms.
Energy and utilities remain the revenue anchor, contributing 24.10% of the 2025 autonomous BVLOS drone market sales. Inspection frequency requirements are rising as grids modernize to accommodate distributed renewable generation. Precision agriculture, construction monitoring, public safety, and environmental surveillance generate demand, each with distinctive sensor packages. Telecom firms deploy tethered BVLOS drones as temporary relay towers during events or natural disasters, illustrating how diversified use-cases collectively sustain demand momentum across the autonomous BVLOS drone market.
Geography Analysis
North America Autonomous BVLOS Drone Market
North America remains the revenue leader with a 35.85% share in 2025. The FAA’s pending Part 108 rule is set to accelerate domestic authorizations, and Canada’s November 2025 framework harmonizes flight rules across the continent. Major utilities continue to scale corridor inspections, while platform vendors consolidate production inside the region to mitigate semiconductor supply risks. Ongoing public-private test ranges, including the New York UAS Corridor and North Dakota’s Northern Plains site, supply data that informs next-round regulatory refinements and buttresses regional competitiveness.
APAC Autonomous BVLOS Drone Market
Asia-Pacific represents the most dynamic growth arena at a 25.62% CAGR. Japan’s Level 4 framework permits autonomous flights above populated areas under specified safety cases, spawning delivery and emergency-response services in urban settings. China’s manufacturing scale compresses bill-of-materials costs, making sub-USD 10,000 airframes viable for fleet renewals. India’s agricultural incentives and digital-sky platform simplify operator licensing, sparking rapid uptake in crop-health mapping and precision spraying missions. South Korea and Australia apply BVLOS drones in maritime rescue and mine-site logistics, flooding regional airworthiness agencies with proof-of-concept data that informs future rulemaking.
Europe Autonomous BVLOS Drone Market
Europe capitalizes on EASA’s harmonized approach, providing a single certification gateway to 27 Member States. Standard Scenario STS-02 covers BVLOS flights up to 2 km when spotters are deployed, and several nations implement local extensions up to 10 km for linear infrastructure inspection. The continent’s U-space initiative supports real-time digital flight approvals and dynamic geofencing, easing congestion in dense air corridors. Research funding from programs such as SESAR 3 accelerates detect-and-avoid algorithm benchmarking, making Europe a hub for avionics R&D and interoperability testing within the autonomous BVLOS drone market.


Regulatory Landscape
Regulatory frameworks for autonomous BVLOS operations are moving from waiver-based permissions toward standardized, performance-based pathways, led by North America and Europe. In the United States, the FAA advanced this shift via the BVLOS NPRM issued in August 2025, and in January 2026 it reopened the public comment period on the proposal, keeping attention on required detect-and-avoid capability and common reporting expectations as the rule progresses. Canada also tightened alignment across North America by finalizing an expanded BVLOS framework for heavier drones effective November 2025, widening the addressable mission set for industrial and logistics operators.
International and regional standard-setting is reinforcing baseline requirements for cross-border operations and equipment conformity. ICAO adopted amendments in April 2024 introducing Annex 6 Part IV for International Operations of RPAS, anchoring global expectations around remote pilot licensing, airworthiness, and operator certification. In Europe, EASA continued harmonization through its July 2024 Easy Access Rules update and subsequent 2025 amendments to Regulations (EU) 2019/947 and 2019/945 that refine operational and product requirements, while ISO/IEC 22460-1:2025 provides a technical reference for standardized remote pilot licensing data. In parallel, the European Commission published a counter-drone action plan in February 2026, highlighting civil-military interoperability as a policy priority that shapes technical requirements for autonomy, identification, and airspace integration.
Value Chain Analysis
The autonomous BVLOS drone value chain runs from upstream materials and components to systems integration, software, and operations. Upstream exposure concentrates in rare earth magnets (for motors) and safety-critical electronics such as RF components, inertial sensors, and avionics, where sourcing concentration creates lead-time and compliance risk. Midstream integrators combine airframes, payloads (thermal, LiDAR, hyperspectral), and communications into type-configured platforms, while the autonomy stack (perception, mission planning, fleet management) and UTM connectivity increasingly differentiate offerings, particularly for multi-drone, remote-supervised operations.
Downstream, value is captured through end-to-end service delivery: deployment planning, regulatory documentation, training, docking/charging infrastructure, maintenance, and analytics that convert imagery and sensor data into actionable outputs for utilities, logistics, and public safety users. Partnerships are increasingly used to connect hardware fleets to remote operations centers and customer workflows, with orchestration and operations-management platforms playing a bigger role (for example, Aeronexts collaboration with SoftBank announced in July 2025 on an AI-powered operation management system for logistics). Operational models such as drone-in-a-box also tighten the service chain by linking dock suppliers, local maintenance, and operator enablement into a recurring support layer, as seen in coordinated inspection deployments where integrators and service providers bundle equipment, training, and rapid site support to reduce downtime.
Competitive Landscape
Competition is moderate, with the top five vendors controlling around 45% of 2024 revenue. Vertical integration is the strategic theme as hardware producers absorb software, analytics, and maintenance offerings to deliver turnkey packages. Skydio’s USD 170 million funding round underscores capital flows toward autonomy-centric solutions that comply with forthcoming detect-and-avoid mandates.[3]Skydio, “Series E Funding Announcement,” skydio.com
Mid-tier manufacturers focus on regional niches, tailoring payload options and training modules for local regulations. International standards convergence nudges these firms to partner for shared avionics and UTM middleware, trimming redundant development costs. Patent trends reveal a surge in automated docking and wireless data offload systems, signaling that ground infrastructure is the next battleground for differentiation.
Supply-chain pressure on RF chips and inertial sensors encourages nearshoring strategies and joint ventures with semiconductor fabs outside geopolitical flashpoints. Companies that guarantee the provenance of safety-critical components command premium service contracts, highlighting how risk management now shapes purchasing decisions and technical specifications within the autonomous BVLOS drone market.
Autonomous BVLOS Drone Industry Leaders
AeroVironment, Inc.
Skydio, Inc.
XAG Co., Ltd.
ideaForge Technology Pvt. Ltd.
EagleNXT
- *Disclaimer: Major Players sorted in no particular order

Autonomous BVLOS Drone Market Companies Covered in this Report
- AeroVironment, Inc.
- Parrot Drones SAS
- Skydio, Inc.
- Zipline International Inc.
- Wing Aviation LLC
- Drone Delivery Canada Corp.
- Percepto Robotics Ltd.
- XAG Co., Ltd.
- Quantum-Systems GmbH
- Lockheed Martin Corporation
- Carbonix
- ideaForge Technology Pvt. Ltd.
- Draganfly Innovations Inc.
- Delair SAS
- Volocopter GmbH (Diamond Aircraft Industries GmbH)
- Autel Robotics Co. Ltd.
- EagleNXT

Market Opportunities and Future Outlook
Ports, industrial zones, and linear infrastructure corridors create near-term whitespace for fully autonomous, dock-based BVLOS operations that run with minimal on-site staffing and consistent safety controls. Evidence of this shift is visible in Europe, where the Port of Tallinn launched an automated BVLOS drone pilot program at Muuga Harbour in May 2026 using dock-based infrastructure for continuous security and inspection, and in Belgium where ADLC secured authorization in February 2026 for BVLOS cargo drone flights at night within the Antwerp port area. These environments concentrate repeatable routes, controlled access, and high inspection cadence, supporting scalable deployments for surveillance, perimeter security, asset condition monitoring, and incident response.
A second opportunity area is the commercialization of routine BVLOS through clearer rulemaking and harmonized standards that reduce friction when scaling across jurisdictions. The FAA published its BVLOS NPRM in August 2025 (with the process continuing into 2026), while the UK CAA set out an implementation pathway in its Future of Flight: BVLOS Roadmap (CAP 3182) issued in October 2025, including planned work on airspace architecture proposals in 2026. As these programs progress, vendors that package certified detect-and-avoid, resilient command-and-control links, Remote ID integration, and fleet orchestration alongside training and maintenance can turn pilot programs into repeatable service templates across logistics, utilities, and public-sector monitoring missions.
Recent Industry Developments in Autonomous BVLOS Drone Market
- July 2026: Matternet partnered with Beeline UAS to expand commercial BVLOS drone delivery operations under FAA Part 135 certification, with an initial focus on the San Francisco Bay and Los Angeles metropolitan areas. The partnership strengthens network scale and operational coverage for regulated medical and time-critical deliveries. It also reinforces the role of certified operators and integrated partners in accelerating route expansion within existing regulatory permissions.
- March 2026: Skydio highlighted progress in multi-drone BVLOS operations after FAA approvals enabled a single remote pilot to oversee multiple Skydio X10 drones, including approvals granted to the New York Power Authority in January 2026. Multi-drone supervision raises productivity per operator and shifts fleet economics toward remote operations centers rather than field teams. The approvals also increase the importance of detect-and-avoid performance and operational procedures that can be repeated across utilities and infrastructure users.
- August 2025: The FAA published a Notice of Proposed Rulemaking to normalize BVLOS operations, outlining a rule-based pathway intended to reduce reliance on individual waivers and support scalable commercial missions. This proposal signaled a transition toward standardized requirements for equipment and reporting, which impacts product design and compliance planning across manufacturers and operators. It also encouraged investment in UTM integration and operational tooling aligned to performance-based approvals.


Autonomous BVLOS Drone Market Report Scope and Research Methodology
Market Definition and Coverage
This market covers the revenue generated from autonomous drones that can operate beyond visual line of sight, where the flight is enabled by onboard autonomy plus supporting systems that allow safe remote operations.
Scope exclusions (for this sizing): hobby or toy drones that are not used for BVLOS missions, and purely manual BVLOS operations without meaningful autonomy are not counted.
Segments Covered in This Report
- By Platform Type
- Multirotor
- Fixed-wing
- Hybrid
- By Range
- Short
- Medium
- Long
- By Size
- Nano
- Micro
- Small
- Medium
- Large
- By End-use Industry
- Energy and Utilities
- Logistics and Delivery
- Agriculture and Forestry
- Construction and Infrastructure
- Public Safety and Disaster Relief
- Environmental Monitoring and Surveying
- Telecom and Communication Relay
- By Geography
- North America
- United States
- Canada
- Mexico
- Europe
- United Kingdom
- France
- Germany
- Italy
- Spain
- Rest of Europe
- Asia-Pacific
- China
- India
- Japan
- South Korea
- Australia
- Rest of Asia-Pacific
- South America
- Brazil
- Rest of South America
- Middle East and Africa
- Middle East
- Saudi Arabia
- United Arab Emirates
- Rest of Middle East
- Africa
- South Africa
- Rest of Africa
- Middle East
- North America
Data Sources, Market Sizing, and Validation
Desk Research
Desk research was used to set the guardrails for what qualifies as BVLOS and what makes an operation autonomous, then to collect dependable external indicators. We relied on public aviation and safety material such as FAA publications and rulemaking updates, EASA guidance, and ICAO references to understand operational approvals and constraints that shape demand.
We also used sources such as government procurement portals, defense budget documents, and customs and trade statistics to gauge shipment momentum and the mix shift across platforms. Industry association pages, peer reviewed papers on detect and avoid and autonomy, and company filings and investor presentations were reviewed to understand typical payload capability, range classes, and price direction. Where needed, paid company financials and an intelligence subscription, along with a patent database, were used to cross check product roadmaps and revenue exposure. The sources listed here are illustrative, and many other public references were reviewed for data collection, validation, and clarification.
Primary Interviews and Surveys
Primary work focused on validating what is actually being deployed for BVLOS missions, what autonomy level is being paid for, and how pricing changes with range, payload, and compliance needs. Interviews covered manufacturers, software and autonomy providers, integrators, and end users supporting both commercial and government demand, with views balanced across APAC, EMEA, and the Americas to reduce single region bias.
Distribution of primary research fieldwork respondents
| Company type | Respondent position | Region |
|---|---|---|
| Top tier: 28% | CXOs: 13% | APAC: 45% |
| Mid tier: 56% | Functional/Unit leaders: 34% | EMEA: 33% |
| Smaller Players: 16% | Managers: 53% | Americas: 22% |
Market-Sizing & Forecasting
Sizing starts with a top down build where approved BVLOS activity, drone fleet additions, and the pace of autonomy feature adoption are used to reconstruct the addressable demand pool by region. To keep the totals realistic, selective bottom-up checks are run through sampled unit shipments and typical selling price bands (ASP) by platform class, and then channel feedback is used to adjust for gaps where public volume data is thin.
Inputs that were stress tested include the number of BVLOS waivers and permissions, corridor style inspection activity in energy and utilities, delivery trial to scaled deployment conversion rates, and the typical hardware plus autonomy software value split. Battery endurance and payload constraints were treated as practical ceilings for certain missions, which affects mix and realized pricing. Forecasts were built using scenario analysis, where adoption paths are tied to regulation timing, detect and avoid availability, connectivity readiness, and customer budget cycles, and then aligned to what interviewees consider implementable in the next few years.
Data Validation & Update Cycle
Model outputs are checked against independent signals such as procurement awards, announced fleet expansions, and regulatory milestones, and then variances are traced back to assumptions including utilization, pricing, and autonomy attach rates. When a number looks off, the drivers are reworked and targeted re contact is made with the most relevant respondent group before internal review sign off.
The report is refreshed annually, and interim updates are made when there are material events such as rule changes, major contract announcements, or sharp shifts in component pricing. Before delivery, a final pass is completed so the latest currency rates, inflation context, and key market events are reflected in the published view.
Mordor Intelligence's Autonomous Bvlos Drones Market Estimate Compared With Other Published Estimates
Published market sizes for autonomous BVLOS drones can look far apart because the scope boundary is not always consistent, and each publisher handles pricing and adoption timing differently. The gaps become even more visible when the base year is not aligned and when conversion rates and inflation are treated in a simplified way.
The largest gaps usually come from how autonomy is defined, whether services and mission operations are included, and how aggressive the ramp is assumed once regulations loosen. In this study, ASP progression is refreshed with recent tender pricing and interview feedback, then converted using current year average exchange rates. That step explains part of the spread versus figures that carry older price points, which is the refresh-led choice applied by Mordor Intelligence.
Benchmark comparison
| Source | Market Size | Gaps in Research Methodology |
|---|---|---|
| Mordor Intelligence | USD 1.69 B (2026) | |
| Global Consultancy A | USD 2.49 B (2025) | Uses a different base year and may include a broader revenue scope around autonomy enabled BVLOS activity, which can pull in adjacent software and operational value not consistently separated from drone platform revenue. |
| Industry Publisher B | USD 1.85 B (2024) | Covers the wider BVLOS drone market with autonomy as an enabling trend, which can blend manual BVLOS programs and earlier pilot spending, and it can lift the total when older pricing and faster adoption assumptions are applied. |
Reading the table together, the spread is mainly explained by scope boundaries and timing, not by a single math step. Our approach stays traceable by anchoring demand to permission led activity and then cross checking totals with practical price bands and deployment signals, which keeps the final number repeatable when assumptions are updated.


Key Questions Answered in the Report
What is the expected value of the Autonomous BVLOS drone market in 2031?
Forecasts place the autonomous BVLOS drone market size at USD 4.97 billion by 2031.
How fast is the Autonomous BVLOS drone market growing?
The autonomous BVLOS drone market is projected to expand at a 24.10% CAGR between 2026 and 2031.
Which platform type is growing the fastest?
Hybrid airframes lead growth with a 28.05% CAGR through 2031 thanks to combined lift and cruise efficiency.
Which region offers the strongest growth outlook?
Asia-Pacific is the fastest-growing region, expected to post a 25.62% CAGR as regulations mature and manufacturing scales.
What is the main driver behind accelerating commercial adoption?
Regulatory standardization that replaces case-by-case waivers with rule-based approvals provides predictable pathways for investment and fleet expansion.
Page last updated on:


 Your data is secure and never sold or shared.


