Market Overview
| Study Period | 2019 - 2031 |
|---|---|
| Forecast Data Period | 2026 - 2031 |
| Historical Data Period | 2019 - 2024 |
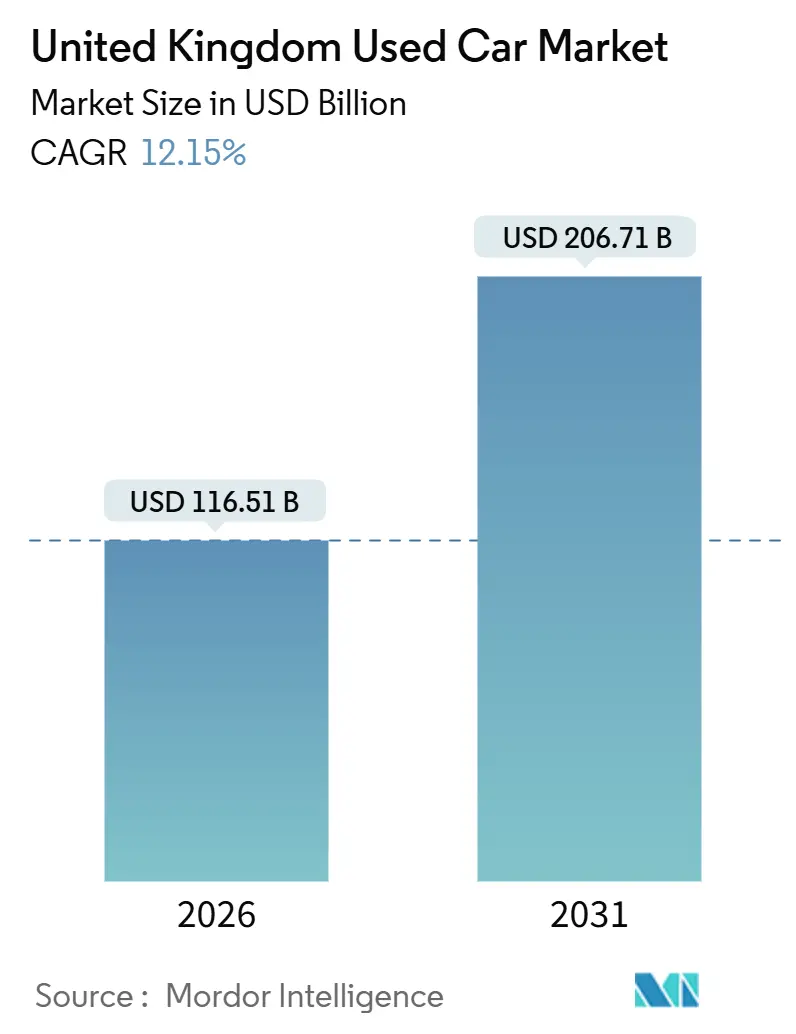
| Market Size (2026) | USD 116.51 Billion |
| Market Size (2031) | USD 206.71 Billion |
| Growth Rate (2026 - 2031) | 12.15% CAGR |
| Market Concentration | Medium |
Major Players
*Disclaimer: Major Players sorted in no particular order Image © Mordor Intelligence. Reuse requires attribution under CC BY 4.0. |
|
United Kingdom Used Car Market Analysis by Mordor Intelligence
The United Kingdom used car market size stands at USD 116.51 billion in 2026 and is projected to reach USD 206.71 billion by 2031, translating into a 12.15% CAGR over the forecast period. Growth is driven by faster fleet renewal triggered by urban emissions zones, the rise of trusted certified pre-owned programs, and the rapid migration of transactions to digital marketplaces. Buyers are gravitating toward flexible ownership models, such as subscription services, while residual-value guarantees on battery-electric vehicles (BEVs) help alleviate depreciation concerns and accelerate the adoption of electrification. Competitive dynamics are intensifying as franchised dealer groups, auction majors, and pure-play online platforms deploy data-driven pricing tools that compress days-to-sale and widen geographic reach, according to Investegate. Persistent interest-rate headwinds and elevated used-vehicle prices remain the principal brakes on volume recovery. Yet, structurally tighter new-car output keeps near-new stock scarce, supporting pricing power.
Key Report Takeaways
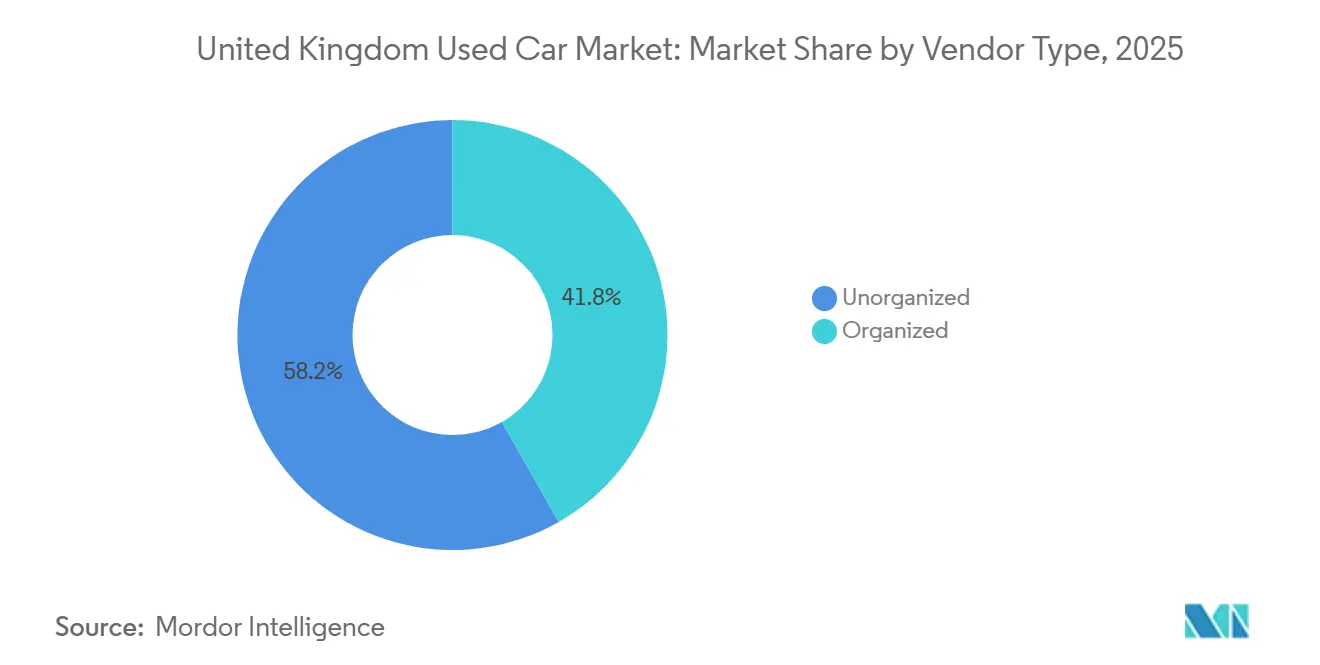
- By vendor type, unorganized vendors led the United Kingdom used car market with 58.23% of the market share in 2025; organized players are projected to expand at a 12.82% CAGR through 2031.
- By vehicle age, cars aged 3-5 years captured 34.28% of the United Kingdom used car market share in 2025, while the 0-2 year cohort is advancing at a 12.43% CAGR to 2031.
- By fuel type, petrol models dominated at 53.34% of the United Kingdom used car market share in 2025, whereas used BEVs are rising at a 19.23% CAGR through 2031.
- By body type, hatchbacks accounted for 41.93% of the United Kingdom used car market share in 2025; sport utility vehicles are projected to grow at a 13.21% CAGR through 2031.
- By sales channel, offline franchised dealers accounted for 34.84% of the United Kingdom used car market share in 2025, while online-only platforms are projected to scale at a 14.48% CAGR through 2031.
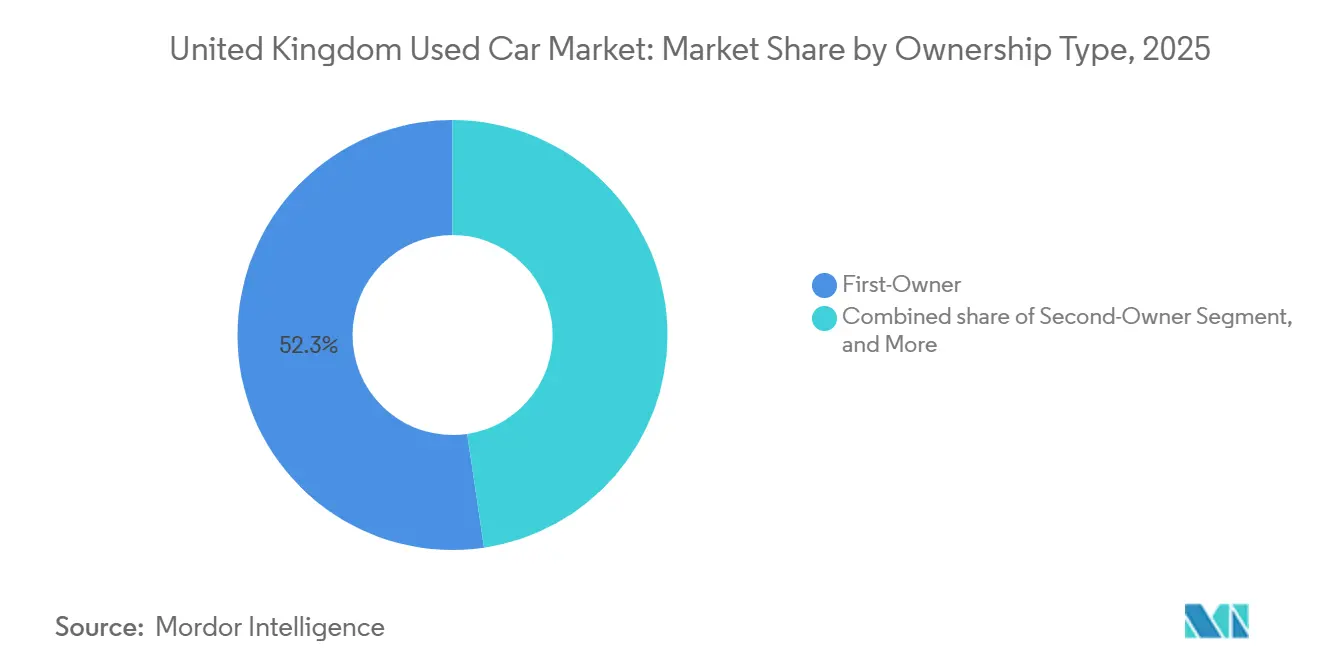
- By ownership, first-owner vehicles represented 52.34% of the United Kingdom used car market share in 2025 and are expected to grow at a 12.72% CAGR through 2031.
- By price band, the USD 7,000-15,000 bracket accounted for 39.87% of the United Kingdom's used car market share in 2025, whereas cars priced above USD 30,000 are forecast to increase at a 13.73% CAGR through 2031.
- By region, England contributed 80.34% of the United Kingdom's used car market share in 2025, while Northern Ireland is poised for the fastest growth, with a 12.61% CAGR through 2031.
Note: Market size and forecast figures in this report are generated using Mordor Intelligence’s proprietary estimation framework, updated with the latest available data and insights as of January 2026.
United Kingdom Used Car Market Trends and Insights
Drivers Impact Analysis*
| Drivers | (~) %Impact on CAGR | Geographic Relevance | Peak Impact |
|---|---|---|---|
| Online Only Marketplaces Surge | +2.1% | National, with early gains in urban England and Scotland | Short term (≤ 2 years) |
| Clean-Air Zones Speed Fleet Turnover | +1.8% | England (London, Birmingham, Manchester), Scotland (Glasgow, Edinburgh, Aberdeen, Dundee), Wales (Cardiff) | Medium term (2-4 years) |
| OEM CPO Programs Boost Trust and Prices | +1.5% | National, concentrated in England and Scotland dealer networks | Medium term (2-4 years) |
| Residual Guarantees Lift BEV/Hybrid Appeal | +1.4% | National, stronger in England and Scotland with charging infrastructure | Medium term (2-4 years) |
| Used-Car Subscriptions Drive Repeat Demand | +0.9% | National, urban-focused (London, Manchester, Birmingham) | Long term (≥ 4 years) |
| Telematics Weaken Older Car Competitiveness | +0.8% | National, disproportionate impact in England | Short term (≤ 2 years) |
| Source: Mordor Intelligence | |||
Rapid Uptake of Online-Only Marketplaces and Click-and-Deliver Models
Auto Trader dominates marketplace browsing time, leveraging instant-offer tools and guaranteed part-exchange options to streamline sales for private sellers. Carwow uses a dealer-bidding engine, introducing transparent auction-style pricing to its retail inventory. This strategy not only earns recognition through Top-Rated badges for low complaint rates but also strengthens digital trust. Real-time pricing engines, such as Vertu Insights, enhance stock turnover and increase profit margins. Mobile-centric buyers now expect home delivery within a short timeframe, prompting even traditional groups to embrace an omnichannel approach.
ULEZ, ZEZ and Clean-Air Zones Accelerating Fleet Turnover Toward Newer Used Cars
London’s Ultra-Low Emission Zone now covers every borough, raising compliance to 96% by mid-2024 and pushing owners of older engines to trade into Euro 6-compliant used stock[1]“Air Quality Annual Report 2024,”, Transport for London, tfl.gov.uk. Similar clean-air charging schemes in Birmingham, Manchester, and Scotland’s four Low Emission Zones levy daily fees that erode the economics of running vehicles aged eight years or more. The resulting demand shifts split the United Kingdom's used car market, with compliant petrol and diesel cars attracting urban premiums. At the same time, non-compliant stock is either relocated to rural areas or scrapped. The policy cascade lifts transaction velocity and underpins residual values for younger vehicles. Regional rollouts, including Cardiff’s planned 2026 zone, are expected to maintain the regulatory tailwind through the forecast horizon.
OEM-Backed Certified Pre-Owned Programs Boost Buyer Trust and Prices
Manufacturer-run certified schemes provide warranty extensions and comprehensive inspections, reducing information asymmetry. This allows dealers to charge premiums while also shortening the time required to sell vehicles. Premium groups such as Sytner focus on retailing Euro 6-compliant stock, positioning themselves as one-stop shops for low-emission vehicles. Battery-health reports included in BEV certifications further address concerns about range degradation. As more OEMs transition to direct-sales formats, certified programs are becoming essential for maintaining residual values and ensuring customer loyalty for services and upgrades.
Attractive Residual-Value Guarantees on Used BEVs and Hybrids
OEM buy-back pledges that limit depreciation over a few years significantly reduce the risks historically associated with second-hand EV batteries. Independent tracking shows that BEVs maintain a higher percentage of their launch value compared to equivalent petrol cars, narrowing the total cost of ownership gap. The practical appeal of EVs is further enhanced by the ongoing expansion of charger installations at dealer sites. Additionally, upcoming Zero Emission Vehicle quotas are driving more compliant stock into the market.
Restraints Impact Analysis*
| Restraints | (~) %Impact on CAGR | Geographic Relevance | Peak Impact |
|---|---|---|---|
| High Rates Raise Used-Car Finance Costs | -2.3% | National, acute in England and Scotland | Short term (≤ 2 years) |
| Used-Car Prices Surge Amid Output Crunch | -1.6% | National, concentrated in England | Short term (≤ 2 years) |
| ICE Residuals Uncertain Before Fuel Ban | -1.4% | National, stronger impact in urban England and Scotland | Medium term (2-4 years) |
| Data-Privacy Concerns in Ownership Transfers | -0.5% | National, emerging concern in urban areas | Long term (≥ 4 years) |
| Source: Mordor Intelligence | |||
High Interest-Rate Environment Raising Finance Costs for Buyers
Although the Bank of England eased the base rate to 4.25% by May 2025, for prime borrowers, used-car APRs hover at moderate levels, while subprime rates can reach significantly higher percentages [2]"Monetary Policy Summary", Bank of England, bankofengland.co.uk. This results in an increase in monthly costs on standard loans. The Finance & Leasing Association has reported a decline in used-car finance volumes, citing the exit of entry-level buyers from the market. To sustain sales, dealers are absorbing rate buy-downs, which in turn pressures their gross margins. Additionally, negative equity on older ICE vehicles is making trade-ins more challenging.
Used-Car Prices Surge as New-Car Output Faces Crunch
Semiconductor shortages have disrupted new-car registrations in the United Kingdom, keeping them below typical levels. This has slowed fleet turnover and increased prices for newer vehicles. Transaction values have risen, with the sharpest increases observed in nearly-new cars. Despite these challenges, Vertu Motors improved its used gross margin, but affordability issues continue to exclude many price-sensitive households. A gradual improvement is expected as OEM production stabilizes over time.
*Our forecasts treat driver/restraint impacts as directional, not additive. The impact forecasts reflect baseline growth, mix effects, and variable interactions.
Segment Analysis
By Vendor Type: Organized Players Scale Through Digital and CPO
Independent, unorganized vendors, traditionally dominant in rural catchments and lower price bands, accounted for 58.23% of the United Kingdom's used car market size in 2025. However, their market share is steadily declining due to increasing compliance pressures. The CMA’s Phase 2 investigation into Constellation’s acquisition of Aston Barclay underscores the increasing regulatory scrutiny of auction consolidations. Larger players leverage scale advantages in data analytics, captive finance, and logistics, leaving smaller, fragmented traders increasingly at risk of losing market share.
Organized dealers captured 41.77% of the United Kingdom's used car market share in 2025; yet, the group is expected to add volume at a 12.82% CAGR through 2031, as certified-pre-owned schemes and nationwide digital storefronts build trust and convenience. This structural tailwind positions organized operators to undercut smaller rivals on nearly-new stock while monetizing finance and service add-ons.


By Vehicle Age: Nearly-New Stock Captures Premium Demand
Vehicles aged 3-5 years accounted for 34.28% of the United Kingdom used car market share in 2025, reflecting the traditional depreciation “sweet spot.” However, the United Kingdom used car market demand for 0-2 year models is rising fastest at a 12.43% CAGR through 2031, driven by short-cycle fleet returns and demonstrator oversupply.
Younger inventory benefits from full OEM warranty and eligibility for certified programs, supporting premium pricing and faster turns. In contrast, cars older than eight years face mounting urban access fees and higher insurance costs, which suppress their resale values despite their appeal to cash buyers outside city centers. Dealers are increasingly channeling high-mileage or non-compliant stock to export markets, thereby protecting domestic residuals.
By Fuel Type: Electrification Reshapes Powertrain Mix
Petrol cars still led the United Kingdom's used car market share in 2025, with 53.34%. Yet, BEVs are sprinting ahead with a 19.23% CAGR as infrastructure improves and warranty-supported battery health reports reduce buyer anxiety. The United Kingdom used car market size tied to electrified powertrains is expected to more than triple by 2031.
Diesel’s retreat quickens under Clean-Air Zone charges, while hybrids enjoy a hedge against range and refueling constraints. Export demand for diesel units to less-regulated regions partly cushions domestic price falls, but the long-term trajectory remains downward.
By Body Type: SUVs Gain Share Across Price Bands
Hatchbacks maintained the most significant share at 41.93% of the United Kingdom's used car market in 2025, due to their affordability and city-friendly footprint. However, SUV penetration is expected to accelerate at a 13.21% CAGR through 2031. Dealers such as Arnold Clark launched premium concepts to showcase high-margin SUVs and crossover BEVs, mirroring new-car preferences.
Sedans and MPVs continue to find niche demand. Yet, they suffer from limited automaker investment, while BEV-centric SUV models, such as the Tesla Model Y, improve residual performance relative to their same-segment petrol peers. The body-mix shift forces forecourt re-layout and stocking changes, emphasizing higher-ticket, tech-rich vehicles.
By Sales Channel: Digital Platforms Disrupt Traditional Dealers
Offline franchised dealerships accounted for 34.84% of the United Kingdom's used car market share in 2025, supported by service networks and OEM finance. Online-only channels, however, are growing at the fastest rate, with a 14.48% CAGR through 2031, driven by instant financing, transparent pricing, and doorstep delivery.
Private sales are on the decline as sellers opt for the speed of dealer-bidding platforms; independent forecourts must adopt omnichannel tools or risk ceding ground. Auto Trader’s data ecosystem and Carwow’s quality-score badges set new standards for digital trust, reshaping customer expectations.
By Ownership Type: First-Owner Vehicles Command Premium
First-owner cars represented 52.34% of the United Kingdom used car market share in 2025, and are expected to outpace the broader United Kingdom used car market at a 12.72% CAGR through 2031. Lenders prize the clearer history and lower risk profile, offering more favorable terms that widen the buyer pool.
Second-owner stock balances affordability and remaining warranty, while third-owner vehicles concentrate in cash-only, price-sensitive sub-segments. The ownership pattern is more pronounced in BEVs, where battery condition reports have a significant influence on finance approvals and resale valuations.

By Price Band: Premium Tier Expands Amid Bifurcation
Cars priced between USD 7,000 and 15,000 captured 39.87% of the United Kingdom's used car market share in 2025; however, the premium tier of USD 30,000 or more is expanding at a 13.73% CAGR through 2031, buoyed by luxury SUVs and near-new electric models. The United Kingdom used car market size for premium stock could double by the end of the forecast window.
Organized dealers invest in concierge-style showrooms and warranty packages to differentiate high-value inventory. Conversely, vehicles priced below USD 7,000 face a shrinking supply as elevated wholesale prices and reconditioning costs deter professional retailers, leaving unorganized operators to serve the lowest price segment.
Geography Analysis
England anchors the United Kingdom's used car market, holding an 80.34% share in 2025, supported by a dense dealer network, mature online platforms, and the most significant Clean-Air Zone footprint. Transaction velocity rises in metropolitan areas as ULEZ rules shorten the economic life of non-compliant engines, pushing residual premiums on Euro 6 petrol and diesel cars.
Scotland holds a significant share of the total volume and is experiencing strong growth. The enforcement of Low Emission Zones in Glasgow, Edinburgh, Aberdeen, and Dundee has driven faster replacement cycles, particularly for diesel cars subject to daily fines [3]“Low Emission Zone enforcement guidance,”, Transport Scotland, transport.gov.scot. Higher incomes in Edinburgh and Aberdeen support the demand for premium SUVs and the increased adoption of Battery Electric Vehicles (BEVs), primarily due to the traction needs during snowy conditions.
Northern Ireland, although currently holding a smaller market share, is showing the fastest growth momentum, with a 12.61% CAGR through 2031. Dealers in the region capitalize on the sterling-euro differential to import vehicles from mainland Britain and sell them across the open Irish border, where they are priced more competitively than in the domestic market. The region's port infrastructure simplifies logistics for these cross-channel transactions, and lower vehicle registration taxes attract buyers from the Republic of Ireland.
Wales, as the smallest market, is expected to see a shift towards compliant petrol, hybrid, and BEV models with the introduction of Cardiff's Clean-Air Zone. Rural driving patterns and limited fast-charging infrastructure have maintained a preference for petrol vehicles, but government grants for charger installations aim to address the infrastructure gap over time.
Competitive Landscape
In the United Kingdom used car market, the top organized players command a significant portion of the national volume. Auto Trader leverages its vast audience scale to create a proprietary data advantage, enhancing lead quality and pricing insights. Furthermore, the company's ongoing share buybacks reflect management's confidence in its sustained market dominance.
Constellation Automotive is pushing for deeper vertical integration. Its acquisition of Aston Barclay, a leading B2B auction operator, is under regulatory scrutiny due to concerns over potential wholesale price increases. In response, Stellantis and Cox Automotive have launched "Spoticar Trade," a pan-European digital auction designed to increase throughput and expand annual volumes over time.
Dealer groups are bolstering their positions with advanced technology. Vertu's real-time pricing engine has driven an increase in retail volume. Meanwhile, Arnold Clark introduced "Luxe" experiential stores, aiming for premium margins. Subscription models from companies like Onto and Wagonex are reshaping demand, turning vehicle ownership into monthly usage fees, accelerating vehicle turnover, and enhancing residual values.
Independent lots, often lacking a digital presence or in-house financing, are carving out their own niches. They're focusing on specialized imports, export channels, or budget-friendly cash segments to stay competitive. Given the ongoing consolidation, rising regulatory compliance costs, and a shift in customer preference towards transparent, warranty-backed transactions, larger players are poised for further share gains in the future.
United Kingdom Used Car Industry Leaders
-
Constellation Automotive Group Ltd
-
Arnold Clark Automobiles Ltd
-
Cazoo Group Ltd
-
Car Giant Ltd
-
Auto Trader Group plc
- *Disclaimer: Major Players sorted in no particular order

Recent Industry Developments
- January 2025: Arnold Clark unveiled a new luxury used-car division, aiming to tap into the surging demand for premium vehicles. This new sub-brand, part of the Arnold Clark Group, showcases a curated selection of luxury used cars from top-tier manufacturers like Aston Martin, Lamborghini, Bentley, and Land Rover, all conveniently housed under one roof.
- January 2025: Carwow introduced a subscription model for dealers, marking a shift toward services that generate recurring revenue.


Research Methodology Framework and Report Scope
Market Definitions and Key Coverage
Our study views the United Kingdom used car market as the total annual value of passenger cars that have had at least one registered keeper and are resold through online portals, franchised or independent dealers, auctions, and private listings. Units imported from outside the UK are counted once registered domestically, and values are expressed in constant 2025 US dollars.
Scope exclusion: Vehicles sold only for parts or scrappage and light commercial vans fall outside this coverage.
Segmentation Overview
-
By Vendor Type
- Organized
- Unorganized
-
By Vehicle Age
- 0 - 2 Years
- 3 - 5 Years
- 6 - 8 Years
- More than 8 Years
-
By Fuel Type
- Petrol
- Diesel
- Hybrid
- Battery Electric
- Plug-in Hybrid
- Other Alt-Fuels (CNG/LPG)
-
By Body Type
- Hatchback
- Sedan
- Sport Utility Vehicle (SUV)
- Multi-Purpose Vehicle (MPV)
-
By Sales Channel
- Online
- Offline - Franchised Dealers
- Offline - Independent Dealers
- Private-to-Private
-
By Ownership Type
- First-Owner
- Second-Owner
- Third-or-More Owners
-
By Price Band
- Less than USD 7,000
- USD 7,001 - USD 15,000
- USD 15,000 - USD 30,000
- More than 30,000
-
By Region
- England
- Scotland
- Wales
- Northern Ireland
Detailed Research Methodology and Data Validation
Primary Research
Conversations with dealer groups, auction houses, financing intermediaries, and online marketplace managers across England, Scotland, and Wales allowed us to validate assumed average selling prices, warranty uptake, and digital channel penetration. Follow-up e-mail surveys with trade associations helped refine disposal age curves and discount structures.
Desk Research
We began with transport and taxation datasets published by the DVLA, quarterly transfer volumes from the Society of Motor Manufacturers and Traders, trade data in the UN Comtrade portal, and price trend indices released by Auto Trader and CAP-HPI. Company filings lodged at Companies House and policy notes from HM Treasury complemented the view. Subscription resources such as D&B Hoovers and Dow Jones Factiva helped us cross-check dealer revenues and transaction news. The sources listed illustrate the evidence base and are not exhaustive.
The secondary work clarified historical unit flows, ownership churn, and average resale prices, yet it only set the foundation; therefore, our analysts leaned heavily on field inputs to finish the picture.
Market-Sizing & Forecasting
A top-down framework converts DVLA ownership transfers into a demand pool, which is then priced using weighted average selling prices by fuel type and vehicle age. Selective bottom-up checks, dealer roll-ups and sampled auction hammer prices, anchor the totals. Key variables include new-to-used churn ratio, inflation-adjusted ASP, battery electric share, average holding period, and finance penetration. Forecasts rely on a multivariate regression that links those drivers with GDP per capita and new-car registration outlooks, and results are stress-tested with three scenario bands before sign-off.
Data Validation & Update Cycle
Outputs run through variance checks against import statistics, price trackers, and lender repossession data. Any anomaly is escalated to a second analyst, and the model is refreshed every twelve months, with interim revisions triggered by tax-rate changes or sizable M&A deals.
Why Our UK Used Car Baseline Earns Trust
Published values often diverge because firms frame the marketplace differently, apply distinct unit-price ladders, or refresh numbers on uneven timetables.
Key gap drivers include whether private-to-private deals are counted, the currency conversion year, and how organized dealer premiums are projected. Mordor's model, which blends unit transfers with live ASP evidence and updates annually, avoids under-reporting quick-turn private sales and over-stating dealer margins that some sources embed.
Benchmark comparison
| Market Size | Anonymized source | Primary gap driver |
|---|---|---|
| USD 103.89 B (2025) | Mordor Intelligence | - |
| USD 81.45 B (2024) | Global Consultancy A | Excludes peer-to-peer trades, older than a year |
| USD 36.07 B (2025) | Trade Journal B | Focuses only on organized dealer revenue |
| USD 75.6 B (2025) | Regional Analytics C | Uses retail price index without transaction volume cross-check |
These contrasts show that when scope breadth, pricing realism, and refresh cadence are harmonized, as Mordor analysts routinely ensure, decision-makers receive a balanced baseline they can reproduce and defend during planning discussions.


Key Questions Answered in the Report
What is the current value of the United Kingdom used car market?
The market is valued at USD 116.51 billion in 2026 and is forecast to reach USD 206.71 billion by 2031.
Which vehicle age bracket is growing fastest in UK used-car demand?
Nearly-new cars aged 0-2 years are expanding at a 12.43% CAGR, driven by ex-demonstrators and short-lease returns.
How quickly are online-only platforms gaining share?
Transactions completed through online-only channels are rising at a 14.48% CAGR, outpacing all other sales formats.
What is driving the surge in used battery-electric vehicle uptake?
Residual-value guarantees, warranty-backed battery-health reports, and wider charging infrastructure are pushing BEV demand up at a 19.23% CAGR.
Which UK region shows the fastest used-car market growth?
Northern Ireland leads with a projected 12.61% CAGR through 2031, supported by cross-border trade advantages.
Page last updated on:


