United States Wedding Services Market Size and Share
Market Overview
| Study Period | 2021 - 2031 |
|---|---|
| Forecast Data Period | 2026 - 2031 |
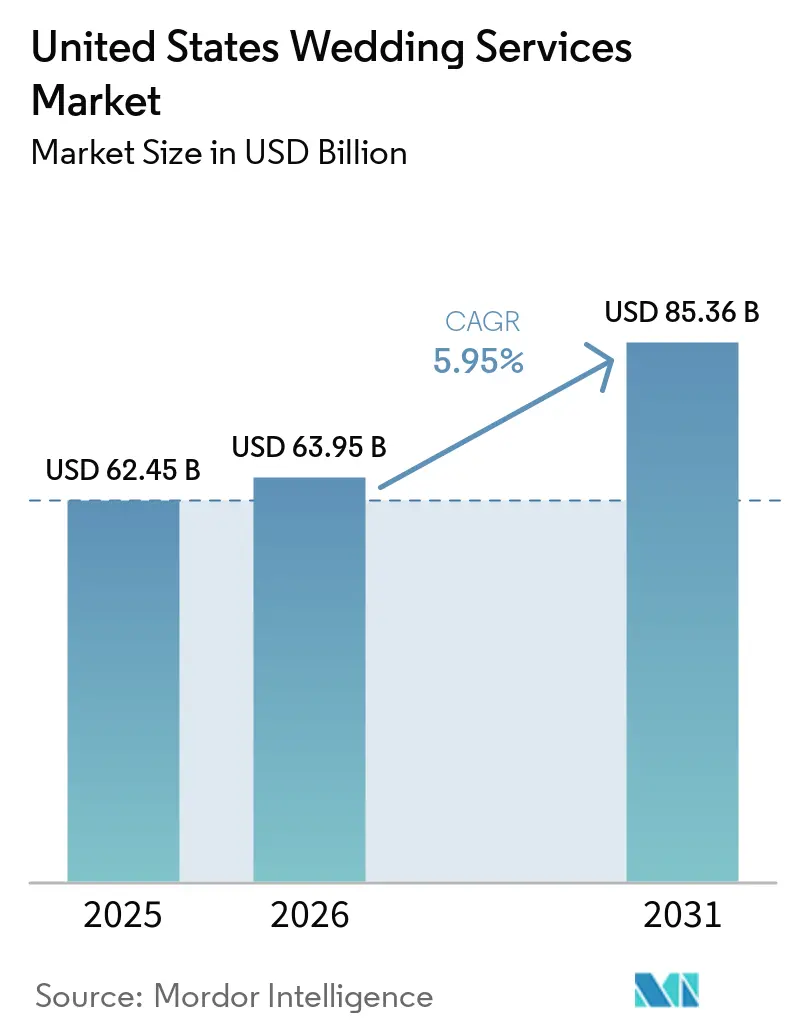
| Base Year Market Size (2025) | USD 62.45 Billion |
| Market Size (2026) | USD 63.95 Billion |
| Market Size (2031) | USD 85.36 Billion |
| Growth Rate (2026 - 2031) | 5.95% CAGR |
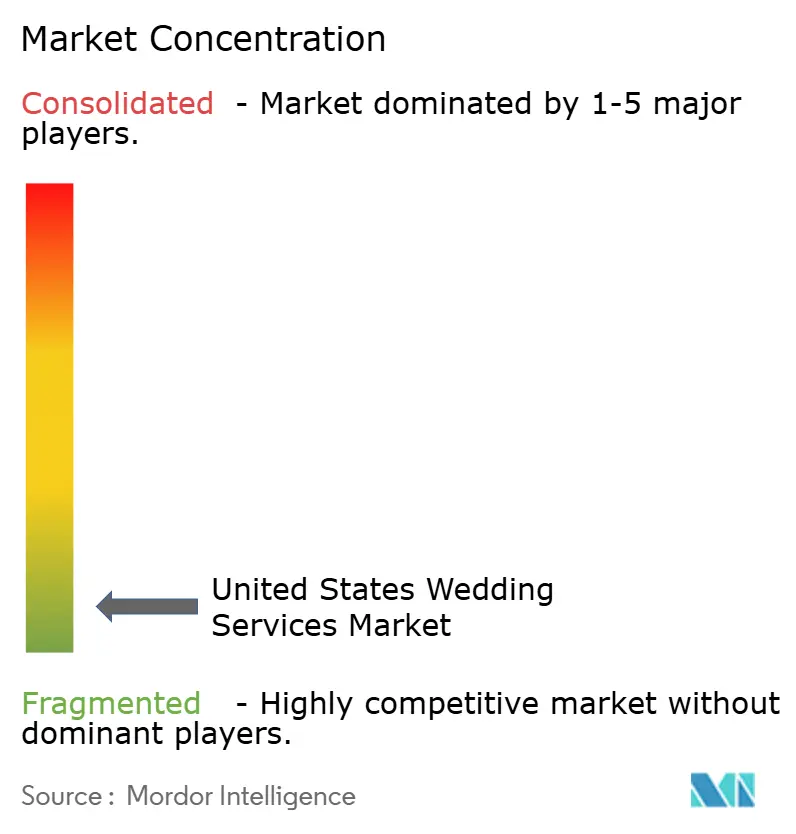
| Market Concentration | Low |
Major Players *Disclaimer: Major Players sorted in no particular order Image © Mordor Intelligence. Reuse requires attribution under CC BY 4.0. | |
United States Wedding Services Market Analysis by Mordor Intelligence
The United States Wedding Services market is expected to grow from USD 62.45 billion in 2025 to USD 63.95 billion in 2026 and is forecast to reach USD 85.36 billion by 2031 at 5.95% CAGR over 2026-2031. Nearly 2 million couples married in 2025, spending an average of USD 34,000 on ceremonies and receptions. Experience-focused celebrations are driving growth, with 71% of 2025 weddings spanning 2-3 days, increasing vendor revenues in planning, catering, and hospitality. Gen Z accounted for 41% of weddings and showed a 54% adoption rate of AI planning tools among 2026 couples. A market divide exists between higher-spending Millennials preferring full-service planning and budget-conscious younger couples opting for digital tools and non-traditional venues. Vendors are adjusting pricing and services to meet these demands. Despite cost pressures and seasonal crowding, the market remains resilient as couples prioritize wedding spending, reallocate savings from ring purchases, and focus on celebrations with personal and social significance[1]The Knot Worldwide, “The Knot Worldwide Unveils 2026 Real Weddings Study,” The Knot Worldwide, theknotww.com.
Key Report Takeaways
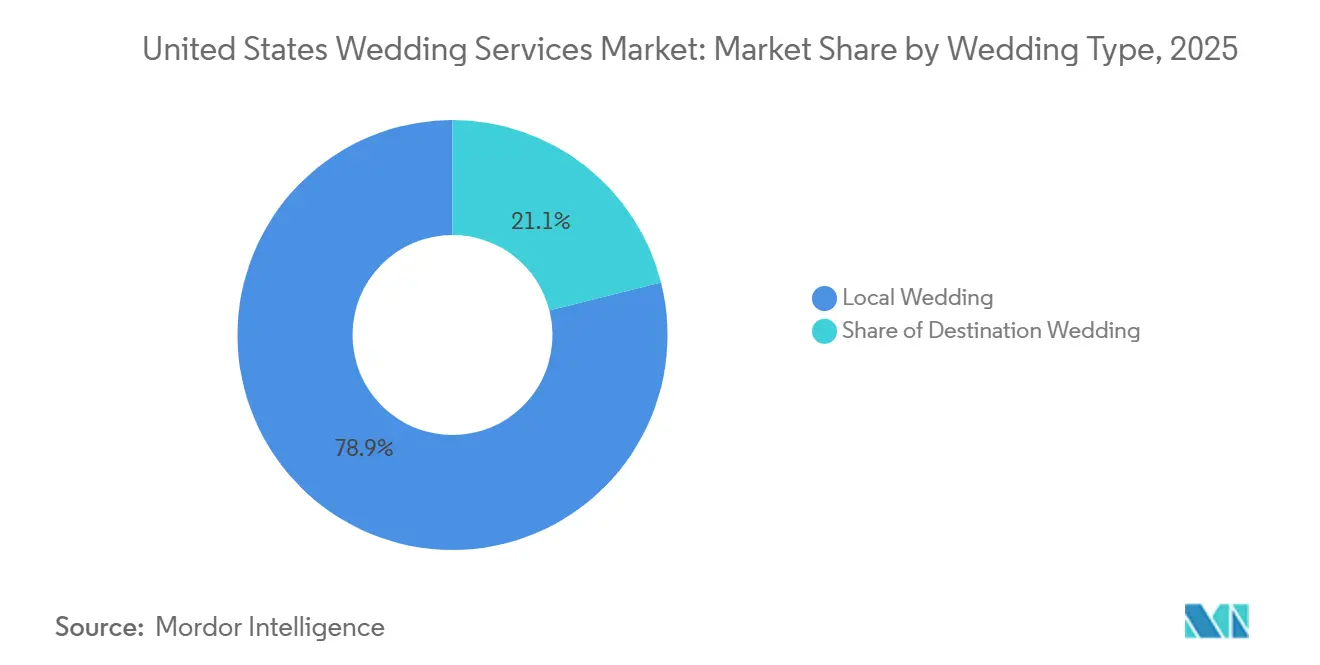
- By wedding type, Local Weddings held 78.93% share of the United States Wedding Services Market in 2025, while Destination Weddings are projected to grow at a 6.57% CAGR through 2031.
- By booking mode, Offline Booking held 68.21% share of the United States Wedding Services Market in 2025, while Online Booking is projected to grow at a 7.46% CAGR through 2031.
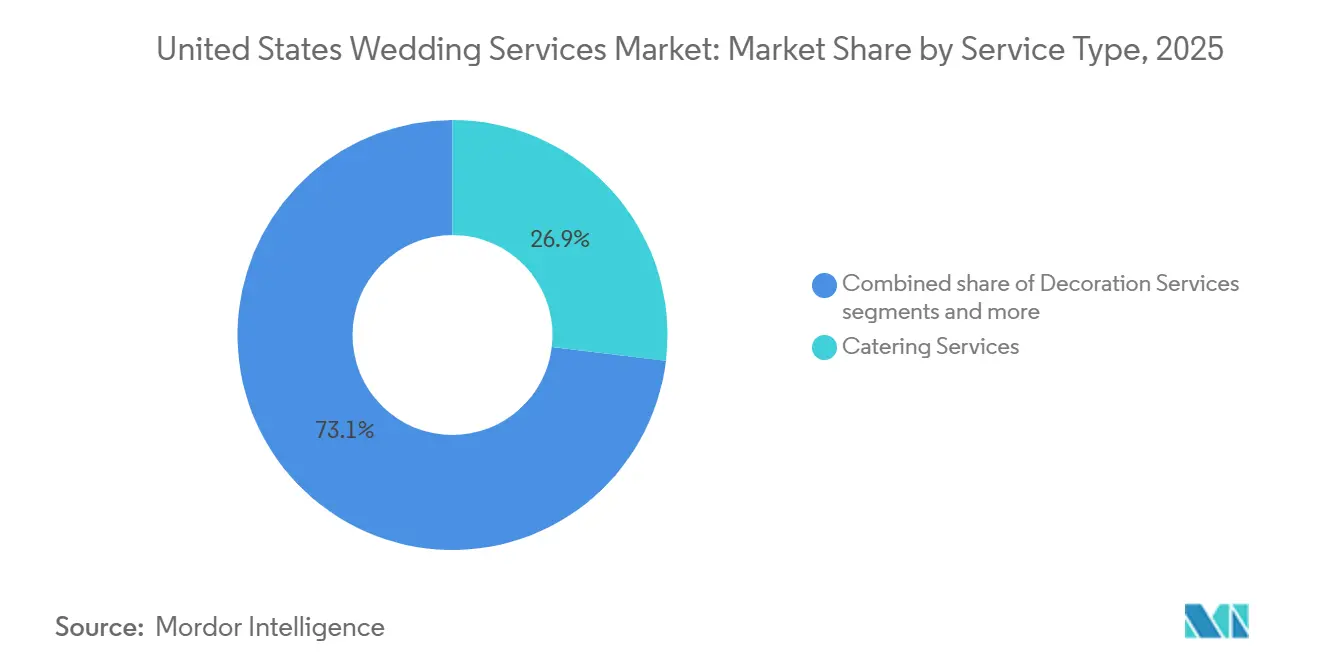
- By service type, Catering Services held 26.91% share of the United States Wedding Services Market in 2025, while Wedding Planning Services are projected to grow at a 7.24% CAGR through 2031.
- By planning scope, Partial Planning held 46.62% share of the United States Wedding Services Market in 2025, while Full-Service Planning is projected to grow at a 6.49% CAGR through 2031.
- By price tier, Mid-Market held 55.84% share of the United States Wedding Services Market in 2025, while Luxury and Premium weddings are projected to grow at a 6.92% CAGR through 2031.
Note: Market size and forecast figures in this report are generated using Mordor Intelligence’s proprietary estimation framework, updated with the latest available data and insights as of January 2026.
United States Wedding Services Market Trends and Insights
Drivers Impact Analysis*
| Drivers | (~) % Impact on CAGR Forecast | Geographic Relevance | Impact Timeline |
|---|---|---|---|
| Personalized and experience-led celebrations | +1.5% | National, with early gains in urban corridors such as New York City, Los Angeles, Chicago, Nashville, and Austin | Medium term (2-4 years) |
| Destination wedding migration within the United States | +0.9% | South and West, with spillover to Mountain and Plains states | Medium term (2-4 years) |
| Online discovery and booking platform adoption | +0.8% | National, with urban and suburban markets leading | Short term (≤ 2 years) |
| Greater planner usage for execution certainty | +0.6% | National, with concentration in Millennial and dual-income urban markets | Medium term (2-4 years) |
| Multi-day wedding formats lift vendor wallet share | +0.7% | National, with destination, luxury, and resort corridors leading | Medium term (2-4 years) |
| Lab-grown ring savings reallocated to wedding experiences | +0.5% | National, strongest in Gen Z-led markets | Short term (≤ 2 years) |
| Source: Mordor Intelligence | |||
Personalized and experience-led celebrations
Couples in the United States wedding services market are shifting away from traditional ceremonies and receptions, focusing instead on personal identity, guest experience, and visual uniqueness. Many couples incorporate religious, ethnic, or cultural elements, choose eco-friendly suppliers, or source locally produced products. These preferences expand vendor requirements, as they demand customized food, design, entertainment, and sourcing instead of standard packages. The average number of vendors hired has increased, with guest experience consistently ranked as the top planning priority, driving higher service intensity across the market. Couples are also contacting more venues before making a decision, reflecting a growing emphasis on selectivity over price comparison[2]WeddingPro, “Navigating a New Era, Venue Insights from The Knot's 2026 Real Weddings Study,” WeddingPro, pros.weddingpro.com.
Destination wedding migration within the United States
Domestic destination weddings are transitioning from a niche option to a broader demand, driving spending toward resorts, lodging, and integrated event markets. Reports indicate that many couples are choosing United States locations over international venues for destination ceremonies. This trend significantly impacts the United States wedding services market, as destination weddings often include additional events like welcome dinners, rehearsal gatherings, and farewell brunches alongside the main ceremony and reception. These added elements increase revenue opportunities for planners, caterers, venue operators, and hotel-linked providers[3]Honeyfund, “2026 Honeymoon and Wedding Travel Trends Report,” Honeyfund, honeyfund.com. Markets that combine accommodation, event management, and local experience design into a cohesive offering are positioned to benefit the most.
Online Discovery and Booking Platform Adoption Reshapes Lead Generation
The United States wedding services market is increasingly adopting digital-first approaches for vendor discovery. Couples are using AI tools, mobile content, and platform searches to streamline planning. AI usage in wedding planning has grown significantly, with tools like The Knot's "Make It Yours," launched in 2025, which matches couples with vendors based on style and location. By 2026, The Knot also introduced an app within ChatGPT. Zola reported TikTok's growing influence as a planning resource, with more couples relying on it and requesting social-focused content from photo and video vendors. These trends are improving transparency, expanding vendor reach, and strengthening the role of online bookings in the market.
Greater planner usage for execution certainty
Planner demand is rising as weddings become more complex, involving additional events, vendors, and heightened expectations for quality and guest experience. Millennial couples have shown a greater tendency to hire professional planners compared to Gen Z couples, driven by higher spending and a greater share of self-funding. This has increased the appeal of professional coordination for managing vendors. Although many couples now use AI for planning tasks, the role of planners continues to expand, demonstrating that automation supports rather than replaces their services. In the United States wedding services market, planners are increasingly focused on negotiation, timeline management, and day-of execution, moving beyond initial planning stages.
Restraints Impact Analysis*
| Restraints | (~) % Impact on CAGR Forecast | Geographic Relevance | Impact Timeline |
|---|---|---|---|
| Wedding budget inflation and affordability pressure | -1.2% | National, with the highest impact in Northeast and Mid-Atlantic premium markets | Short term (≤ 2 years) |
| Seasonal demand concentration and weather disruption | -0.6% | National, with off-peak regions such as the Midwest and Mountain states most exposed | Short term (≤ 2 years) |
| Price-transparency-driven vendor comparison pressure | -0.5% | National, strongest in urban markets with high platform penetration | Short term (≤ 2 years) |
| Shorter booking windows strain premium vendor capacity | -0.4% | National, with the highest impact in peak-demand markets such as New York City, Los Angeles, Washington DC, and Chicago | Short term (≤ 2 years) |
| Source: Mordor Intelligence | |||
Wedding budget inflation and affordability pressure
Budget constraints significantly impact the United States wedding services market as rising event costs outpace couples' financial capacities. Venue expenses increased substantially between 2015 and 2025, alongside notable growth in catering costs. By 2025, over half of couples reported exceeding their budgets, with most citing economic conditions as a key factor influencing their planning. Many couples delayed financial goals to fund weddings, including home purchases and debt repayment. High-cost regions, such as the Mid-Atlantic, saw average wedding spending reach significant levels, prompting some couples to opt for smaller guest lists, more affordable locations, or simplified event formats.
Seasonal demand concentration and weather disruption
The United States Wedding Services Market relies on a limited seasonal window, causing uneven revenue distribution and increased disruption risks. Most weddings occur between May and October, with October and June being the busiest months. This seasonal concentration strains vendor staffing, venue availability, and logistical planning, reducing operational flexibility. Outdoor venues and destination properties face higher risks, as weather events such as storms, hurricanes, and wildfires can disrupt events, deposits, and schedules during peak months. Additionally, Saturday weddings are priced significantly higher compared to weekdays, reflecting demand patterns.
*Our forecasts treat driver/restraint impacts as directional, not additive. The impact forecasts reflect baseline growth, mix effects, and variable interactions.
Segment Analysis
By Wedding Type: Local Ceremonies Anchor Revenue as Domestic Destination Momentum Builds
In 2025, local weddings accounted for 78.93% of the revenue in the United States Wedding Services Market. Couples continue to prefer local celebrations, drawn by the proximity to family, familiar vendors, and reduced travel complexities. With nearly 2 million weddings in the United States that year, local events ensured a steady stream of bookings for venues, caterers, entertainment providers, and photographers, all benefiting from consistent regional demand. The stability of this segment of the United States Wedding Services industry stems from its broad-based spending, rather than reliance on a niche premium clientele. Local weddings enjoy advantages like simpler guest logistics and reduced accommodation needs, allowing couples to allocate more of their budget to décor, food, entertainment, and photography. This dynamic explains the enduring prominence of hometown and regional celebrations, even as destination weddings gain traction.
Destination weddings are on the rise, projected to grow at a 6.57% CAGR through 2031, outpacing the overall United States wedding services market. Couples planning for 2026 are increasingly opting for destination weddings, with popular locations including Florida, California, and Hawaii. These weddings typically feature smaller guest lists but involve higher spending per guest due to multiple events surrounding the main ceremony. The United States wedding market for destination ceremonies often includes welcome dinners, farewell brunches, and hospitality packages, driving up costs for planners and caterers. Providers of lodging, venue management, and planning services are well-positioned to capture a larger share of these celebrations.


By Booking Mode: Offline Channels Retain Scale While Online Accelerates Structurally
Offline bookings represented 68.21% of revenue in 2025, reflecting the United States Wedding Services market's reliance on in-person trust, venue tours, and direct planner interactions. Around 83% of couples prioritized venue visits, and 89% chose professionally managed venues, emphasizing the importance of physical evaluations in high-value purchases. Family involvement in budget and style discussions further reinforces the need for face-to-face interactions. Final conversions often occur after tours, calls, and consultations rather than through digital checkouts, explaining the dominance of offline bookings despite the growing role of digital discovery.
Online bookings are projected to grow at a 7.46% CAGR through 2031, making them the fastest-growing channel in the United States wedding services market. Platforms like The Knot connect couples with nearly 200,000 wedding professionals, while Zola has generated over 4 million vendor leads. AI tools are driving this shift by assisting with etiquette queries, timeline planning, and vendor communication drafts before direct contact[4]Zola, Inc., “Zola Honors Top Wedding Vendors Nationwide with the 2026 Best of Zola Awards,” PR Newswire, prnewswire.com. The hybrid model, where couples research and compare online but confirm decisions through calls, visits, or planner support, is reshaping lead generation, response expectations, and vendor marketing across the market.
By Service Type: Catering Leads by Spend While Planning Services Lead Growth
Catering Services captured 26.91% of revenue in 2025, making food and beverage the largest segment in the United States wedding services market due to its essential role in local and destination weddings. Catering also serves as a personalization category, with menu design, local sourcing, and cultural preferences shaping guest experiences. Decoration Services and Entertainment and Music follow closely, as couples prioritize immersive settings and visual storytelling. Photography remains a key expense, with 87% of couples hiring photographers in 2025, maintaining its position as a consistent vendor category. Core event execution continues to dominate spending, even as newer experiential categories gain traction.
Wedding Planning Services are projected to grow at a 7.24% CAGR through 2031, driven by trends like multi-day events, destination planning, and larger vendor teams requiring coordination. In 2025, Millennial couples were more likely than Gen Z couples to hire planners, supporting growth in planning services. Other Services, including floral design, transportation, beauty, and wellness, are also gaining importance, with couples spending an average of USD 1,100 on pre-wedding wellness routines. As events become more complex, planners play a central role in vendor coordination and budget management in the United States wedding services market.
By Planning Scope: Partial Planning Holds the Core While Full-Service Gains Ground
Partial Planning accounted for 46.62% of revenue in 2025, making it the largest planning scope. Many couples prefer this option for external support while maintaining creative control. It suits those capable of handling online research and early coordination but needs help with contracts, schedules, and event-day risks. Younger couples, comfortable with planning platforms and AI tools, often choose this model to avoid managing final execution alone. Partial Planning also appeals to the mid-market by balancing cost control with reduced operational strain, keeping it central to planner demand in the United States Wedding Services Market.
Full-Service Planning is projected to grow at a 6.49% CAGR through 2031 as complexity increases and higher-spending couples seek execution certainty. Day-of Coordination remains relevant for budget-conscious, self-planning couples but loses utility with additional events or destination logistics. Recent reports say that 37% of couples now host at least one extra event, and 18% extend celebrations over 2 to 3 days, driving a shift from minimal coordination models. The transition from Day-of Coordination to Partial and Full-Service Planning aligns with increased spending, more vendors, and greater guest management needs. Even as couples begin with digital self-service tools, demand for planners continues to grow in the United States Wedding Services Market.
By Price Tier: Mid-Market Retains Scale While Luxury and Premium Expand Faster
The Mid-Market segment accounted for 55.84% of revenue in the United States wedding services market in 2025, appealing to couples between budget and high-end spending. Average wedding expenses reached USD 34,000, aligning with this tier's demand. Zola reported wedding costs remained near USD 36,000 in 2026 for the second year, though 84% of couples believed costs had risen compared to two years earlier. This sustained demand pressures value perception, vendor bundling, and selective upgrades. Budget-tier weddings remained active, supported by non-traditional venues, DIY elements, and informal networks, with 44% of couples incorporating DIY aspects in 2025.
Weddings exceeding USD 41,000 are projected to grow at a 6.92% CAGR through 2031, reflecting resilience among higher-income households. In 2025, these weddings hosted an average of 141 guests, with family contributions covering 62% of costs. Spending in this segment often includes upgrades across vendor categories, driving higher pricing for services such as planning, venues, design, and photography. Meanwhile, lower-budget couples consolidated spending and relied more on digital tools, intensifying competition for mid-tier providers. This growing divide between scale-driven and high-spending vendor strategies is shaping the United States wedding services market.
Geography Analysis
The South accounted for 34.49% of the United States Wedding Services Market revenue in 2025, driven by high marriage volumes and affordable venues in Florida, Texas, Georgia, North Carolina, and Tennessee. Florida's resort areas, such as Orlando, Miami, and the Gulf Coast, catered to local and destination weddings. Wedding spending in the South ranged from USD 25,000 to USD 35,000, appealing to budget-conscious couples seeking professional services. Wedgewood Weddings expanded in the region with a North Carolina venue in May 2025 and an Atlanta acquisition in December 2025. The Midwest maintained steady demand due to lower event costs, attracting self-funded couples valuing practical spending and vendor options.
The West is projected to grow at a 7.85% CAGR through 2031, supported by destination demand in Las Vegas, Utah, Arizona, coastal California, and nearby scenic locations. California attracted nationwide spending, while Las Vegas offered scalable wedding venues with its dense hotel and event infrastructure. Marriott Bonvoy's integration of 16 properties, later expanded to 17 United States resorts, enhanced the region's destination wedding appeal. The West combines destination growth with pricing flexibility, differing from the South's price-sensitive market.
The Northeast recorded the highest wedding spending per event in 2025, with the Mid-Atlantic averaging USD 48,400 and New England USD 46,600. Urban centers like New York City, Washington DC, Boston, and New Jersey supported a dense ecosystem of planners, caterers, and venues. New Jersey had the highest average wedding cost in 2024 at nearly USD 57,000. Despite affordability challenges, the region remains vital for high-spend weddings and complex event planning due to its revenue density during peak seasons.
Competitive Landscape
The United States wedding services market is highly fragmented, with the top players holding a small share of total revenue, and no single operator dominating. Couples prioritize aesthetic fit, geography, referrals, and service style over national brands, resulting in a market divided among digital platforms, venue groups, independent planners, and specialized vendors. Knot Worldwide maintains visibility through its marketplace reach and annual couple sign-ups, while Zola expands its role with planning tools, registry services, and vendor lead generation. Competition remains broad, allowing regional specialists to compete through service quality and relationships.
Platform competition is intensifying as online discovery accelerates and AI tools centralize vendor selection. The Knot’s recent launches and its ChatGPT app debut illustrate efforts to shape early planning behavior. Zola’s tools and editorial updates emphasize planning utility over directory size. Independent vendors remain relevant due to the personal nature of wedding decisions but face pressure to enhance visibility in platform and AI-driven searches. Responsiveness, brand clarity, and niche specialization are increasingly critical.
Venue consolidation is more evident than overall market consolidation. Wedgewood Weddings expanded through acquisitions in multiple regions over the past two years. Marriott International and MGM Resorts launched a collaborative collection and debuted a new venue. Disney added several in-park wedding venues at its resort. Independent luxury planners continue to compete on exclusivity and reputation. National visibility and venue aggregation are growing, but local execution remains key.
United States Wedding Services Industry Leaders
The Knot Worldwide
Marriott Bonvoy Weddings
MGM Resorts Weddings
Zola, Inc.
Wedgewood Weddings
- *Disclaimer: Major Players sorted in no particular order

Recent Industry Developments
- April 2026: Zola, in partnership with Poshmark, released its 2026 Wedding Style Report, emphasizing the growing trend of personalized weddings. This reflects modern couples' preference for unique celebrations and reinforces Zola's role in bridal planning.
- February 2026: The Knot Worldwide introduced the first wedding industry app within ChatGPT, marking a significant milestone in AI distribution. This integration establishes The Knot as the primary AI-driven wedding planning tool in ChatGPT, offering a competitive advantage over smaller vendors and platforms.
- January 2026: Zola released its 2026 First Look Report on Gen Z wedding trends, budgets, AI adoption, and social media-driven planning, along with a 2026 Wedding Cost Index offering city-specific pricing benchmarks.
- December 2025: Wedgewood Weddings expanded its portfolio to over 80 venues by acquiring five Atlanta-area locations from Magic Moments Events: Primrose Cottage, Flint Hill, The Atrium, Vinewood Stables, and Natalie House, along with A Divine Event, a design studio in Norcross, Georgia, entering the South's largest metropolitan wedding market.


United States Wedding Services Market Report Scope
| Local Wedding |
| Destination Wedding |
| Online Booking |
| Offline Booking |
| Catering Services |
| Decoration Services |
| Entertainment & Music |
| Videography & Photography Services |
| Wedding Planning Services |
| Other Services |
| Full-Service Planning |
| Partial Planning |
| Day-Of Coordination |
| Luxury / Premium |
| Mid-Market |
| Value / Budget |
| Northeast |
| Midwest |
| South |
| West |
| By Wedding Type | Local Wedding |
| Destination Wedding | |
| By Booking Mode | Online Booking |
| Offline Booking | |
| By Service Type | Catering Services |
| Decoration Services | |
| Entertainment & Music | |
| Videography & Photography Services | |
| Wedding Planning Services | |
| Other Services | |
| By Planning Scope | Full-Service Planning |
| Partial Planning | |
| Day-Of Coordination | |
| By Price Tier | Luxury / Premium |
| Mid-Market | |
| Value / Budget | |
| By Region | Northeast |
| Midwest | |
| South | |
| West |


Key Questions Answered in the Report
What is the size outlook for wedding services in the United States through 2031?
The United States Wedding Services Market was valued at USD 62.45 billion in 2025, reaches USD 63.95 billion in 2026, and is projected to reach USD 85.36 billion by 2031 at a 5.95% CAGR.
Which service category generates the most revenue?
Catering Services led with 26.91% of revenue in 2025 because food and beverage remains central to both local and destination weddings.
Which booking channel is growing the fastest?
Online Booking is projected to grow at a 7.46% CAGR through 2031 as AI tools and platform-based vendor discovery keep gaining adoption.
Which region leads revenue and which region grows the fastest?
The South led with 34.49% of revenue in 2025, while the West is projected to grow the fastest at a 7.85% CAGR through 2031.
Why are planners gaining importance in weddings?
Planner demand is increasing because events now involve more vendors, more multi-day formats, and more execution pressure, which helped Wedding Planning Services become the fastest-growing service segment at 7.24% CAGR.
How concentrated is competition among wedding service providers?
Competition is highly fragmented, with the top 5 players holding only 5.40% of revenue and no single player exceeding 1.80%, which keeps local and niche specialists relevant.
Page last updated on:


