Family Entertainment Center Market Size and Share
Market Overview
| Study Period | 2021 - 2031 |
|---|---|
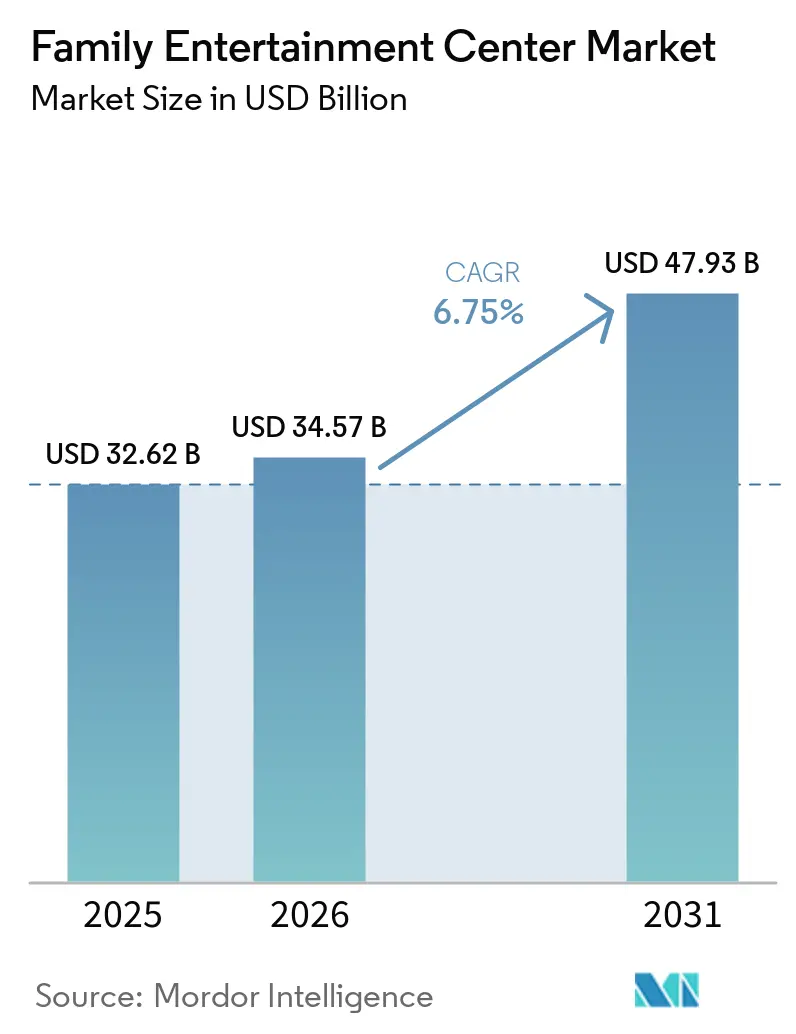
| Market Size (2026) | USD 34.57 Billion |
| Market Size (2031) | USD 47.93 Billion |
| Growth Rate (2026 - 2031) | 6.75% CAGR |
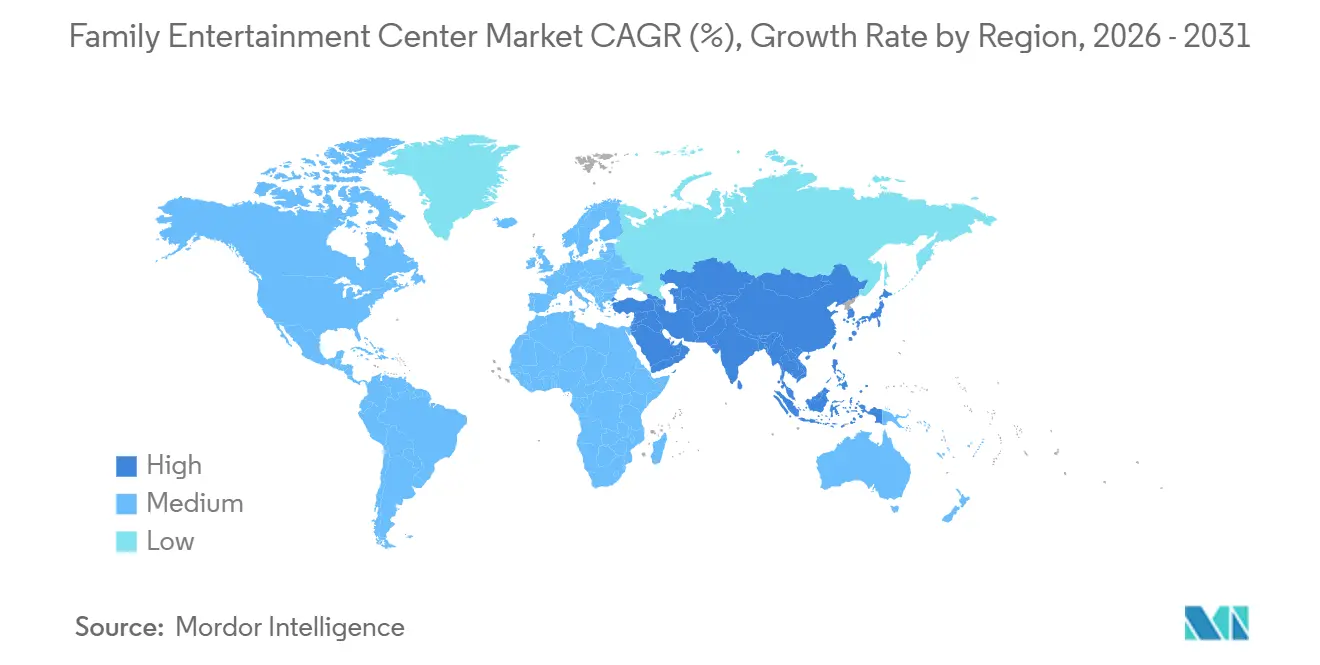
| Fastest Growing Market | Asia-Pacific |
| Largest Market | North America |
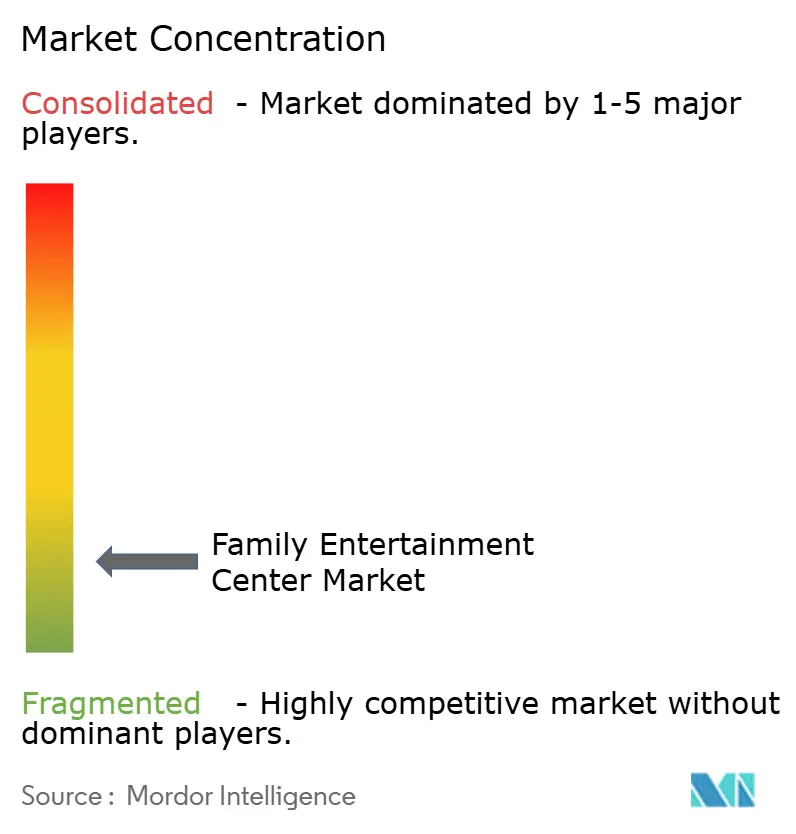
| Market Concentration | Low |
Major Players *Disclaimer: Major Players sorted in no particular order Image © Mordor Intelligence. Reuse requires attribution under CC BY 4.0. | |
Family Entertainment Center Market Analysis by Mordor Intelligence
The Global Family Entertainment Center Market was valued at USD 32.62 billion in 2025 and estimated to grow from USD 34.57 billion in 2026 to reach USD 47.93 billion by 2031, at a CAGR of 6.75% during the forecast period (2026-2031). Recovery in discretionary leisure spending and a shift toward participatory and social formats are driving this growth. Global visits to location-based entertainment and theme parks reached 1.15 billion in 2025, generating USD 79.2 billion in revenue, supporting strong demand for indoor operators reliant on repeat visits rather than seasonal spikes[1]IAAPA, “State of the Global Attractions Industry – Q3 2025,” IAAPA, iaapa.org. The market benefits from weather-proof operations, steady group event demand, and the ability to monetize multiple spending categories per visit. Advances in AR and VR, expansion into mixed-use sites, and increased food and beverage integration are attracting a broader audience. Despite challenges such as rising insurance costs and imported equipment inflation, the market remains resilient. Indoor formats continue to provide social and physical experiences that home-based digital alternatives cannot fully replicate.
Key Report Takeaways
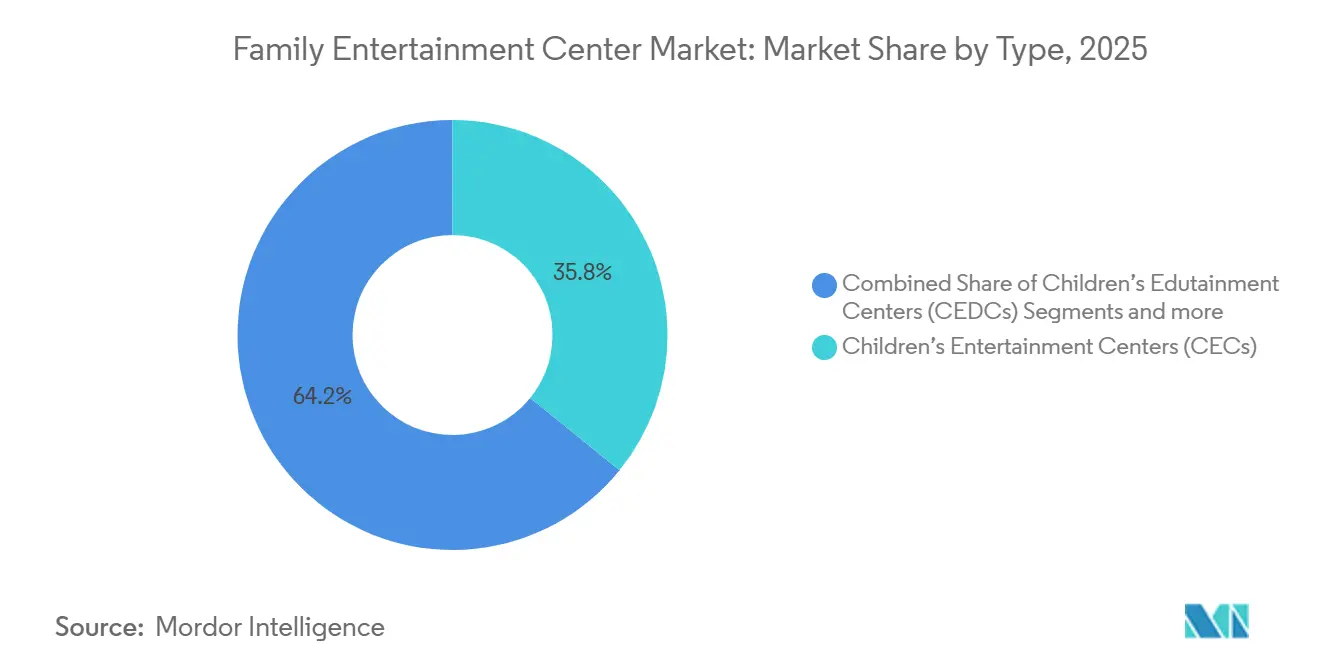
- By type, Children's Entertainment Centers led with 35.83% share of the Global Family Entertainment Center Market in 2025, while Location-based VR Entertainment Centers are projected to expand at a 7.80% CAGR through 2031.
- By activity area, Skill and Competition Games accounted for 40.21% share of the Global Family Entertainment Center Market in 2025, while AR and VR Gaming Zones are forecast to grow at an 8.17% CAGR through 2031.
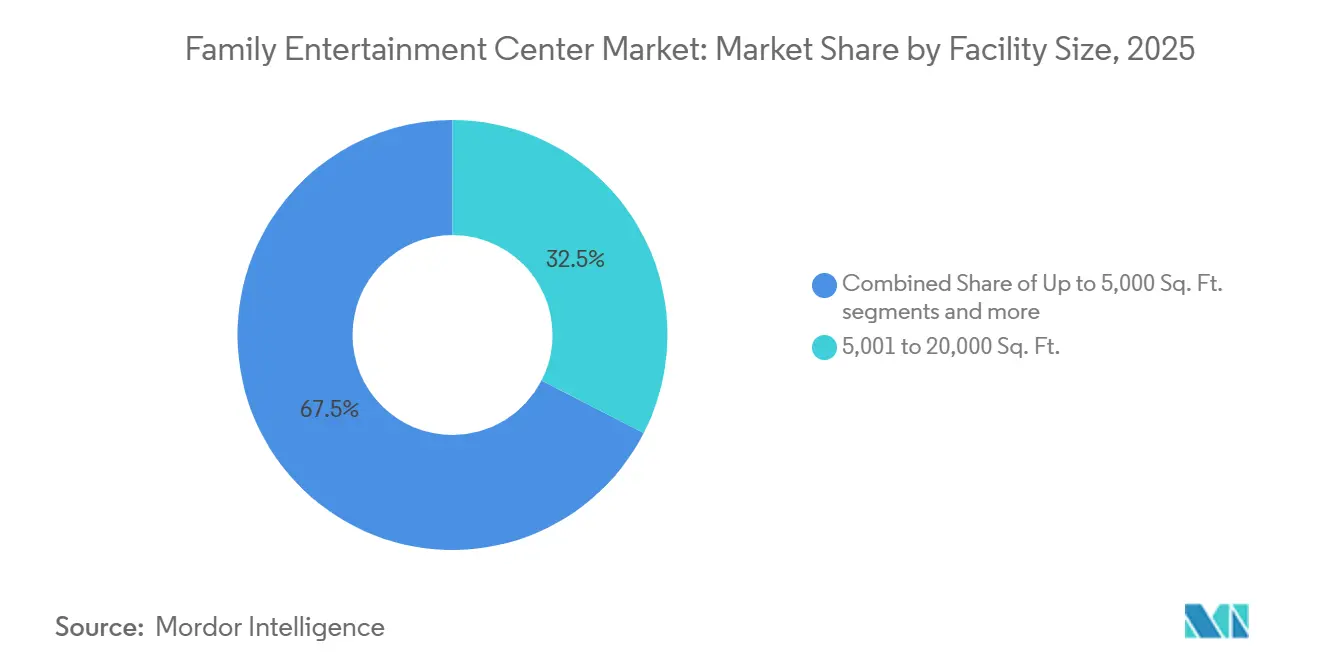
- By facility size, the 5,001-20,000 sq. ft. tier held 32.54% share of the Global Family Entertainment Center Market in 2025, while the 1-to-10-acre format is projected to advance at a 7.43% CAGR through 2031.
- By visitor demographics, Families with Children aged 0-8 represented 31.93% share of the Global Family Entertainment Center Market in 2025, while Teenagers aged 13-19 are forecast to grow at a 7.32% CAGR through 2031.
- By revenue source, Entry Fees and Ticket Sales captured 44.23% share of the Global Family Entertainment Center Market in 2025, while Food and Beverages is projected to expand at a 7.65% CAGR through 2031.
- By geography, North America held 34.47% share of the Global Family Entertainment Center Market in 2025, while Asia-Pacific is forecast to grow at an 8.36% CAGR through 2031.
Note: Market size and forecast figures in this report are generated using Mordor Intelligence’s proprietary estimation framework, updated with the latest available data and insights as of January 2026.
Global Family Entertainment Center Market Trends and Insights
Drivers Impact Analysis*
| Drivers | (~) % Impact on CAGR Forecast | Geographic Relevance | Impact Timeline |
|---|---|---|---|
| Experience-led family and group leisure demand | +2.0% | Global, strongest in North America and Europe | Short term (≤ 2 years) |
| AR/VR-enabled attraction refresh | +1.5% | North America, Asia-Pacific, Middle East and Africa urban centers | Medium term (2-4 years) |
| Urban spending and weather-proof indoor entertainment demand | +1.2% | Asia-Pacific, North America, South America | Short term (≤ 2 years) |
| Multi-activity social venues widening audience mix | +0.8% | North America, Europe | Medium term (2-4 years) |
| Mall-space repurposing into experiential anchors | +0.6% | North America, Asia-Pacific | Short term (≤ 2 years) |
| Birthday, school, and corporate event monetization | +0.5% | Global | Short term (≤ 2 years) |
| Source: Mordor Intelligence | |||
Experience-led Family and Group Leisure Demand
Consumer preferences are shifting toward shared and participatory leisure, driving consistent demand for family entertainment centers (FECs) across various economies. Economic impact studies highlight the significant role of FECs within organized leisure, with attendance figures reflecting their growing popularity. These centers benefit from group outings, as families often engage with multiple venue sections during a single visit. This dynamic increases overall spending on entry, gaming, food, and events, making such visits more valuable than single-attraction outings. The FEC market continues to thrive on repeat visits tied to weekends, school breaks, and celebrations, rather than relying solely on one-time discretionary spending.
AR/VR-Enabled Attraction Refresh
AR and VR have transitioned from being mere novelties to essential tools, sparking renewed investment interest in the family entertainment center market. In March 2026, Sandbox VR announced USD 300 million in lifetime ticket sales from over 80 venues worldwide. The company highlighted that a single content release raked in over USD 50 million, underscoring the lucrative potential of immersive attractions, even within a limited space. Furthermore, the release revealed that nearly one-third of patrons are repeat visitors. This statistic emphasizes the importance of content refreshes in driving not just initial visits but also return traffic. For operators, this insight suggests a shift: older physical attractions can now be either replaced or enhanced with modular immersive zones, continually updated through software and content cycles. This evolution leads to a more adaptable capital expenditure profile for the family entertainment center market. This is particularly crucial in urban areas, where operators seek maximum returns from constrained floor spaces.
Urban Spending and Weather-proof Indoor Entertainment Demand
Urbanization and increasing leisure spending are driving demand for indoor entertainment in densely populated markets with limited open recreational spaces. Family entertainment centers benefit from this trend as they integrate more easily into city retail clusters, mixed-use developments, and high-traffic neighborhoods compared to large outdoor parks. Their weather-resistant nature ensures consistent visitation, as they remain operational regardless of rain, heat, or seasonal changes. This advantage is particularly relevant in North America and Europe, while also gaining importance in the Asia-Pacific region, where cities are expanding organized retail and entertainment infrastructure. The market for family entertainment centers continues to grow, supported by rising urban demand and the year-round reliability of indoor venues across diverse climates.
Multi-activity Social Venues Widening Audience Mix
The transition from single-format venues to multi-activity sites is expanding the customer base in the family entertainment center market. Dave & Buster's reported that entertainment accounted for a larger share of its revenue compared to food and beverages, demonstrating the success of dual-format models in catering to diverse customer needs[2]Dave & Buster's Entertainment, “First Quarter 2025 Financial Results,” Nasdaq Press Release, nasdaq.com. Lucky Strike Entertainment highlighted year-on-year revenue growth and strong performance during peak months, reinforcing the viability of venues combining games, social activities, and dining. This approach appeals to teenagers, young adults, and adults while retaining the family audience that has traditionally supported the sector. The market is shifting from child-focused programming to accommodating group events with mixed age groups, enhancing its versatility and reducing dependency on a single demographic.
Restraints Impact Analysis*
| Restraints | (~) % Impact on CAGR Forecast | Geographic Relevance | Impact Timeline |
|---|---|---|---|
| High upfront capex and maintenance burden | -1.5% | Global, most acute in Tier-2/3 cities and emerging markets | Long term (≥ 4 years) |
| Competition from home digital entertainment | -0.4% | North America, Europe, East Asia | Medium term (2-4 years) |
| Liability insurance inflation for active-play formats | -0.7% | North America, Australia, United Kingdom | Short term (≤ 2 years) |
| Tariffs and FX pressure on imported amusement hardware | -0.8% | North America, Southeast Asia | Short term (≤ 2 years) |
| Source: Mordor Intelligence | |||
High Upfront Capex and Maintenance Burden
High initial investment poses a significant challenge for operators in the family entertainment center market, particularly those developing full-service venues with active play, gaming, and food services. Establishing a mixed-format venue requires substantial upfront costs, excluding ongoing maintenance expenses. Tariffs have increased construction and equipment capital expenditure over a two-year period, complicating earlier project assumptions while operators attempt to maintain stable admission prices. Independent operators face greater difficulties due to limited procurement scale and financial flexibility compared to larger chains. Consequently, the market is expected to adopt stricter expansion strategies, prioritize selective new builds, and show increased interest in acquiring operators with established sites and proven local demand.
Competition from Home Digital Entertainment
Home-based digital entertainment poses a significant challenge due to its convenience, low costs after device purchase, and continuous content updates. This trend is particularly evident in regions with strong broadband access, widespread console usage, and established digital subscription habits. Family entertainment centers (FECs) retain an advantage by offering unique social interactions, physical activities, and event-based experiences that are difficult to replicate at home. To remain competitive, FEC operators must regularly update content and venue designs. Consumers increasingly compare paid out-of-home experiences with diverse at-home alternatives, making it essential for FECs to avoid relying on static attractions for extended periods to encourage repeat visits.
*Our forecasts treat driver/restraint impacts as directional, not additive. The impact forecasts reflect baseline growth, mix effects, and variable interactions.
Segment Analysis
By Type: Edutainment and Immersive Formats Are Narrowing the Gap with CECs
Children's Entertainment Centers accounted for 35.83% of the family entertainment center market share in 2025, highlighting their role in driving global revenues. Their success is linked to demand for birthday celebrations, family outings, and repeat weekend activities for younger children. Operators effectively package food, redemption, and events to attract early-age visitors. However, older children and mixed-age groups now seek diverse experiences, gradually reducing the dominance of child-focused centers in the market.
Location-based VR Entertainment Centers are projected to grow at a 7.80% CAGR from 2026 to 2031, driven by faster content updates, novelty, and compact formats suited for urban areas. Sandbox VR, with over 80 global venues and USD 300 million in lifetime ticket sales as of March 2026, demonstrates the scalability of immersive formats with effective content and customer management. In February 2026, The LEGO Group acquired 29 LEGO Discovery Centre and LEGOLAND Discovery Centre sites from Merlin Entertainments, signaling a shift toward greater operational control over branded experiences[3]The LEGO Group, “The LEGO Group Completes Acquisition of LEGO Discovery Centres and LEGOLAND Discovery Centres from Merlin Entertainments,” LEGO Group Newsroom, lego.com. This trend reflects increasing competition between edutainment and immersive concepts for family engagement. The industry is moving toward formats prioritizing intellectual property, content refresh rates, and ownership over brand legacy.


By Activity Area: Competitive Games Hold the Base While Immersive Zones Grow Faster
Skill and Competition Games contributed 40.21% of revenue in 2025, making them the largest activity-area category in the family entertainment center market. Their broad appeal spans children, teenagers, young adults, and corporate groups. Activities such as bowling, laser tag, karting, and mini-golf drive engagement through organized bookings, league-style participation, and repeat challenges, optimizing weekly utilization. Arcade and redemption areas generate direct revenue and encourage repeat visits through merchandise sales. Physical play areas remain relevant but are increasingly integrated into broader venue layouts instead of standalone concepts.
AR and VR Gaming Zones are projected to grow at an 8.17% CAGR through 2031, emerging as the fastest-growing activity area in the family entertainment center market. This growth is driven by improved hardware affordability, expanded content libraries, and the appeal of immersive group experiences. Sandbox VR's performance demonstrates consumer interest in regularly updated immersive sessions. For multi-activity operators, XR zones act as both an attraction and a feature that boosts interest across the venue. The market is increasingly divided between activity categories that benefit from content updates and those reliant on fixed mechanical setups.
By Facility Size: Mid-sized Sites Lead Revenue While Larger Formats Gain Expansion Momentum
The 5,001-20,000 sq. ft. tier captured 32.54% of revenue in 2025, making it the most prevalent operating scale in the family entertainment center market. This size offers sufficient space for a balanced activity mix while aligning with inline retail and mall lease structures. It suits local trade areas focused on manageable capital expenditures and steady repeat traffic rather than destination-level visits. Operators often use this tier to combine ticketed entry, party rooms, arcade games, and a modest food offering within a single location. This format remains the primary deployment model in dense suburban and urban areas.
The 1-to-10-acre format is projected to grow at a 7.43% CAGR through 2031, reflecting increased momentum in larger multi-activity setups. Urban Air Adventure Park opened a 30,000 sq. ft. Philadelphia location in April 2026, following 21 new park openings in 2025, showcasing the use of larger layouts for diverse activities and broader audiences. Miral expanded Yas Waterworld in Abu Dhabi in April 2026, adding 11 new slides and attractions, demonstrating continued investment in large-format entertainment where capital and demand are strong. These developments highlight the market's shift toward larger footprints, driven by mixed programming, destination positioning, and cost distribution across multiple attractions. While compact urban formats remain relevant, larger sites are attracting more expansion capital.
By Visitor Demographics: Young Families Lead Current Spend While Teenagers Drive the Next Growth Layer
Families with children aged 0-8 accounted for 31.93% of revenue in 2025, making them the largest demographic in the family entertainment center market. Their consistent visits, driven by family outings, birthdays, and school breaks, ensure steady demand. This group also drives additional spending on food, merchandise, and add-ons through parents and caregivers. Families with children aged 9-12 act as a bridge segment, engaging with both child-focused attractions and competitive activity zones. Venues that combine early-childhood play with broader family appeal remain integral to the market.
Teenagers aged 13-19 are expected to grow at a 7.32% CAGR through 2031, making them the fastest-growing visitor segment and a key focus for operators. Their preferences for social competition, redemption gaming, and immersive attractions align with expanding activity categories. Young adults are increasingly engaged through gaming-plus-dining formats, as seen in Lucky Strike's FY2025 revenue growth and season-pass activity, which highlight the value of repeat visits from older youth and adults. Operators are expanding programming to cater to mixed-age social use during evenings, weekends, and group events. This approach diversifies spending opportunities within a single format and strengthens the long-term demand for the family entertainment center market.
By Revenue Source: Ticketing Still Leads but Food and Beverage Is Expanding Faster
Entry Fees and Ticket Sales accounted for 44.23% of revenue in 2025, highlighting their central role in the family entertainment center market. This revenue stream captures initial spending and drives additional purchases like gaming, food, events, and merchandise. It is highly sensitive to traffic changes, as weak footfall impacts overall spending. Dave & Buster's reported FY2025 revenue of USD 2.1 billion but experienced a 5.0% decline in comparable-store sales during normalized consumer spending, demonstrating how volume softness affects operators[4]Dave & Buster's Entertainment, “Fourth Quarter and Fiscal Year End 2025 Financial Results,” Globe Newswire, globenewswire.com. To mitigate this, market players are focusing on secondary revenue streams to increase per-guest spending despite mixed traffic conditions.
Food and Beverages is projected to grow at a 7.65% CAGR through 2031, making it the fastest-growing revenue source in the family entertainment center market. Dave & Buster's Q1 FY2025 food and beverage revenue reached USD 201.1 million, representing 35.4% of total quarterly revenue, showcasing the potential for scaled operators to expand hospitality alongside entertainment. Lucky Strike reported USD 17.6 million in season-pass activations across bowling, family entertainment centers, and water parks, indicating the growing importance of bundled models for retention. Merchandising and redemption remain vital for fostering loyalty without requiring separate acquisition efforts. The market is gradually shifting from reliance on admission fees to broader visit monetization through enhanced food services, subscriptions, and bundled packages.
Geography Analysis
North America accounted for 34.47% of the family entertainment center market share in 2025, making it the largest regional contributor to global revenue. The region benefits from established operators, consumer familiarity with organized indoor leisure, and a mature franchise ecosystem. Large companies better absorb insurance, labor, and equipment costs than smaller competitors. Dave & Buster's reported FY2025 revenue of USD 2.1 billion across 243 venues and announced international franchise agreements for over 35 locations, with FY2026 openings planned in Delhi, Perth, and Mexico City. This scale highlights North America's central role in the market, despite emerging growth opportunities elsewhere.
Asia-Pacific is projected to grow at an 8.36% CAGR through 2031, driven by urbanization, middle-class spending growth, and the spread of organized entertainment formats across China, India, South Korea, and Southeast Asia. The region is witnessing increased adoption of media intellectual property in physical entertainment, along with expansion of branded indoor experiences across multiple countries. Asia-Pacific offers high growth potential and opportunities for localized concepts tailored to language, content, and spending behaviors.
Europe remains a key demand center due to high spending per visit, stable mall traffic, and interest in competitive-socializing formats. The Middle East and Africa, though smaller, attract significant investment in large-format destinations. Recent expansions in the Gulf reflect growing leisure capacity, while global manufacturers increasingly view the region as a strong growth market. This positions Europe as a stable market and Middle East and Africa as a strategic expansion area.

Competitive Landscape
The Global Family Entertainment Center market is highly fragmented, with a small share held by the top operators. Major players include CEC Entertainment, Dave & Buster's, TEEG, Merlin Entertainments, and KidZania. Independent and regional operators dominate the rest of the market, catering to local audiences with varied pricing, themes, and models. Local operators often maintain repeat traffic through venue familiarity, flexible pricing, and neighborhood relevance. However, larger companies influence industry standards with their purchasing power, technology investments, and ability to test formats across markets.
Strategic priorities among major players focus on footprint expansion, content control, and visit monetization. Dave & Buster's plans to open new locations and expand internationally reflect efforts to diversify geographically and offset slower domestic traffic. LEGO's acquisition of Merlin's discovery center portfolio highlights intellectual property owners' shift toward direct operational control for branded experiences. Sandbox VR's partnership with Apparel Group for a venue rollout in the Middle East demonstrates how technology-driven challengers scale efficiently through targeted collaborations. These strategies emphasize format differentiation and customer retention over unit growth.
Technology is transforming competition within the market. Operators that frequently update attractions attract repeat visitors more effectively than those relying on static setups. Customers now expect integrated experiences, including gaming, dining, content, booking convenience, and social shareability. Equipment suppliers are introducing connected, data-driven systems, while operators use these tools to optimize utilization and revenue. Competitive advantage will favor operators combining local relevance, regular content updates, disciplined capital expenditure, and a venue mix appealing to families, teenagers, and adults without overdependence on any single group.
Family Entertainment Center Industry Leaders
CEC Entertainment
Dave & Buster’s Entertainment
TEEG
Merlin Entertainments
KidZania
- *Disclaimer: Major Players sorted in no particular order

Recent Industry Developments
- April 2026: Miral, a privately owned government entity without a public stock ticker, plans to expand Yas Waterworld in Abu Dhabi on April 4, 2026. The expansion will add 11 new attractions, increasing the park's total to over 70 and enhancing its offerings.
- April 2026: Urban Air Adventure Park signed a lease for a 30,000 sq. ft. location in Philadelphia, continuing its United States expansion. In 2025, it finalized five California franchise agreements and a multi-unit Virginia deal, resulting in 22 new park openings that year.
- March 2026: Sandbox VR reached USD 300 million in lifetime ticket sales by March 2026, with over 5 million players. The company operates in 80+ locations across 13 countries, driven by partnerships with companies such as Netflix, offering exclusive VR experiences, including "Squid Game Virtuals".
- March 2026: Dave & Buster's reported FY2025 revenue of USD 2.1 billion and plans to open 10-12 new domestic venues. The company is expanding internationally with locations in New Delhi, Perth, and Mexico City, supported by master franchise agreements to develop over 35 global stores.


Global Family Entertainment Center Market Report Scope
| Children's Entertainment Centers (CECs) |
| Children's Edutainment Centers (CEDCs) |
| Adult Entertainment Centers (AECs) |
| Location-based VR Entertainment Centers (LBECs) |
| Physical Play Activities | Trampoline and Ninja Courses |
| Soft Play and Climbing Areas | |
| Indoor Playgrounds | |
| Arcade Studios (Video Games, Redemption Games) | |
| AR and VR Gaming Zones (VR Arenas and Simulators, AR and Mixed-Reality Attractions) | |
| Skill and Competition Games (Bowling, Laser Tag, Go-Karts, Mini Golf etc.) |
| Up to 5,000 Sq. Ft. |
| 5,001 to 20,000 Sq. Ft. |
| 20,001 to 40,000 Sq. Ft. |
| 1 to 10 Acres |
| Over 10 Acres |
| Families with Children (0-8) |
| Families with Children (9-12) |
| Teenagers (13-19) |
| Young Adults (20-25) |
| Adults (Ages 25+) |
| Entry Fees and Ticket Sales |
| Food and Beverages |
| Merchandising and Redemption |
| Advertising and Sponsorship |
| Other Ancillary Revenue |
| North America | United States |
| Canada | |
| Mexico | |
| South America | Brazil |
| Peru | |
| Chile | |
| Argentina | |
| Rest of South America | |
| Europe | United Kingdom |
| Germany | |
| France | |
| Spain | |
| Italy | |
| BENELUX (Belgium, Netherlands, and Luxembourg) | |
| NORDICS (Denmark, Finland, Iceland, Norway, and Sweden) | |
| Rest of Europe | |
| Asia-Pacific | India |
| China | |
| Japan | |
| Australia | |
| South Korea | |
| South East Asia (Singapore, Malaysia, Thailand, Indonesia, Vietnam, and Philippines) | |
| Rest of Asia-Pacific | |
| Middle East and Africa | United Arab Emirates |
| Saudi Arabia | |
| South Africa | |
| Nigeria | |
| Rest of Middle East and Africa |
| By Type | Children's Entertainment Centers (CECs) | |
| Children's Edutainment Centers (CEDCs) | ||
| Adult Entertainment Centers (AECs) | ||
| Location-based VR Entertainment Centers (LBECs) | ||
| By Activity Area | Physical Play Activities | Trampoline and Ninja Courses |
| Soft Play and Climbing Areas | ||
| Indoor Playgrounds | ||
| Arcade Studios (Video Games, Redemption Games) | ||
| AR and VR Gaming Zones (VR Arenas and Simulators, AR and Mixed-Reality Attractions) | ||
| Skill and Competition Games (Bowling, Laser Tag, Go-Karts, Mini Golf etc.) | ||
| By Facility Size | Up to 5,000 Sq. Ft. | |
| 5,001 to 20,000 Sq. Ft. | ||
| 20,001 to 40,000 Sq. Ft. | ||
| 1 to 10 Acres | ||
| Over 10 Acres | ||
| By Visitor Demographics | Families with Children (0-8) | |
| Families with Children (9-12) | ||
| Teenagers (13-19) | ||
| Young Adults (20-25) | ||
| Adults (Ages 25+) | ||
| By Revenue Source | Entry Fees and Ticket Sales | |
| Food and Beverages | ||
| Merchandising and Redemption | ||
| Advertising and Sponsorship | ||
| Other Ancillary Revenue | ||
| By Geography | North America | United States |
| Canada | ||
| Mexico | ||
| South America | Brazil | |
| Peru | ||
| Chile | ||
| Argentina | ||
| Rest of South America | ||
| Europe | United Kingdom | |
| Germany | ||
| France | ||
| Spain | ||
| Italy | ||
| BENELUX (Belgium, Netherlands, and Luxembourg) | ||
| NORDICS (Denmark, Finland, Iceland, Norway, and Sweden) | ||
| Rest of Europe | ||
| Asia-Pacific | India | |
| China | ||
| Japan | ||
| Australia | ||
| South Korea | ||
| South East Asia (Singapore, Malaysia, Thailand, Indonesia, Vietnam, and Philippines) | ||
| Rest of Asia-Pacific | ||
| Middle East and Africa | United Arab Emirates | |
| Saudi Arabia | ||
| South Africa | ||
| Nigeria | ||
| Rest of Middle East and Africa | ||


Key Questions Answered in the Report
What is the current size of the family entertainment center market?
The family entertainment center market stands at USD 34.57 billion in 2026 and is forecast to reach USD 47.93 billion by 2031 at a CAGR of 6.75%.
Which region leads global revenue generation for family entertainment centers?
North America led with 34.47% of global revenue in 2025, supported by its large venue base and established operator ecosystem.
Which region is growing fastest through 2031?
Asia-Pacific is the fastest-growing region with an 8.36% CAGR for 2026-2031, supported by urbanization and expanding organized leisure demand.
Which format is growing fastest among center types?
Location-based VR Entertainment Centers are the fastest-growing type with a 7.80% CAGR through 2031, reflecting strong demand for immersive attractions.
What is changing the revenue model of family entertainment centers most clearly?
Food and beverages is the fastest-growing revenue source at a 7.65% CAGR through 2031, showing that operators are pushing broader spend per visit beyond ticketing.
How concentrated is competition among major operators?
Competition remains fragmented because the top 5 operators together held only 24% of global revenue in 2025, leaving most of the market with regional and independent players.
Page last updated on:


