
United States Table Grapes Market Size and Share
United States Table Grapes Market Analysis by Mordor Intelligence
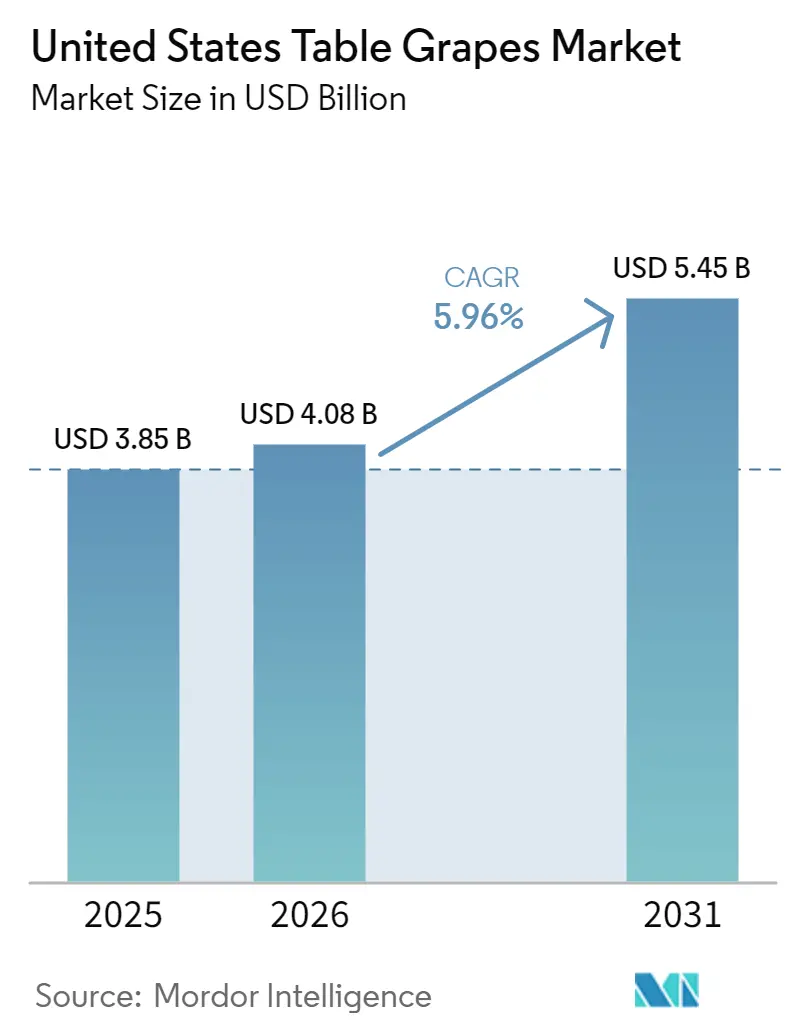
The United States table grapes market was valued at USD 3.85 billion in 2025 and is projected to grow from USD 4.08 billion in 2026 to USD 5.45 billion by 2030, registering a CAGR of 5.96% during the forecast period from 2026 to 2031. The market is benefiting from rising consumer demand for premium seedless varieties, supported by increasing preference for superior flavor, texture, and branded offerings over conventional color-based purchasing. Year-round product availability is being strengthened through complementary domestic production and growing import volumes, enabling retailers to maintain a consistent supply across seasons. Market participants are increasingly investing in proprietary grape varieties, advanced breeding programs, and post-harvest handling technologies to improve fruit quality, shelf life, and product differentiation. At the same time, growers are modernizing vineyard operations to address labor constraints, water scarcity, and production efficiency while transitioning toward higher-value cultivars. These developments, together with sustained fresh fruit consumption and innovation across breeding, production, and retail programs, are projected to support long-term market growth and reinforce the United States' position as one of the world's leading table grape markets.
Key Report Takeaways
- The United States table grapes market is led by California, with additional production in Arizona and Texas. Premium seedless varieties, advanced breeding programs, and year-round domestic and imported supply keep us competitive and support growth.
Note: Market size and forecast figures in this report are generated using Mordor Intelligence’s proprietary estimation framework, updated with the latest available data and insights as of January 2026.
United States Table Grapes Market Trends and Insights
Drivers Impact Analysis*
| Driver | (~) % Impact on CAGR Forecast | Geographic Relevance | Impact Timeline |
|---|---|---|---|
| Rising demand for seedless and premium varieties | +2.0% | National, strongest in premium grocery and high-turn produce channels | Medium term (2-4 years) |
| Retailers expanding proprietary and branded grape programs | +1.3% | National, with stronger pull in coastal metropolitan markets and club stores | Medium term (2-4 years) |
| Import seasonality supports year-round shelf availability | +1.0% | National, with strongest value during the November to May supply window | Long term (≥ 4 years) |
| Consumer preference for snackable fresh fruit | +0.9% | National, across mainstream grocery and convenience-led retail formats | Long term (≥ 4 years) |
| Improved postharvest handling and cold chain reach | +0.7% | National, led by California, Peru, and Chile supply routes | Long term (≥ 4 years) |
| Breeding advances extend shelf life and flavor profiles | +0.8% | California and key Southern Hemisphere origin corridors | Long term (≥ 4 years) |
| Source: Mordor Intelligence | |||
Rising Demand for Seedless and Premium Varieties
The market is driven by consumer preference for premium eating quality, prompting growers and retailers to expand seedless and proprietary grape offerings. According to a 2025 HortScience study, United States consumers were willing to pay USD 3.59 more per pound for seedless grapes than seeded grapes, reflecting a strong preference for premium varieties that offer greater convenience and quality. This trend is driving investments in breeding programs and vineyard redevelopment toward higher-value cultivars with improved flavor, texture, shelf life, and retail differentiation. As a result, premium seedless varieties continue to support value realization and long-term growth across the United States table grapes market.
Retailers Expanding Proprietary and Branded Grape Programs
Retail merchandising is becoming an important growth driver in the United States table grapes market as retailers prioritize proprietary and branded varieties to strengthen consumer loyalty and differentiate produce assortments. According to the California Table Grape Commission (2026), its global marketing campaign for the 2026 season targets the United States and 22 export markets, supporting retailer promotions through digital campaigns, shopper apps, recipes, health messaging, and in-store merchandising[1]Source: California Table Grape Commission, “California Table Grape Commission Launches a New Global Campaign as the Season Arrives Early,” grapesfromcalifornia.com.. These initiatives reinforce premium variety positioning, encourage repeat purchases, and increase demand for licensed genetics and consistently high-quality fruit, benefiting growers with strong retail partnerships and branded programs.
Import Seasonality Supports Year-Round Shelf Availability
Complementary import seasons that ensure consistent retail availability beyond the domestic harvest window. According to the United States Department of Agriculture Foreign Agricultural Service (USDA FAS) 2025 report, United States table grape imports were forecasted to reach 915,000 metric tons in 2025/26, surpassing the previous record and highlighting the growing importance of imported grapes in maintaining a year-round supply[2]Source: United States Department of Agriculture Foreign Agricultural Service, “Fresh Apples, Grapes, and Pears: World Markets and Trade,” apps.fas.usda.gov.. Consistent shipments from major suppliers such as Peru and Chile support shelf availability, retailer inventory planning, product quality, and consumer access to fresh grapes throughout the year.
Consumer Preference for Snackable Fresh Fruit
The market is benefiting from rising consumer demand for healthy, convenient, and ready-to-eat fresh snacks. According to the United States Department of Agriculture Economic Research Service (USDA ERS) 2025, fresh grape per capita availability reached 9.5 pounds in the 2024/25 marketing year, reflecting sustained consumer demand for fresh grapes in everyday diets. Growing preference for seedless, flavorful, and easy-to-consume fruit continues to encourage retailers and growers to expand premium grape offerings. This shift supports higher-value product positioning, strengthens repeat purchases, and reinforces long-term growth across the United States table grapes market.
Restraints Impact Analysis*
| Restraint | (~) % Impact on CAGR Forecast | Geographic Relevance | Impact Timeline |
|---|---|---|---|
| Rising labor and compliance costs in California production | -1.5% | California, especially the Coachella Valley and San Joaquin Valley | Short term (≤ 2 years) |
| Water stress and acreage contraction in key growing areas | -1.0% | San Joaquin Valley and Southern California desert districts | Long term (≥ 4 years) |
| Import competition pressures domestic pricing | -0.7% | National, with less pressure on highly differentiated premium fruit | Medium term (2-4 years) |
| Variety turnover increases vineyard redevelopment costs | -0.5% | California, especially in areas moving from legacy to proprietary cultivars | Medium term (2-4 years) |
| Source: Mordor Intelligence | |||
Rising Labor and Compliance Costs in California Production
The United States table grapes market faces increasing cost pressures as California producers contend with rising labor costs and stricter regulatory compliance requirements for hand-harvested grape production. According to the United States Department of Labor, in 2025, California recorded the highest H-2A Adverse Effect Wage Rate (AEWR) in the continental United States at USD 19.97 per hour in 2025. In addition to higher wages, growers must bear mandatory housing, transportation, recruitment, and visa-related costs for H-2A workers, substantially increasing production expenses[3]Source: United States Department of Agriculture Economic Research Service, “Adverse Effect Wage Rates (AEWR), 2025,” ers.usda.gov.. These escalating labor and compliance costs reduce profit margins, discourage new vineyard investment, and limit the market's growth potential.
Water Stress and Acreage Contraction in Key Growing Areas
Water availability remains a significant long-term restraint on commercial table grape production. California, the primary table grape-producing state, depends heavily on reliable irrigation for vineyard operations. According to the United States Department of Agriculture (USDA) National Agricultural Statistics Service (NASS) 2026 report, California's total table-type grape acreage declined from 125,000 acres in 2023 to 118,000 acres in 2025. Continued reductions in vineyard acreage may limit domestic production capacity over time, although yield improvements, varietal replacement, and imports could partly offset the impact on the overall United States fresh grape supply.
*Our forecasts treat driver/restraint impacts as directional, not additive. The impact forecasts reflect baseline growth, mix effects, and variable interactions.
Geography Analysis
California accounted for nearly all domestic commercial production, making it the country's primary table grape growing region. Production begins in the Coachella Valley before shifting to the San Joaquin Valley, providing a continuous domestic harvest through late fall. According to the United States Department of Agriculture National Agricultural Statistics Service (USDA NASS) 2025, California produced 93.2 million 19-pound boxes of table grapes in 2024, reflecting improved yields following weather-related disruptions in the previous season. This geographic concentration strengthens domestic supply but also increases exposure to regional weather, labor, and water-related production risks.
California's production base continues to evolve as growers gradually replace older vineyards with premium proprietary cultivars that offer stronger retail demand and export potential. Vineyard redevelopment decisions increasingly depend on irrigation availability, production economics, and long-term profitability rather than acreage expansion alone. Breeding programs have accelerated the adoption of seedless varieties with improved shelf life, flavor, and appearance, helping growers remain competitive in domestic and export channels. This ongoing varietal transition improves product quality while reshaping production patterns across the state's principal grape-growing regions.
Imported fruit complements domestic production by maintaining year-round retail availability after California's harvest concludes. According to the Observatory of Economic Complexity (OEC) 2025, the United States imported fresh grapes valued at USD 2.6 billion in 2025, reflecting the significant role of offshore suppliers in maintaining market continuity. Peru and Chile remain the dominant seasonal suppliers due to their efficient cold-chain logistics and favorable harvest calendars, while Canada, Mexico, and Japan continue to serve as leading export destinations for domestically produced grapes.
Competitive Landscape
Competition increasingly centers on proprietary genetics, licensed varieties, and long-term breeding programs rather than vineyard ownership alone. Companies, including Sun World International, LLC, BLOOM FRESH International, and Grapa Global LLC, continue expanding premium seedless grape portfolios through exclusive licensing agreements that strengthen retailer differentiation and consumer preference. Intellectual property protection has become an increasingly important source of competitive advantage, as branded cultivars command premium prices while limiting unauthorized commercial production. As a result, breeding innovation continues to reshape competitive positioning across the fresh grape value chain.
Competition among grower-shippers increasingly depends on operational excellence rather than production scale alone. Suppliers are investing in advanced postharvest handling, rapid cooling, digital traceability, and quality assurance systems to meet retailer specifications and extend product shelf life. Greater emphasis on food safety compliance, inventory visibility, and cold-chain efficiency has strengthened supply chain reliability while reducing product losses during storage and transportation. Improvements in packaging technologies and condition monitoring also help preserve fruit quality throughout domestic distribution and export logistics, allowing suppliers to compete through consistent product performance and dependable seasonal availability.
Strategic partnerships are becoming increasingly important for expanding premium grape programs and strengthening branded supply networks. According to FreshFruitPortal (February 2026), Fresh Farms partnered with Sun World International to produce, pack, and market Sun World's proprietary table grape varieties across operations in the United States and nearby regions. The collaboration expands access to premium licensed cultivars while improving year-round supply continuity for North American retailers. Such partnerships reinforce proprietary variety commercialization and strengthen competitive differentiation through branded grape programs and coordinated production networks.
Recent Industry Developments
- February 2026: Fresh Farms partnered with Sun World International to produce, pack, and market Sun World's proprietary table grape varieties across Mexico, the United States, and South America. The partnership aims to strengthen branded grape programs, year-round supply continuity, and premium variety availability for North American retailers.
- January 2026: Sun World International expanded its global marketer network by adding 10 new licensees and authorized Sun Pacific Shippers, L.P. as a North American importer to strengthen the distribution of its proprietary table grape varieties.
- July 2025: The Karniel and Giumarra families formally combined their table grape breeding and commercialization activities under Grapa Global LLC. The new entity consolidated the ARRA and Early Sweet programs to improve operational efficiency and accelerate the breeding, licensing, and global commercialization of proprietary table grape varieties. Headquartered in California, the business has direct relevance to the United States table grapes market through its breeding, licensing, grower-support, and commercial activities.


United States Table Grapes Market Report Scope
Table grapes are grapes grown specifically for fresh fruit consumption, distinct from grapes cultivated for wine, juice, jelly, jam, or raisin production.
The United States table grapes market report includes production analysis (volume, area harvested, and yield), consumption analysis (value and volume), import analysis (value and volume), export analysis (value and volume), wholesale price trend analysis and forecast, regulatory framework, logistics and infrastructure, and seasonality analysis. The market forecasts are provided in terms of value (USD) and volume (metric tons).
| Production Volume |
| Area Harvested and Yield |
| Import Market Analysis | Import Value and Volume |
| Key Supplying Markets | |
| Export Market Analysis | Export Value and Volume |
| Key Destinations Markets |
| Production Analysis | Production Volume | |
| Area Harvested and Yield | ||
| Trade Analysis (Value and Volume) | Import Market Analysis | Import Value and Volume |
| Key Supplying Markets | ||
| Export Market Analysis | Export Value and Volume | |
| Key Destinations Markets | ||


Key Questions Answered in the Report
How large is the United States table grapes market in 2026?
The United States table grapes market size stands at USD 4.08 billion in 2026.
Which state matters most for domestic grape production?
California is the dominant domestic source and accounted for 99% of United States table grape production in 2025.
What are the biggest risks for growers and shippers?
The main risks are rising labor costs, water stress, acreage contraction, and pricing pressure from better-conditioned imports.
How is competition changing among leading grape companies?
Competition is shifting toward control of proprietary genetics, licensing networks, branded programs, and stronger postharvest and traceability capabilities rather than acreage alone.
Page last updated on:





