
United States Smart Shower Market Size and Share
Market Overview
| Study Period | 2020 - 2031 |
|---|---|
| Forecast Data Period | 2026 - 2031 |
| Historical Data Period | 2020 - 2024 |
| Market Size (2026) | USD 0.83 Billion |
| Market Size (2031) | USD 1.49 Billion |
| Growth Rate (2026 - 2031) | 12.34 % |
| Market Concentration | Medium |
Major Players *Disclaimer: Major Players sorted in no particular order Image © Mordor Intelligence. Reuse requires attribution under CC BY 4.0. | |
United States Smart Shower Market Analysis by Mordor Intelligence
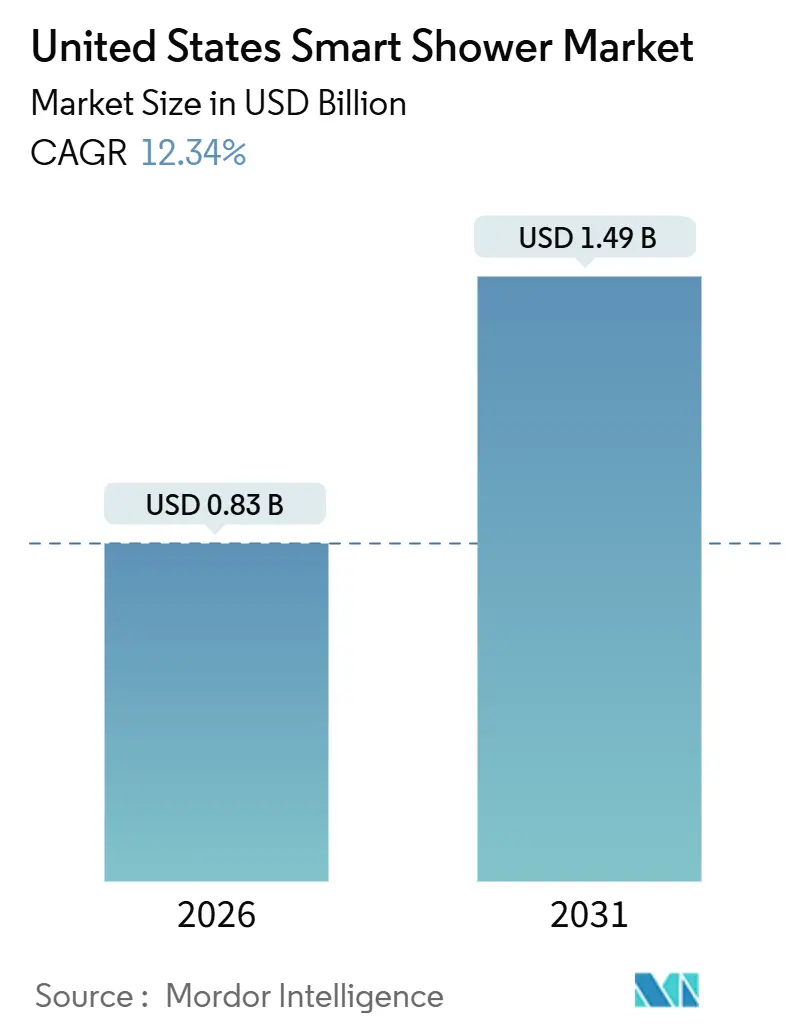
The United States smart shower market size stands at USD 0.83 billion in 2026 and is projected to reach USD 1.49 billion by 2031, reflecting a 12.34% CAGR. The United States smart shower market is experiencing growth driven by evolving consumer priorities that position bathrooms as wellness-focused spaces. Homeowners increasingly seek personalized experiences that integrate voice control, real-time water management, and multi-sensory features such as lighting, audio, and steam, with premium systems like Kohler’s Anthem+ setting the benchmark for high-end remodels. Adoption is further supported by insurance-led initiatives, as whole-home leak monitoring and automatic shutoff features help mitigate risk and reduce claim exposure, encouraging both homeowners and carriers to embrace connected solutions. While fragmentation among platforms such as Amazon Alexa, Google Home, and Apple HomeKit creates usability challenges, vendors are consolidating control interfaces to simplify setup and enhance daily convenience. Additionally, water conservation incentives in Western states and innovations like RainStick’s circular, recirculating showers offering up to 80% water savings are creating strong policy and technology tailwinds, particularly in retrofit-heavy housing markets.
Key Report Takeaways
- By type, Smart Shower Control units led with 53.37% of the United States smart shower market share in 2025, while Smart Shower systems are projected to expand at a 17.49% CAGR through 2031.
- By end user, Residential accounted for 61.73% of the United States smart shower market share in 2025, and Spas & Wellness Centers are forecast to record an 18.83% CAGR to 2031.
- By distribution channel, Multi-Brand Stores captured 67.35% of the United States smart shower market share in 2025, while Exclusive Stores are expected to post a 19.76% CAGR through 2031.
- By geography, the South United States commanded 31.39% of the United States smart shower market share in 2025, with the West United States projected to grow at a 12.39% CAGR to 2031.
Note: Market size and forecast figures in this report are generated using Mordor Intelligence’s proprietary estimation framework, updated with the latest available data and insights as of January 2026.
Market Trends and Insights
Drivers Impact Analysis of United States Smart Shower Market*
| Driver | (~) % Impact on CAGR Forecast | Geographic Relevance | Impact Timeline |
|---|---|---|---|
| Rising adoption of smart-home automation | +3.1% | National, with early gains in West Coast metros and tech-centric suburbs | Medium term (2-4 years) |
| Increasing water-conservation regulations & incentives | +2.8% | California, Arizona, Nevada leadership, expanding to Colorado and Texas | Long term (≥ 4 years) |
| Growth in premium housing renovations | +2.4% | South United States and coastal second-home markets | Short term (≤ 2 years) |
| Advances in IoT & voice-control integrations | +2.2% | Urban centers with high voice assistant penetration | Medium term (2-4 years) |
| Expansion of retrofit-friendly smart shower solutions | +1.9% | National, especially in suburban and older housing stock | Medium term (2-4 years) |
| Rising consumer focus on wellness and personalized home experiences | +1.7% | Urban and affluent suburban areas | Short to medium term (1-3 years) |
| Source: Mordor Intelligence | |||
Rising Adoption of Smart-Home Automation
Connected devices continue to move deeper into residential spaces, and bathroom upgrades are beginning to reflect the same convenience, comfort, and monitoring that consumers already expect in living rooms and kitchens. In 2025, 63 % of United States households reported owning at least one smart home device, with 72 million smart speakers in use, reflecting strong penetration of connected technology and voice assistants. Smart interactions are widespread, with 68 % of users initiating commands via voice, while mobile apps are used by 84 % of smart homeowners to control devices. These adoption trends show that automation is becoming mainstream in United States homes, providing a foundation for integrated solutions such as smart showers.[1]Source: SQ Magazine, “Smart Home Statistics 2025,” sqmagazine.co.uk. The United States smart shower market benefits when households adopt bundled smart-bathroom suites that align digital showers with leak monitoring and centralized app control for a consistent daily routine. Visualization and remote management tools reduce purchase friction by letting buyers understand features, plan installations, and compare options before committing to a major retrofit in the United States smart shower market. Commercial restrooms are reinforcing this behavior shift through facility-grade IoT that monitors activity and replenishment levels, which normalizes the use of sensors and data in hygiene environments. As water and energy programs recognize verified conservation features in qualifying products, eligibility for rebates creates a policy bridge that links smart functionality to measurable savings in the United States smart shower market.
Increasing Water-Conservation Regulations & Incentives
Water-conservation regulations and incentive programs are a key driver of the United States' smart shower market. Federal standards, including benchmarks established by the EPA’s WaterSense program, guide manufacturers in designing efficient products and help consumers compare water-saving features. WaterSense partners with over 2,200 utilities, manufacturers, builders, and retailers to promote high-efficiency fixtures, including smart showerheads and monitoring systems. Since its inception, WaterSense-labeled products have saved 8.7 trillion gallons of water, with 1.2 trillion gallons saved in 2023 alone, and delivered approximately USD 207 billion in combined water and energy savings. The program now certifies more than 45,000 product models, giving homeowners wide options for upgrades. [2]Source: U.S. Environmental Protection Agency, “WaterSense Current: Summer 2024,” epa.gov. State and local rebate programs, particularly in Western regions, reduce upfront costs and make smart water-monitoring devices more accessible. Utilities distribute or rebate thousands of efficient fixtures directly to residents, encouraging household investment in efficiency upgrades. Insurance companies are also promoting adoption by subsidizing smart monitoring and automatic shutoff systems, which reduce risk and loss exposure.
Growth in Premium Housing Renovations
High-end bathroom remodels that bundle digital showering, steam, lighting, and audio are expanding as homeowners reallocate budgets toward comfort and wellness-focused spaces. United States homeowners spent over USD 513 billion on home renovations in early 2025, up from around USD 500 billion the previous year, while retail sales at home-improvement stores rose 4–5 %, highlighting steady investment in upgrades despite economic uncertainty. [3]Source: Finance & Commerce, “Home Renovation Spending Rises in 2025,” finance‑commerce.com. Population shifts and household formation in the South underpin steady demand, while a large existing-home base keeps retrofit projects central to unit volume and downstream accessory sales in the United States smart shower market. Within premium tiers, multi-sensory systems support higher price points by expanding the experience beyond water delivery into mood, recovery, and relaxation features that align with spa-like expectations. A massive installed base of legacy bathrooms continues to define the opportunity, positioning connected controls, leak monitoring, and app-based scheduling as natural lifecycle upgrades as fixtures reach replacement age. California’s Title 24, CALGreen, and related efficiency codes also influence specifications by normalizing WaterSense compliance and building-level conservation accountability.
Advances in IoT & Voice-Control Integrations
Native connections with leading voice assistants simplify everyday use by moving temperature presets, start-stop commands, and personalized profiles into a single spoken instruction. Over 70 % of households own a voice-assistant device, and 65 % of users find voice control simplifies smart-home interactions, making these smart shower features increasingly appealing. Despite improvements, consumers still face compatibility questions when mixing brands across showers, faucets, and other smart-home categories, which sustains demand for consolidated apps and well-documented integrations in the United States smart shower market. 55 % of consumers prioritize interoperability, while 75 % of new IoT devices support open protocols, enabling seamless integration across smart-home systems.[4]Source: MoldStud, “Comprehensive Overview of IoT Integration in Smart Homes 2025,” moldstud.com. Manufacturers that plan for forward compatibility and support common platforms can reduce reconfiguration friction for multi-device bathrooms and appeal to installer networks that manage whole-home automation. Venture-backed innovators are leveraging cloud-native architectures and water-cycling designs to minimize retrofit disruption and intensify the conservation value proposition.
Restraints Impact Analysis of United States Smart Shower Market*
| Restraint | (~) % Impact on CAGR Forecast | Geographic Relevance | Impact Timeline |
|---|---|---|---|
| High upfront product & installation cost | -2.1% | National, more acute in lower-income Midwest and rural markets | Medium term (2-4 years) |
| Data-privacy & cybersecurity concerns | -1.3% | Urban tech hubs with high privacy awareness | Long term (≥ 4 years) |
| Fragmented smart-home ecosystem & interoperability issues | -1.5% | National, especially in multi-vendor households | Medium term (2-4 years) |
| Limited consumer awareness of smart shower benefits | -0.9% | Emerging markets and suburban regions | Short to medium term (1-3 years) |
| Source: Mordor Intelligence | |||
High Upfront Product & Installation Cost
High upfront product and installation costs remain a key restraint in the United States smart shower market. Full-featured digital shower systems often carry significant price premiums compared with conventional fixtures, particularly when they include digital valves, multi-outlet controls, steam, and synchronized lighting and audio. Payback periods vary by location because water rates and local incentive programs differ, making savings more compelling in high-rate markets with rebates for WaterSense-aligned components. Installation costs can be high, especially when electrical connections, upgraded Wi-Fi coverage, or compliance with local plumbing codes in older homes are required. Insurance programs and value-chain partners are helping reduce these costs by offering device subsidies, premium discounts, and promotional offers tied to verified leak monitoring or automatic shutoff.
Data-Privacy & Cybersecurity Concerns
Bathroom-centric IoT raises heightened privacy sensitivities because usage analytics can reveal occupancy patterns, preferred temperatures, and time-of-day routines. Continuous water-flow and pressure monitoring delivers real benefits for leak detection and loss prevention, but it also introduces questions about data storage, sharing, and access controls that buyers want addressed up front. Insurer partnerships are reframing some data-sharing as a path to lower premiums and reduced claim incidence, though many households still seek clear guardrails and opt-out choices for non-essential analytics. Academic assessments have consistently placed privacy and security near the top of adoption barriers for connected-home technologies, which aligns with homeowner caution toward connected devices in intimate spaces. The long-term resolution rests on transparent disclosures, robust firmware support, and proven security practices that balance functionality with data minimization in the United States smart shower market.
*Our forecasts treat driver/restraint impacts as directional, not additive. The impact forecasts reflect baseline growth, mix effects, and variable interactions.
United States Smart Shower Market Segment Analysis
By Type:
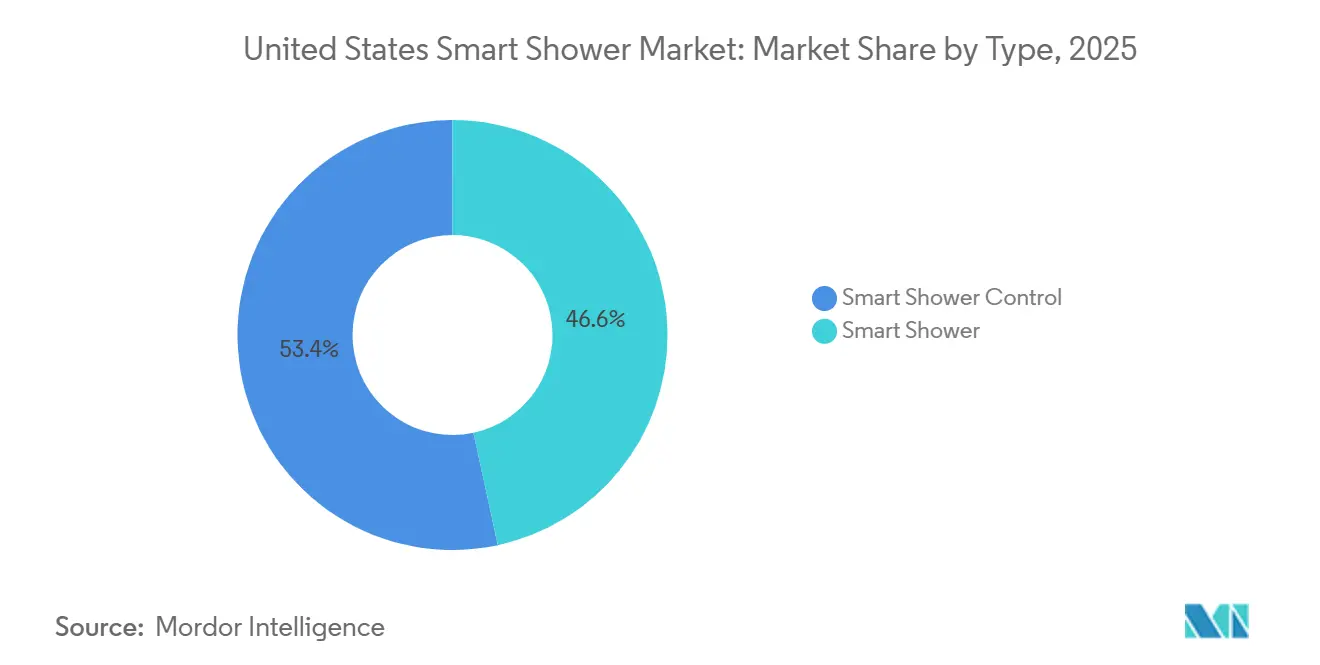
Control Interfaces Yield to Integrated SystemsSmart Shower Control units secured a 53.37% share in 2025, reflecting early consumer preference for incremental upgrades that preserve existing fixtures while adding precise digital temperature and flow control. This format suits renovators who replace valves first and defer showerhead and body spray changes, which keeps upfront budgets contained in the United States smart shower market. Integrated Smart Shower systems that bundle leak detection, flow monitoring, and auto-shutoff capabilities are forecast to grow at a 17.49% CAGR through 2031 as insurance alignment and rebates reward systems that can verify water savings and prevent damage. Carrier programs that promote or require approved leak-monitoring solutions also shift behavior toward integrated setups that address loss prevention and user comfort in one package. As digital showering moves from niche to mainstream, combined control-and-monitor solutions will continue to gain traction among households that value both convenience and risk mitigation in the United States smart shower market.
Category lines are set to blur as vendors elevate base specifications, making leak analytics and app-based scheduling core to most launches while reserving multi-sensory upgrades for premium tiers. WaterSense-aligned components remain essential for utility programs, which reinforces attention to measured flow performance and setpoint stability in the United States smart shower market. In parallel, regional code requirements, installer training, and reliable Wi-Fi connectivity are becoming gating factors for sustained adoption at scale. Vendors that support clean onboarding, robust connectivity, and long-term firmware updates will hold an advantage as integrated systems replace control-only entries over the forecast period. This evolution reflects a broader transition where the United States smart shower market shifts from single-device improvements to ecosystem solutions that combine safety, conservation, and daily personalization.


By End User:
Residential Dominance Masks Commercial VelocityResidential users accounted for 61.73% of demand in 2025, supported by a large installed base and ongoing replacement cycles that favor smart controls and leak monitoring as logical upgrades. The mix of home-based work, higher time spent indoors, and rising comfort expectations continues to position bathroom upgrades as a favored investment category in the United States smart shower market. Facility-grade IoT, leak analytics, and predictive maintenance capabilities are strengthening commercial buyers’ confidence and elevating expectations for residential-grade reliability. As households weigh costs and benefits, the availability of insurance-driven discounts and utility-aligned rebates further improves the value equation in key regions of the United States smart shower market. Over the forecast, Residential remains central to unit volume, while connected platforms will increasingly shape buying criteria for remodels and replacements.
Spas & Wellness Centers are the fastest-growing commercial subsegment, with operators using chromotherapy and personalization to differentiate guest experiences and command premium pricing. Hotels and other commercial venues are also exploring smart showering within broader restroom technology upgrades that aim to improve customer satisfaction and streamline maintenance. Convenience and fuel retailers show how smart restroom features can lift brand perception and drive repeat visits, signaling crossover potential into hospitality and fitness. Facility managers benefit from live dashboards and restocking alerts that eliminate unnecessary checks and cut downtime, an operational model that aligns with predictive maintenance for connected showers. These commercial behaviors continue to influence residential expectations, reinforcing the role of automation and verified conservation across new and retrofit projects in the United States smart shower market.

By Distribution Channel:
Exclusive Stores Disrupt Multi-Brand ParadigmsMulti-Brand Stores captured 67.35% of 2025 revenue, reflecting the convenience of comparing several brands in one location and the influence of contractor programs that steer product selection to stocked assortments. Hands-on displays and in-aisle demonstrations help convert customers who arrive for basic replacements but leave with connected upgrade kits in the United States smart shower market. In parallel, e-commerce and direct-to-consumer websites complement physical showrooms by enabling research and virtual guidance before an in-store or installer-assisted purchase. Consumers benefit when they can test feature sets and see app experiences, which reduces uncertainty and improves attachment rates for accessories within the United States smart shower market. As brands refine merchandising and bundled offers, multi-brand distribution will continue to anchor volume while evolving toward experiential selling.
Exclusive Stores and direct brand channels are growing faster at a projected 19.76% CAGR as immersive galleries and owned retail formats demonstrate advanced configurations that general showrooms cannot replicate at scale. These locations highlight full multi-sensory experiences and integrated controls, which help buyers understand the benefits of premium packages in the United States smart shower market. Digital-native manufacturers are also using direct channels to compress the buying cycle, offering virtual consultations, extended trials, and simplified returns to accelerate adoption. Retail partnerships with conservation programs that spotlight WaterSense eligibility continue to guide buyers toward compliant solutions that qualify for rebates. Over time, boundaries will continue to blur as multi-brand showrooms add richer interactivity and direct channels expand service networks to improve installation and support.
Geography Analysis
Southern United States Smart Shower Market
The South United States region held 31.39% of 2025 revenue, reflecting population inflows, a broad housing pipeline, and steady renovation activity across sunbelt markets. In many Southern metros, residential development and the large base of existing homes support both premium remodels and mid-price smart upgrades in the United States smart shower market. Insurance-led incentives and better broadband infrastructure are also improving readiness for connected fixtures and real-time monitoring in more counties and suburban communities. Code requirements vary by jurisdiction and can add components to the bill of materials, but they also standardize performance expectations for new builds and major remodels. As carriers and builders align on leak prevention and verifiable conservation, adoption will continue to benefit from risk reduction and lifecycle cost savings.
Western United States Smart Shower Market
The West United States region is projected to grow at a 12.39% CAGR, supported by aggressive water conservation policies, high-income technology hubs, and sustained interest in sustainability-led renovations. Eligible households can access rebates from major water agencies for qualified flow monitors, which amplifies the appeal of integrated smart shower systems that verify savings alongside comfort in the United States smart shower market. Cities and utilities are also advancing complementary programs that encourage outdoor water savings, which indirectly unlock household budgets for in-home conservation upgrades. Adoption of recirculating systems that can cut water usage by up to 80% shows how Western consumers weigh upfront investment against long-term resilience and environmental gain. These dynamics contribute to a clear runway for growth while shaping specifications that emphasize monitoring, automation, and resource efficiency.
Midwestern and Northeastern United States Smart Shower Market
Midwestern and Northeastern states trail the West on rebates and code-driven pull but still show distinct pathways to adoption based on property age, freeze risk, and coastal income patterns. Older housing stock can raise retrofit costs by requiring electrical upgrades and plumbing adjustments before digital valves and hubs can operate reliably in the United States smart shower market. In freeze-prone markets, carrier emphasis on leak prevention and pipe protection strengthens the case for whole-home monitoring and automatic shutoff. Coastal metros in the Northeast add premium demand from higher-income households that invest in wellness features and digital control consistency across bathroom fixtures. Regional distributors and installers will continue to tailor offers to local code expectations and buyer priorities, while retailers leverage WaterSense guidance to simplify product selection.
Regulatory Landscape
The United States smart shower market operates under a mix of federal efficiency test procedures and state and local plumbing and building codes that shape product design, installation, and compliance documentation. At the federal level, the US Department of Energy test procedures under 10 CFR 430 reference ASME A112.18.1/CSA B125.1 methods for flow-rate measurement, while the EPA WaterSense program provides a voluntary labeling pathway for showerheads, with third-party certification and broad market signaling through its network of 2,200+ partners and 45,000+ certified product models.
At the code level, plumbing safety requirements such as anti-scald protection influence smart valve and controller specifications. The 2024 International Residential Code (IRC) Section P2708.3 requires pressure-balancing or thermostatic mixing valves with high-limit stops (listed to ASSE 1016 or ASSE 1070), which reinforces the need for compliant thermostatic controls in smart shower installations. Model codes such as IAPMO-owned National Standard Plumbing Code (NSPC), updated on a three-year cycle, further affect local adoption and inspection expectations, shaping installer practices, retrofit complexity, and time-to-permit for digital shower upgrades.
Value Chain Analysis
The value chain for smart showers in the United States begins with upstream components (thermostatic and pressure-balancing valves, sensors, flow meters, shutoff actuators, Wi-Fi/Bluetooth modules, and firmware) and runs through branded fixture manufacturers and smart-water technology providers that integrate hardware with software platforms. Compliance and performance validation, including WaterSense labeling for qualifying showerheads and code conformance to ASSE/ASME-referenced standards, add a layer of testing, certification, and documentation that affects product roadmaps and SKU strategy.
Midstream, distribution is shaped by multi-brand retail and professional channels, supported by installers and plumbers who manage specification, permitting, and retrofit labor. Downstream, the market is increasingly service-linked through app ecosystems, cloud analytics, and partnerships that connect connected water devices to risk mitigation and underwriting, illustrated by insurer-aligned programs pairing smart shutoff technology with residential insurance offerings. Innovation partnerships also speed up value-chain development, where established bathroom brands work with specialized technology firms and innovation hubs to embed sensing, data, and water-efficiency capabilities into traditional shower portfolios.
Competitive Landscape
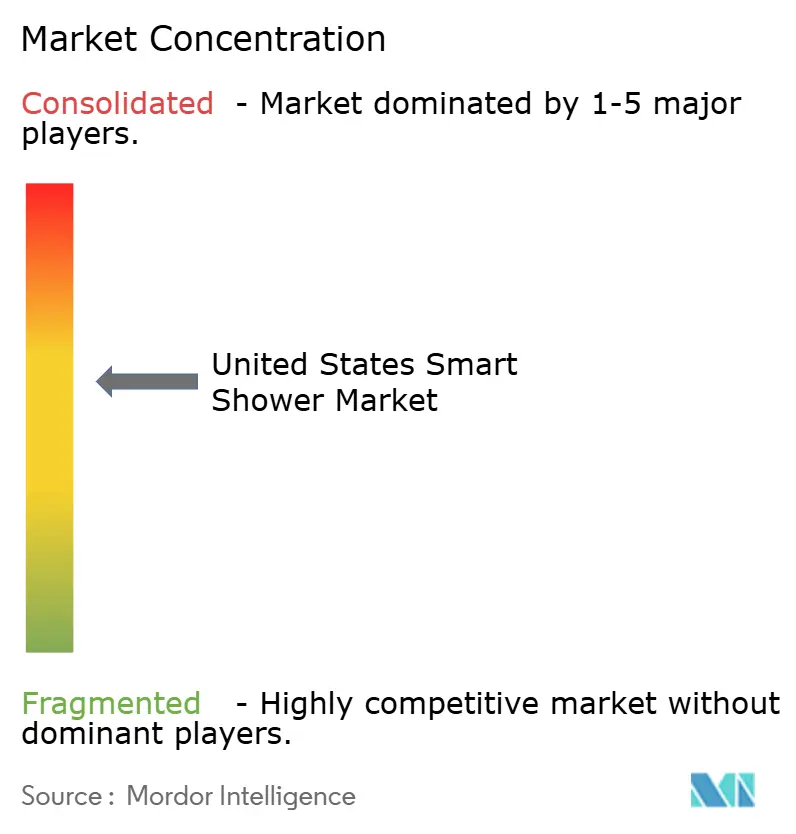
The United States smart shower market remains moderately concentrated, with the leading brands capturing a significant share of revenue, while still allowing space for differentiated challengers to enter and compete. Incumbents benefit from vertical integration, trusted service networks, and showroom coverage that makes discovery straightforward for homeowners and installers. New entrants and adjacent water-tech players are focusing on retrofit-friendly devices and conservation-first value propositions to access customers priced out of luxury-tier systems. Insurer alignment continues to influence channel dynamics and brand choice as device approval lists and discounts steer demand toward partners that reduce claim exposure. This environment supports product segmentation where premium integrated systems and practical conservation bundles both find qualified buyers.
Strategic partnerships are an important lever for distribution, credibility, and category education, with insurers and device makers using risk-sharing models to expand adoption. Notable alliances include Moen’s arrangement with a homeowners' insurance provider to scale leak monitoring and automatic shutoff, as well as Nationwide’s program with Phyn that incentivizes professional-grade installation for high-value properties. Portfolio rationalization also features as vendors concentrate capital on connected fittings and smart controls that support higher margins and long-term differentiation. Mergers and acquisitions are reinforcing adjacent wellness capabilities, adding steam and sauna expertise that complements high-end digital showering within integrated experiences. These moves strengthen value propositions around risk mitigation, verified conservation, and everyday convenience that collectively define buyer expectations in the United States smart shower market.
Technology priorities now include robust voice control, long-lived firmware support, and analytics that translate water and usage data into clear value for homeowners and facility managers. Vendors competing on integrations and ecosystem consistency are targeting simplified onboarding and strong app experiences to reduce friction in multi-brand bathrooms. Conservation verification and compliance with WaterSense and local code signals continue to be competitive must-haves given their role in rebates and incentives. These elements provide tangible outcomes that buyers can verify through utility bills and insurer discounts, which support repurchase and referral potential in the United States smart shower market. As interoperability improves, competition will move further into software-defined experiences and service reliability, both of which anchor brand equity in connected plumbing.
United States Smart Shower Industry Leaders
Roca Sanitario, S.A.
TOTO LTD.
Moen Incorporated
LIXIL Corporation
Kohler Co.
- *Disclaimer: Major Players sorted in no particular order
United States Smart Shower Market Companies Covered in this Report
- Kohler Co.
- Moen (Fortune Brands Innovations)
- LIXIL Group (American Standard, Grohe)
- Delta Faucet (Masco Corp.)
- Hansgrohe SE
- Roca Sanitario
- Brizo
- Gessi S.p.A.
- Jaquar Group
- Aqualisa
- Jacuzzi Brands LLC
- RainStick Shower
- U by Moen
- Hydrao
- Vigo Industries
- Speakman
- Ebb-And-Flow Smart Showers
- WaterHawk
- DreamSpa
- Methven USA

Market Opportunities and Future Outlook
Insurance-linked smart water programs provide a direct commercialization path for smart shower-adjacent controls, including leak monitoring, whole-home shutoff, and usage analytics, because they shift purchase justification from convenience to measurable risk reduction. In July 2026, Moen and Stand Insurance launched a program pairing Moen Flo smart water shutoff technology with property insurance, reinforcing a go-to-market model that combines devices, installation, and financial incentives. For smart shower vendors, this opens space for bundled offerings that combine digital shower controls with leak detection and shutoff, particularly in retrofit-heavy homes where water-damage prevention can be framed alongside comfort and personalization.
Water-efficiency innovation and verification also remain a practical opportunity area as utilities and consumers rely on recognizable benchmarks to compare products. The EPA WaterSense label offers a widely used reference point for efficient fixtures, supported by a partner network and a broad catalog of certified models, which helps smart showers that can integrate compliant spray hardware with monitoring and reporting. On the product side, manufacturer-technology collaborations point to ongoing pipeline development for ultra-low-flow solutions, such as Roca Group Ventures work with Hydrao announced in 2024 to develop next-generation water-efficient technologies with planned product launches in 2026, aligning conservation-first hardware with connected control experiences.
Recent Industry Developments in United States Smart Shower Market
- May 2026: TOTO Ltd and LIXIL Corporation - These companies leverage integrated systems and exclusive partnerships with major Japanese homebuilder networks to sustain market control for digital and smart shower solutions within the Japanese market. The collaborations reinforce ecosystem reach and help preserve their position as demand for connected bathroom experiences grows.
- September 2025: Kohler Co. expands Anthem+ smart shower system by integrating with the Control4 smart home platform. The update expands whole-home automation capabilities and insurer-aligned value proposition, which can accelerate retrofit adoption in the US market.
- April 2025: LIXIL and American Bath Group finalize exclusive licensing rights for American Standard, DXV, and Eljer brands to ABG; ABG acquires LIXILs Salem, Ohio facility and other assets. The agreement strengthens distribution and production capabilities for LIXIL brands in the US, potentially reshaping competitive dynamics in smart shower adjacent segments.


United States Smart Shower Market Report Scope and Research Methodology
Market Definition and Coverage
For this study, the United States smart shower market covers connected shower hardware that lets users control temperature, flow, and presets through digital interfaces, apps, or voice assistants, and it includes related controller units sold for shower use.
Scope exclusions: We exclude standard (non-connected) shower heads and valves, general bathroom renovation labor, and whole-home water heaters that are not sold as part of a smart shower solution.
Segments Covered in This Report
- By Type
- Smart Shower Control
- Smart Shower
- By End User
- Residential
- Commercial
- Hotels & Restaurants
- Spas & Wellness Centers
- By Distribution Channel
- Multi-Brand Stores
- Exclusive Stores
- By Geography
- Northeast
- Midwest
- South
- West
Data Sources, Market Sizing, and Validation
Desk Research
Desk research starts by mapping the demand environment for shower upgrades and smart home adoption, then narrowing it to the U.S. shower fixture replacement cycle. We used public sources such as the U.S. Census Bureau (housing and construction data), the U.S. Energy Information Administration (hot water and energy context), the EPA WaterSense program materials, and the Bureau of Labor Statistics (price inflation and consumer spend indicators) to keep assumptions anchored.
We also reviewed company filings, investor presentations, product specification sheets, and reputable building and plumbing association publications to understand feature trends, channel mix, and typical price bands. For gap filling, we selectively used paid subscriptions focused on company financials and intelligence, news and financials, patent databases, and an import-export shipment-level database to cross-check momentum for connected fixture components. The sources listed here are illustrative, and many other public and paid references were also used for data collection and clarification.
Primary Interviews and Surveys
Primary interviews and surveys cover manufacturers, distributors, installers, remodelers, designers, and hospitality buyers active in the United States. Respondents help clarify adoption levels, system pricing, replacement timing, channel mix, installation barriers, and demand for water-saving controls. Analysts compare these responses with U.S. desk inputs, investigate conflicting answers, fill data gaps, and triangulate the final model.
Distribution of primary research fieldwork respondents
| Company type | Respondent position |
|---|---|
| Top tier: 30% | CXOs: 15% |
| Mid tier: 45% | Functional/Unit leaders: 30% |
| Smaller Players: 25% | Managers: 55% |
Market-Sizing & Forecasting
Sizing begins with a top-down demand pool build-up that links U.S. housing stock and remodeling activity to addressable shower upgrades, then applies smart-fixture adoption and replacement timing to convert that pool into annual value. To keep the totals realistic, the outcome is then checked with selective bottom-up approximations, such as sampled average selling price (ASP) by product type multiplied by estimated unit volumes from channel feedback.
Key inputs in the model include the pace of bathroom remodel spending, the share of households with smart home devices, water efficiency and conservation signals that influence upgrade intent, installed base and replacement cycles for shower fixtures, and observed ASP progression for connected controllers and shower hardware. When primary inputs differed by region, assumptions were kept separate and then aggregated to a U.S. total to avoid over-smoothing.
Forecasts were produced using scenario analysis supported by trend projections on the above variables, then pressure-tested with expert expectations around premiumization, rebates or efficiency programs, and channel expansion. Where hard volume signals were incomplete (for example, when products were sold as part of wider bathroom bundles), we used conservative allocation factors validated through installer and distributor feedback before finalizing the totals.
Data Validation & Update Cycle
Validation is done through a set of cross-checks that compare the model outputs to independent indicators like housing completions, remodeling intensity, and price inflation for related fixtures. Outliers are flagged, reviewed by another analyst, and then traced back to the assumption that created the jump, after which interviews are revisited when a mismatch stays unresolved.
Before sign-off, the full workbook goes through multi-step internal review so formulas, unit conversions, and year-on-year movements are consistent. Reports are refreshed annually, and interim updates are triggered when a material event changes pricing, channel availability, or adoption patterns. Right before delivery, a fresh pass is completed so clients receive the most current view that can be supported by documented inputs.
Mordor Intelligence's United States Smart Shower Market Size Compared With Other Published Estimates
Published market sizes for smart showers can look far apart because each publisher draws the product line differently and uses a different timing for pricing and adoption. Differences also come from whether the estimate is built from housing demand signals or from a narrower supplier view, and then scaled up with assumptions.
Some estimates broaden the definition to include smart shower panels and adjacent smart bathroom devices that are often purchased in the same remodel basket, which pushes totals upward. Mordor Intelligence counts smart shower value only when the product is a connected shower-specific control or hardware sold for shower use, and it keeps non-connected fixtures and general renovation services out of scope.
Benchmark comparison
| Source | Market Size | Gaps in Research Methodology |
|---|---|---|
| Mordor Intelligence | USD 0.83 B (2026) | |
| Regional Consultancy A | USD 1.80 B (2026) | Uses a broader product set that includes smart shower panels and bundled bathroom smart devices, and it applies a more aggressive penetration curve over the same starting year. |
| Trade Journal B | USD 0.45 B (2024) | Regional scope is North America and the year is earlier, so the figure is not directly comparable, and published detail on U.S.-only splits and pricing treatment is limited. |
The spread across published values mostly comes from scope expansion and timing. Those two choices change both units and ASP assumptions. By keeping the counted revenue tied to shower-specific connected hardware and by cross-checking totals against housing and remodeling signals, the resulting size stays traceable to repeatable steps.


Key Questions Answered in the Report
What is the current size and growth outlook for the United States smart shower market?
The United States smart shower market size is USD 0.83 billion in 2026 and is projected to reach USD 1.49 billion by 2031 at a 12.34% CAGR.
Which product type is growing fastest within connected showering in the United States?
Integrated Smart Shower systems that combine leak detection and auto-shutoff are forecast to expand at a 17.49% CAGR through 2031, outpacing control-only units.
How are rebates and policies influencing the adoption of smart showers?
Western utilities and agencies offer qualified rebates, such as up to USD 200 for eligible flow monitors, and WaterSense standards at 2.0 gpm guide-compliant products that qualify for programs.
What role do insurers play in accelerating connected shower adoption?
Insurers are partnering with water-tech providers to subsidize leak monitoring and automatic shutoff, offering discounts and device programs that lower barriers to installation.
Which regions show the strongest momentum for United States smart showers?
Which regions show the strongest momentum for United States smart showers?
What are the main consumer concerns with connected showering?
High upfront costs and ongoing privacy-security concerns are the key restraints, though rebates, insurer programs, and stronger device security practices are easing barriers.
Page last updated on:


 Your data is secure and never sold or shared.


