Electric Blankets Market Size and Share
Market Overview
| Study Period | 2020 - 2031 |
|---|---|
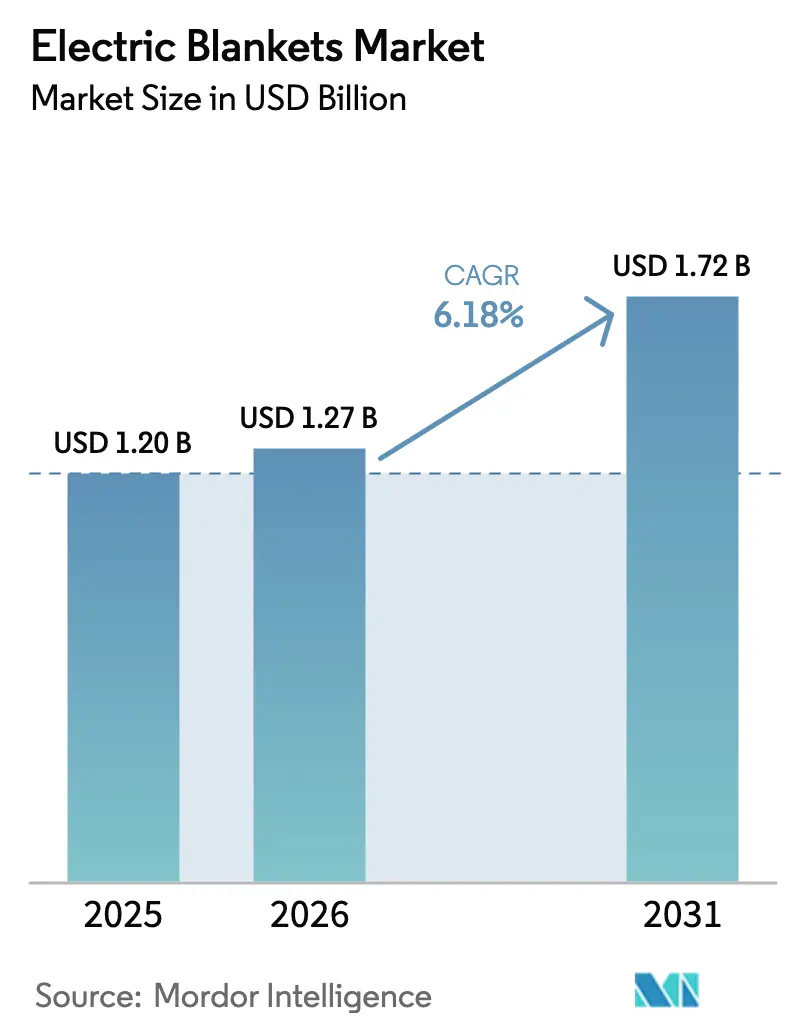
| Market Size (2026) | USD 1.27 Billion |
| Market Size (2031) | USD 1.72 Billion |
| Growth Rate (2026 - 2031) | 6.18% CAGR |
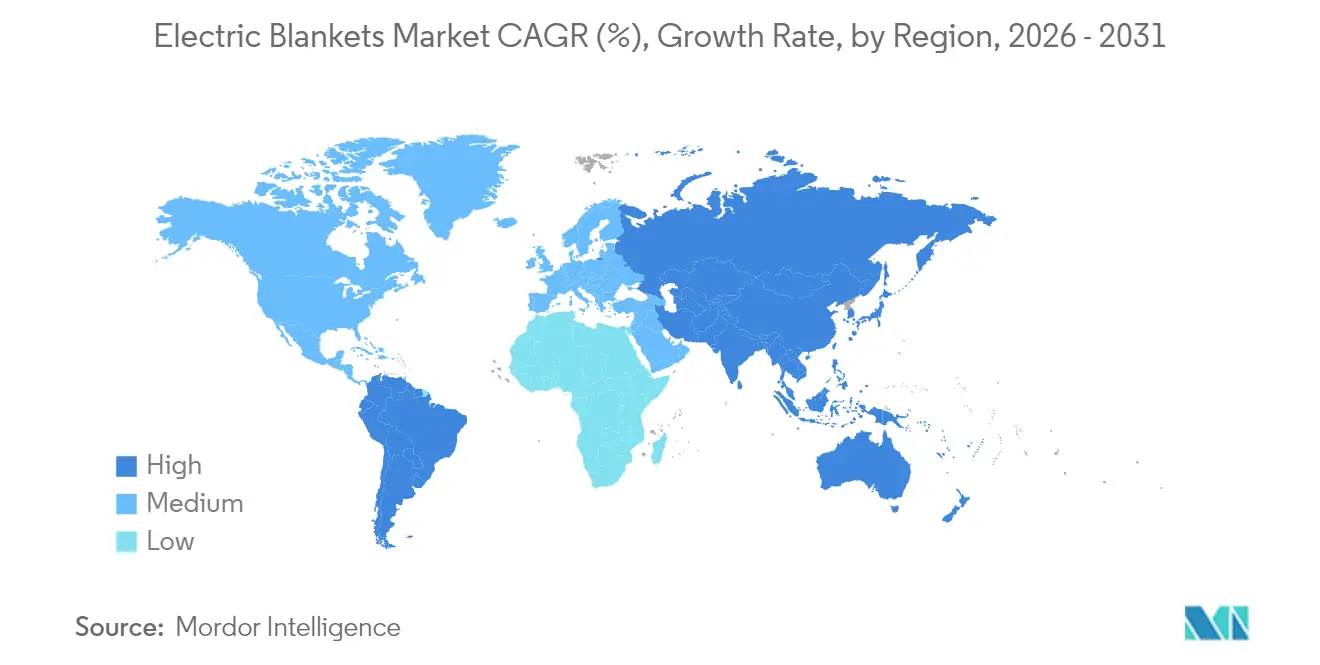
| Fastest Growing Market | Asia Pacific |
| Largest Market | North America |
| Market Concentration | Medium |
Major Players *Disclaimer: Major Players sorted in no particular order Image © Mordor Intelligence. Reuse requires attribution under CC BY 4.0. | |
Electric Blankets Market Analysis by Mordor Intelligence
The electric blankets market size is expected to grow from USD 1.20 billion in 2025 to USD 1.27 billion in 2026 and is forecast to reach USD 1.72 billion by 2031 at 6.18% CAGR over 2026-2031. The cost advantage of running a blanket rated at 50–150 watts per hour compared with space heaters that draw 750–1,500 watts keeps demand rising, even when household budgets tighten. Adoption gains further traction because digitally controlled models let users warm only the space they occupy, dovetailing with national energy-efficiency targets that now shape product design across mature and emerging economies. North America remains the revenue anchor, yet the electric blankets market is adding new volume fastest in Asia-Pacific where first-time buyers converge with rapid urbanisation. Competitive pressure is escalating: five global manufacturers account for a meaningful slice of the electric blankets market and use that scale to accelerate safety upgrades, material innovation, and omnichannel distribution.
Key Report Takeaways
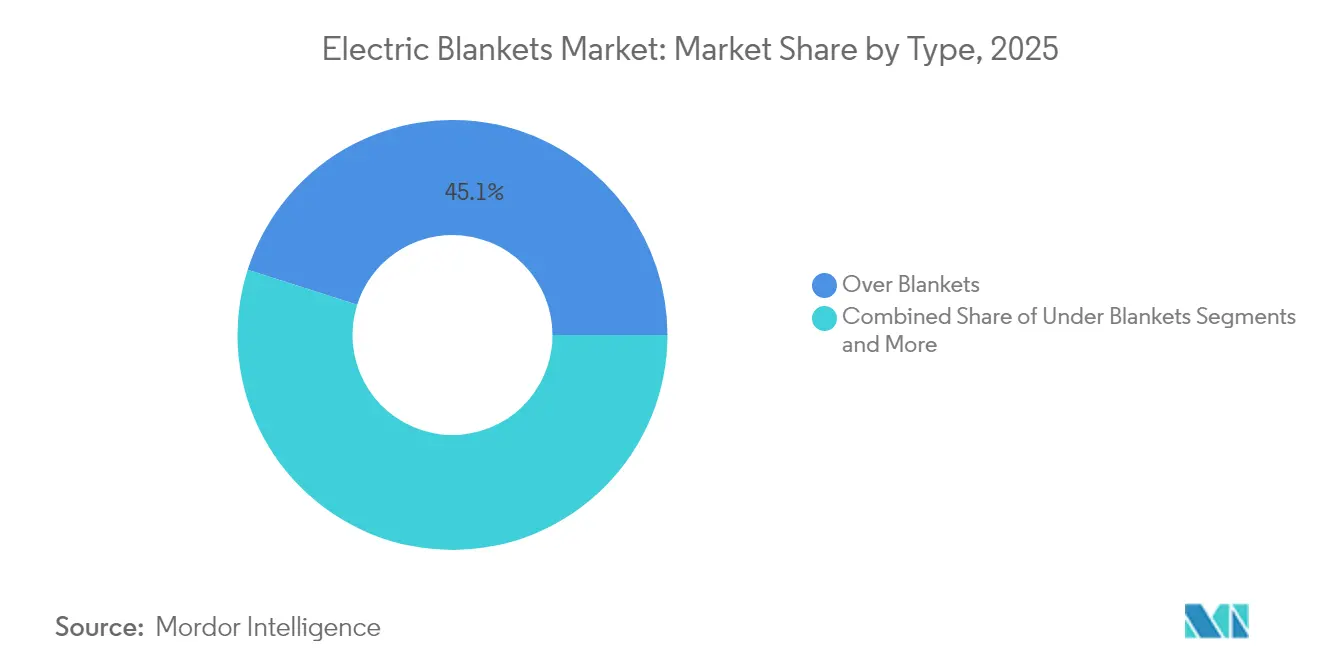
- By product type, over blankets led with 45.10% of electric blankets market share in 2025, while under blankets are projected to grow at a 6.88% CAGR through 2031.
- By material, polyester commanded 42.63% share of the electric blankets market size in 2025; Fleece is expected to expand at a 9.76% CAGR to 2031.
- By size, queen variants captured 37.81% of the electric blankets market size in 2025; Single is the fastest-growing at a 7.95% CAGR for 2026-2031.
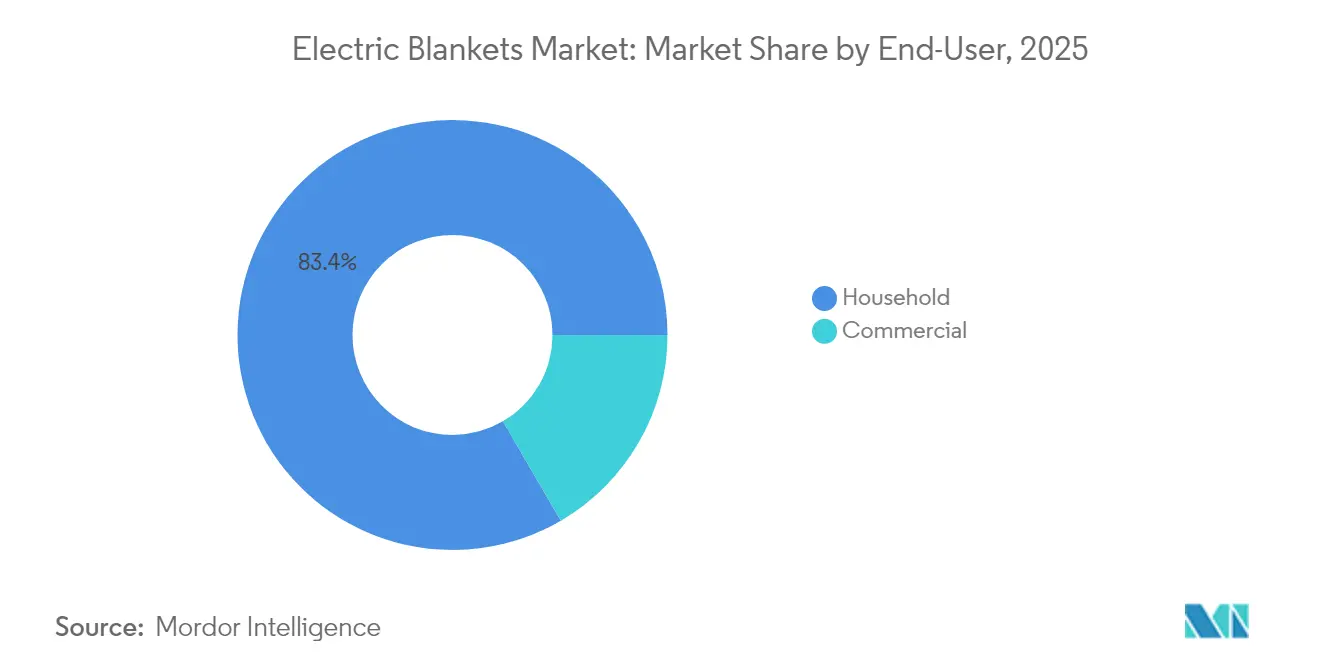
- By end-user, households accounted for 83.41% of the electric blankets market size in 2025; hospitality is advancing at a 11.47% CAGR.
- By distribution channel, offline outlets held 61.41% share in 2025; online platforms are climbing at a 13.77% CAGR during the forecast period.
- The electric blankets market shows moderate concentration as Sunbeam Products/Newell Brands, Beurer GmbH, Rainbow Appliance Group (RUIANBAO), Biddeford Blankets, and Silentnight Group together controlled a significant share in 2025.
Note: Market size and forecast figures in this report are generated using Mordor Intelligence’s proprietary estimation framework, updated with the latest available data and insights as of 2026.
Global Electric Blankets Market Trends and Insights
Drivers Impact Analysis*
| Driver | (~) % Impact on CAGR Forecast | Geographic Relevance | Impact Timeline |
|---|---|---|---|
| Rising Demand for Energy-Efficient Heating Solutions | +2.1% | Global, with higher impact in North America and Europe | Medium term (2-4 years) |
| Technological Advancements and Smart Features | +1.8% | North America, Europe, High-income Asia-Pacific | Long term (≥ 4 years) |
| Health and Therapeutic Benefits | +1.2% | Global, with concentration in aging populations | Medium term (2-4 years) |
| Expansion into Emerging Markets | +0.8% | Asia-Pacific, South America, Middle East & Africa | Long term (≥ 4 years) |
| Seasonal Demand and Cold Climates | +0.5% | North America, Europe, Northern Asia | Short term (≤ 2 years) |
| Source: Mordor Intelligence | |||
Rising Demand For Energy-Efficient Heating Solutions
Escalating energy tariffs are reshaping household behaviour. Consumers increasingly swap full-room systems for targeted warmth that costs only a fraction to run. Operating an electric blanket through the night now often totals less than the price of running central heating for one hour. That saving directly supports national emission-reduction goals by curbing residential power draw. Brands have responded with zonal thermostats and automatic shut-off timers that tailor heat output to user routines and avoid unnecessary energy loss. These attributes reinforce the appeal of the electric blankets market during winter spikes and in regions facing volatile utility bills.
Technological Advancements and Smart Features
The arrival of Wi-Fi modules, voice-assistant links, and learning algorithms is repositioning blankets as integral parts of connected sleep ecosystems. The Internet of Things Advisory Board has identified smart home integration as a key growth vector, with particular emphasis on interoperability standards that enable seamless integration with existing home automation systems [1]Source: National Institute of Standards and Technology, “Recommendations of the Internet of Things Advisory Board,” nist.gov. Dual-zone control lets partners keep individual comfort settings without wasting power. Adherence to open interoperability standards ensures a blanket can pair with existing smart-home hubs and sleep-tracking applications, which refine heat cycles in line with circadian patterns. Remote firmware updates extend product life by adding features post-purchase, a service model that deepens brand loyalty in mature segments of the electric blankets market.
Health and Therapeutic Benefits
Far-infrared elements embedded in premium lines provide deeper heat penetration that eases muscular tension and improves circulation for users with chronic pain. Hospitals apply electric blankets for peri-operative warming to maintain core temperature, a use case that proves the technology’s clinical relevance. Antimicrobial fabrics and precise temperature guards are filtering into consumer versions, letting households replicate similar wellness benefits. This shift aligns with the global wellness economy’s multitrillion-dollar scope and elevates the electric blankets industry from seasonal comfort to year-round self-care.
Expansion into emerging markets
Urbanisation and rising middle-class incomes in Asia-Pacific, South America, and parts of Africa generate demand among households upgrading from rudimentary heating to modern, energy-saving alternatives. Manufacturers adapt voltage, plug design, and price points to local grid conditions and budgets. E-commerce platforms overcome limited physical retail, spreading product awareness through reviews and influencer demonstrations. As familiarity grows, consumers upgrade from basic polyester models to fleece and smart versions, sustaining long-term expansion for the electric blankets market.
Restraints Impact Analysis*
| Restraint | (~) % Impact on CAGR Forecast | Geographic Relevance | Impact Timeline |
|---|---|---|---|
| Safety Concerns and Product Reliability | -1.2% | Global, with higher impact in regions with limited regulatory oversight | Medium term (2-4 years) |
| High Product Prices and Limited Awareness in Emerging Markets | -0.9% | Asia-Pacific, South America, Middle East & Africa | Short term (≤ 2 years) |
| Competition from Alternative Heating Solutions | -0.7% | Global | Medium term (2-4 years) |
| Seasonal Demand Cycles | -0.5% | Regions with distinct seasonal variations | Short term (≤ 2 years) |
| Fluctuating Raw Material Prices and Supply-Chain Disruptions | -0.4% | Global, with higher impact on manufacturers in Asia-Pacific | Short term (≤ 2 years) |
| Source: Mordor Intelligence | |||
Safety Concerns and Product Reliability
The 2022 revision of IEC 60335-2-17 tightened limits for overheat protection, leakage current, and controller accuracy. Compliance boosts consumer trust yet adds cost and lengthens development cycles. Brands counter hesitation by highlighting automatic shut-off functions, low-EMF wiring, and multistage safety testing on packaging and online listings. Transparent certifications under schemes such as UL 964 or the Japanese PSE label differentiate legitimate products from low-quality imports, a distinction vital to safeguarding the reputation of the electric blankets market.
High Product Prices and Limited Awareness In Emerging Markets
Smart blanks priced for affluent households remain out of reach for many first-time buyers. To bridge the gap firms release stripped-down versions that retain safety essentials while dropping advanced dashboards. Educational campaigns frame blankets as investments that reduce overall heating bills, a message that resonates when local power costs spike. Partnerships with regional e-commerce leaders allow time-limited discounts and installment payments that soften the initial outlay, gradually enlarging the electric blankets market in cost-sensitive geographies.
*Our forecasts treat driver/restraint impacts as directional, not additive. The impact forecasts reflect baseline growth, mix effects, and variable interactions.
Segment Analysis
By Type: Over Blankets Retain Volume Leadership While Under Blankets Accelerate
Over Blankets held 45.10% of the electric blankets market in 2025 by offering portable warmth for beds, sofas, and vehicles. Their intuitive plug-and-play design keeps replacement cycles brisk, notably in climates with pronounced winter seasons. Under Blankets, projected at a 6.88% CAGR through 2031, satisfy rising interest in sleep-centric products that draw minimal power and provide uniform heat all night. Heated Throws add aesthetic flair for modern living rooms, whereas Electric Pads maintain a niche for targeted muscle relief.
Growing awareness of sleep hygiene shifts buyer attention toward Under Blankets that integrate pressure sensors, quilted toppers, and low-EMF wiring. These upgrades guard against hot spots and enhance nightly rest quality, reinforcing the premium narrative. Brands market each model within broader smart-bed ecosystems, encouraging users to synchronise heat schedules with lighting and audio cues, a trend that strengthens recurring sales inside the electric blankets market. The IEC 60335-2-17:2022 standard has introduced specific requirements for control elements and overheating protection, driving innovation in safety features across all product types International Electrotechnical Commission .


By Size: Queen Dominates Yet Singles Deliver Outsize Growth
Queen models captured 37.81% of the electric blankets market size in 2025, reflecting bed-frame norms across North America and Europe. Dual controllers let couples fine-tune temperatures on each side, cutting disputes and reinforcing perceived value. Single blankets, however, are expanding fastest at a 7.95% CAGR through 2031. Solo urban dwellers, students, and seniors appreciate compact options that fit smaller rooms and lower energy bills.
Manufacturers are responding with storage-efficient designs and multi-functional features that enhance the value proposition in space-constrained environments. These smaller formats are increasingly designed with senior-specific features, including simplified controls, higher safety margins, and therapeutic heat distribution patterns that address age-related circulatory issues. King sizes retain premium cachet by adding multi-zone regulation and app dashboards that justify higher prices, while Full sizes preserve relevance as flexible solutions for guest rooms and transitional households.
By Material: Polyester Cost Edge Challenged by Fleece Comfort
Polyester led with a 42.63% share in 2025 as a durable, budget-friendly option compatible with heating filaments. Microfiber advances now create finer yarns that mimic natural feel without price inflation. Fleece, predicted to grow at a 9.76% CAGR through 2031, offers plush texture and heat retention that permits lower thermostat settings, aligning comfort with conservation.
The fleece surge underscores shifting consumer priorities toward sensory experience and sustainability. Producers invest in proprietary blends that resist pilling, maintain thermal efficiency after repeated washing, and curb electromagnetic emissions. Cotton attracts eco-minded shoppers willing to pay premiums for natural fibres, while faux fur articulates décor aspirations, especially in gifting seasons. Limited runs in wool-synthetic hybrids appeal to outdoor enthusiasts who need moisture management alongside warmth.
By End-User: Household Saturation Steers Attention to Commercial Venues
Households still anchored 83.41% of revenue in 2025, yet hotels and resorts represent the quickest incremental gain with an 11.47% CAGR through 2031. Properties weave heated bedding into wellness packages, raising room rates and guest satisfaction scores. Senior-living communities adopt blankets to aid circulation and cut HVAC loads in private suites.
Healthcare facilities deploy clinical-grade blankets for recovery wings, creating steady off-season demand that smooths revenue across the electric blankets market. Student dormitories buy in bulk, valuing durability and energy-saving certifications that align with campus sustainability plans. Transportation providers exploring battery-ready formats for first-class rail cabins and overnight coaches open a niche that expands addressable volume beyond conventional bedrooms.
By Distribution Channel: Online Growth Reshapes Retail Landscape
Offline stores still claimed 61.41% of 2025 sales, as many shoppers prefer to touch fabrics and test products before purchase. Specialist bedding outlets use trained staff to translate technical jargon into tangible benefits, preserving foot traffic against digital competitors. Online channels, running at a 13.77% CAGR through 2031, thrive on detailed photography, community reviews, and quick price checks that shrink hesitation.
Brand websites amplify storytelling around innovation and sustainability, while marketplace portals ensure reach and logistical ease. Newell Brands' Network Optimization Project, initiated in 2023, aims to streamline the North American distribution network by reducing distribution centers while enhancing service capabilities, indicating strategic adaptation to changing channel dynamics . Omnichannel tactics such as click-and-collect marry digital selection with instant pickup, reinforcing trust among cautious buyers. Supply-chain overhauls, exemplified by Newell Brands’ consolidation of North American distribution centres, shorten lead times and provide extra working capital for product engineering.
Geography Analysis
North America retained 49.05% of 2025 revenue thanks to cold winters, high discretionary incomes, and seasoned distribution networks. Growth centres on feature-rich models that integrate with smart-home hubs rather than on first-time purchases. Strict compliance with UL 964 requirements sustains consumer trust and influences global design standards. Canada shares these traits, with longer heating seasons elevating the energy-efficiency pitch. Mexico records sharper unit growth, centered in metropolitan zones where middle-class buyers adopt modern comfort technologies.
Asia-Pacific charts the steepest trajectory, expanding at a 12.13% CAGR through 2031. Japanese consumers expect high technical precision and elect products bearing the PSE mark, which protects incumbents but rewards exporters able to meet the bar. India’s northern belt sees quick penetration as rural electrification improves and e-commerce fills retail gaps. South Korea’s early embrace of home automation makes connected blankets commonplace, while Australia exhibits concentrated demand during winter months marked by elevated electricity tariffs. Emerging Southeast Asian economies gradually adopt blankets as air-conditioning costs drive interest in targeted warmth for cooler evenings.
Europe features sophisticated buyers who favor natural materials and robust safety assurances. The United Kingdom headlines adoption, buoyed by the notable price gap between whole-home heating and blanket use. Germany’s consumers gravitate to precision engineering, reinforcing domestic champions such as Beurer. Nordic nations show high per-capita usage given protracted cold seasons, whereas Southern European markets depend more on hospitality acquisitions that offset milder domestic climates. Central and Eastern Europe present new room for growth as disposable incomes rise and renovation programs retrofit legacy heating infrastructure.

Competitive Landscape
The electric blankets market shows moderate concentration as Sunbeam Products/Newell Brands, Beurer GmbH, Rainbow Appliance Group (RUIANBAO), Biddeford Blankets, and Silentnight Group together controlled a significant share in 2024. Scale enables these companies to underwrite R&D into low-EMF circuitry, sustainable fabrics, and app ecosystems. Vertical integration ensures component availability and consistent quality, vital when products must pass divergent regional certifications.
Technology leadership is the primary differentiator. Beurer’s fifth consecutive “Brand of the Century” accolade validates its emphasis on ergonomic design, recyclable packaging, and precision sensors. Sunbeam harnesses Newell Brands’ streamlined logistics to keep shelves stocked during seasonal peaks, limiting lost-sale risk. Rainbow Group leverages manufacturing depth in Ningbo to supply private-label clients abroad, broadening influence without heavy marketing spend.
Start-ups disrupt through direct-to-consumer models, small-batch designs, and influencer storytelling that humanises brand identity. Niche players also develop battery-powered travel blankets and hospital-grade products, extending the functional map beyond bedrooms. Consolidation trends, highlighted by Cathay Home’s acquisition of Sunham Home, signal ongoing restructuring as firms seek wider portfolios and diversified sourcing geographies.
Electric Blankets Industry Leaders
Sunbeam Products / Newell Brands Inc.
Beurer GmbH
Biddeford Blankets LLC
Silentnight Group Ltd.
Rainbow Appliance Group (RUIANBAO)
- *Disclaimer: Major Players sorted in no particular order


Recent Industry Developments
- March 2025: Cathay Home announced a Nicaragua factory set to become the largest home-textile hub in the Americas, enhancing electric blanket capacity and leveraging duty-free trade provisions.
- December 2024: Beurer opened an EUR 8 million (USD 8.7 million) production site in Indonesia to serve Asian, African, and Australian markets with heated blankets and pads.
- December 2024: Cathay Home acquired Sunham Home, adding soft-bedding lines and sourcing strength in India and Pakistan to its blanket portfolio.
- November 2024: Lifemax introduced a far-infrared blanket range aimed at improved circulation and muscle recovery, broadening the wellness application of heated bedding.


Research Methodology Framework and Report Scope
Market Definitions and Key Coverage
Our study defines the electric blankets market as electrically powered bedding products, including over-blankets, under-blankets, heated throws, mattress pads, and related control units, sold new to household and commercial end-users worldwide. These items use embedded heating wires or carbon elements that connect to mains power or low-voltage adapters and incorporate safety shut-offs and variable thermostats.
Scope Exclusion: Conventional (non-electrical) blankets and reusable chemical heat packs are outside the study scope.
Segmentation Overview
- By Type
- Over Blankets
- Under Blankets
- Electric Pads
- Heated Throws
- Heated Mattress Pads
- By Size
- Single
- Full
- Queen
- King
- By Material
- Polyester
- Cotton
- Fleece
- Faux Fur
- Wool
- Acrylic
- By End-user
- Household
- Single-family Homes
- Senior-Living Facilities
- Student Housing
- Commercial
- Hospitality (Hotels, Resorts, Rentals)
- Healthcare (Hospitals, Nursing Homes, Clinics)
- Transportation (Airlines, Rail, Coach)
- Household
- By Distribution Channel
- Offline
- Specialty Bedding Stores
- Mass-Merchandisers & Department Stores
- Supermarkets / Hypermarkets
- Online
- Offline
- By Geography
- North America
- Canada
- United States
- Mexico
- South America
- Brazil
- Peru
- Chile
- Argentina
- Rest of South America
- Asia-Pacific
- India
- China
- Japan
- Australia
- South Korea
- South-East Asia (Singapore, Malaysia, Thailand, Indonesia, Vietnam, Philippines)
- Rest of Asia-Pacific
- Europe
- United Kingdom
- Germany
- France
- Spain
- Italy
- BENELUX (Belgium, Netherlands, Luxembourg)
- NORDICS (Denmark, Finland, Iceland, Norway, Sweden)
- Rest of Europe
- Middle East & Africa
- United Arab Emirates
- Saudi Arabia
- South Africa
- Nigeria
- Rest of Middle East & Africa
- North America
Detailed Research Methodology and Data Validation
Primary Research
Discussions with managers at bedding brands, component suppliers, specialty retailers, and residential-care facilities across North America, Europe, and Asia-Pacific confirmed secondary patterns, revealed actual channel margins, and clarified regional penetration ceilings. Follow-up buyer surveys in Germany, Japan, and the United States adjusted adoption rates and price ladders used in our model.
Desk Research
Mordor analysts began with public datasets that anchor demand and production, such as import-export codes for heated bedding (UN Comtrade), household appliance shipments in China and the United States (National Bureau of Statistics, U.S. Census), winter heating degree-day trends (NOAA, Eurostat), and electricity price dashboards that shape running-cost perceptions (EIA, IEA). Complementary insight came from trade bodies, including the International Sleep Products Association and the Japan Electrical Manufacturers' Association, and safety regulations published by UL and IEC that influence product design cycles. Company 10-Ks, retailer investor decks, and reputable press releases helped our team map average selling prices and new product introductions. This list is illustrative; many further sources were reviewed to validate data points and clarify assumptions.
Market-Sizing & Forecasting
A blended top-down approach starts with production and trade data to recreate global volume, which is then multiplied by region-weighted average selling prices. Results are cross-checked with bottom-up indicators, including sampled supplier revenues and online channel unit sales, to refine totals. Key variables include household penetration of electric heating products, average blanket replacement cycle, winter severity index, retail ASP progression, online share of bedding sales, and residential electricity tariffs; each drives scenario sensitivity. Forecasts to 2030 use multivariate regression that links these drivers to historic sales, with expert-agreed scenarios guiding post-model adjustments. Gaps where supplier roll-ups were sparse were bridged by channel margin back-calculations and discrete price elasticity tests.
Data Validation & Update Cycle
Outputs pass three-layer checks: variance versus historical series, peer-to-peer model review, and a final lead-analyst sign-off. We refresh datasets annually and trigger mid-cycle revisions when energy-price shocks, major recalls, or regulation shifts materially move demand.
Why Mordor's Electric Blankets Baseline Commands Reliability
Published estimates seldom match because firms differ on what products they count, which channels they sample, and how quickly they refresh inputs. We place equal weight on transparent scope definition and data recency, so users can trace every figure back to a documented source or interview.
Key gap drivers arise when others exclude institutional demand, assume static ASPs, or roll forward legacy CAGRs without weather or price corrections; our framework corrects each weakness through live channel checks and climate-adjusted scenarios.
Benchmark comparison
| Market Size | Anonymized source | Primary gap driver |
|---|---|---|
| USD 1.20 billion (2025) | Mordor Intelligence | - |
| USD 1.18 billion (2024) | Global Consultancy A | Counts electric pads as separate, trimming overlap with heated throws and mattress pads |
| USD 1.24 billion (2025) | Trade Journal B | Relies on retail audits from ten economies, omitting institutional and gray-market online sales |
| USD 1.14 billion (2025) | Research Publisher C | Extends a 2022 base CAGR without adjusting for recent energy-cost inflation |
Taken together, the comparison shows why our disciplined scope, fresher inputs, and balanced top-down plus bottom-up validation give executives a dependable starting point for planning and investment decisions.


Key Questions Answered in the Report
What is the current value of the electric blankets market?
The electric blankets market size stands at USD 1.27 billion in 2026 and is on track to reach USD 1.72 billion by 2031.
Which product type holds the largest share?
Over Blankets lead with 45.10% of electric blankets market share owing to their portability and plug-and-play simplicity.
Who are the key players in Electric Blankets Market?
Newell Brands Inc., Jarden Corporation, Beurer, Homefront and Dreamland are the major companies operating in the Electric Blankets Market.
Which region will grow the fastest through 2031?
Asia-Pacific is set to expand at a 12.13% CAGR during 2026-2031 as urbanization and rising incomes spur first-time purchases.
How important are online channels to future growth?
Online platforms are expected to grow at a 13.77% CAGR during 2026-2031, buoyed by rich product information, peer reviews, and competitive pricing.
What safety standards govern product development?
Global design complies with IEC 60335-2-17, while markets such as the United States and Japan mandate additional certifications like UL 964 and PSE, respectively.
Page last updated on:


