Market Overview
| Study Period | 2020 - 2031 |
|---|---|
| Forecast Data Period | 2026 - 2031 |
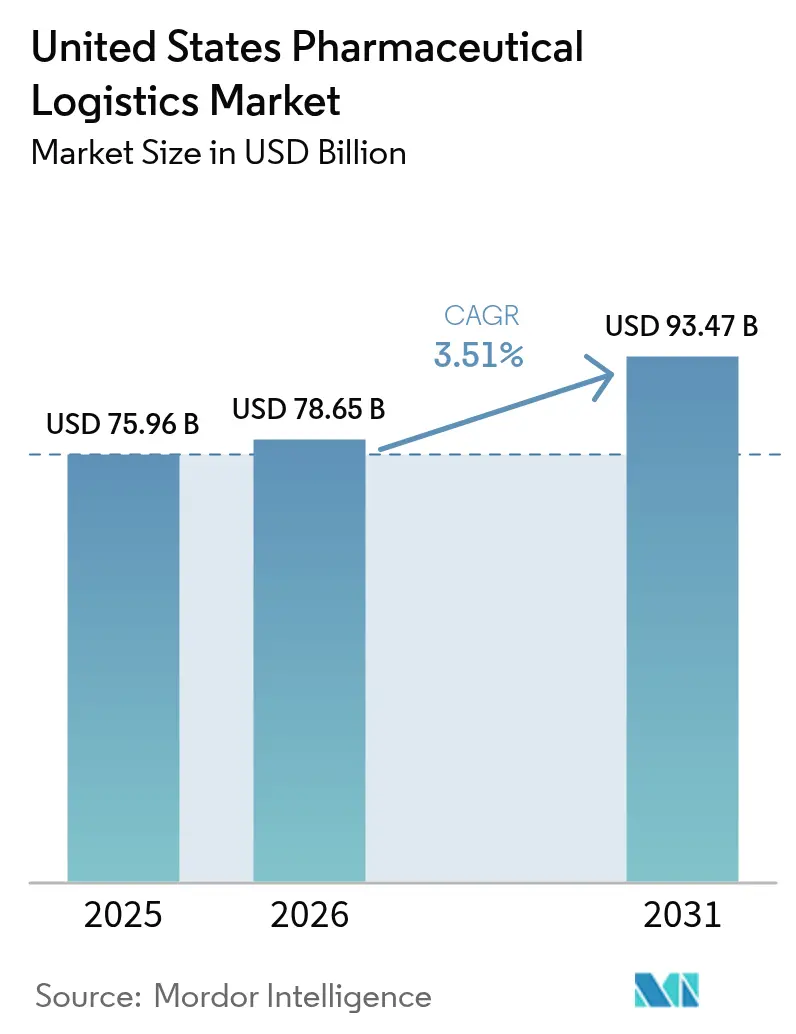
| Base Year Market Size (2025) | USD 75.96 Billion |
| Market Size (2026) | USD 78.65 Billion |
| Market Size (2031) | USD 93.47 Billion |
| Growth Rate (2026 - 2031) | 3.51% CAGR |
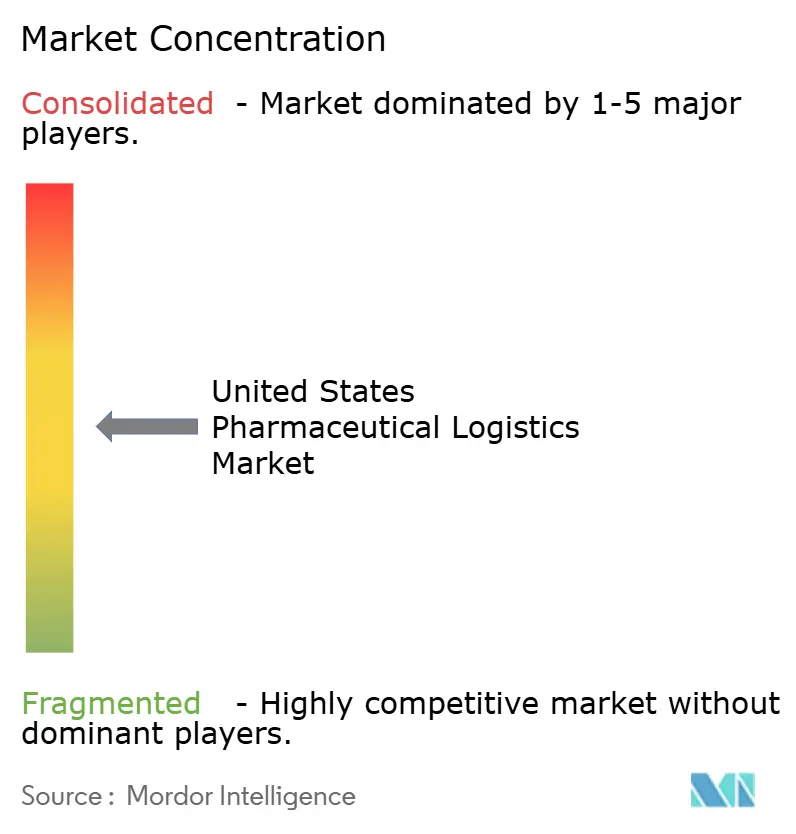
| Market Concentration | Medium |
Major Players *Disclaimer: Major Players sorted in no particular order Image © Mordor Intelligence. Reuse requires attribution under CC BY 4.0. | |
United States Pharmaceutical Logistics Market Analysis by Mordor Intelligence
The United States pharmaceutical logistics market size is expected to grow from USD 75.96 billion in 2025 to USD 78.65 billion in 2026 and is forecast to reach USD 93.47 billion by 2031 at a 3.51% CAGR over 2026-2031.
Annual mRNA booster programs, accelerated orphan-drug approvals, and the rapid rise of specialty and mail-order pharmacies are reshaping distribution into smaller, more frequent shipments that need real-time visibility and tight temperature control. Federal incentives that localize active-pharmaceutical-ingredient (API) production shift freight flows away from ocean gateways toward inland trucking corridors. At the same time, state drug-price transparency rules transform logistics data from a back-office record into a compliance asset, rewarding providers that invest in blockchain traceability and advanced IoT monitoring. Sustainability mandates add another layer of complexity as manufacturers weigh carbon targets against the need for overnight air lanes.
Key Report Takeaways
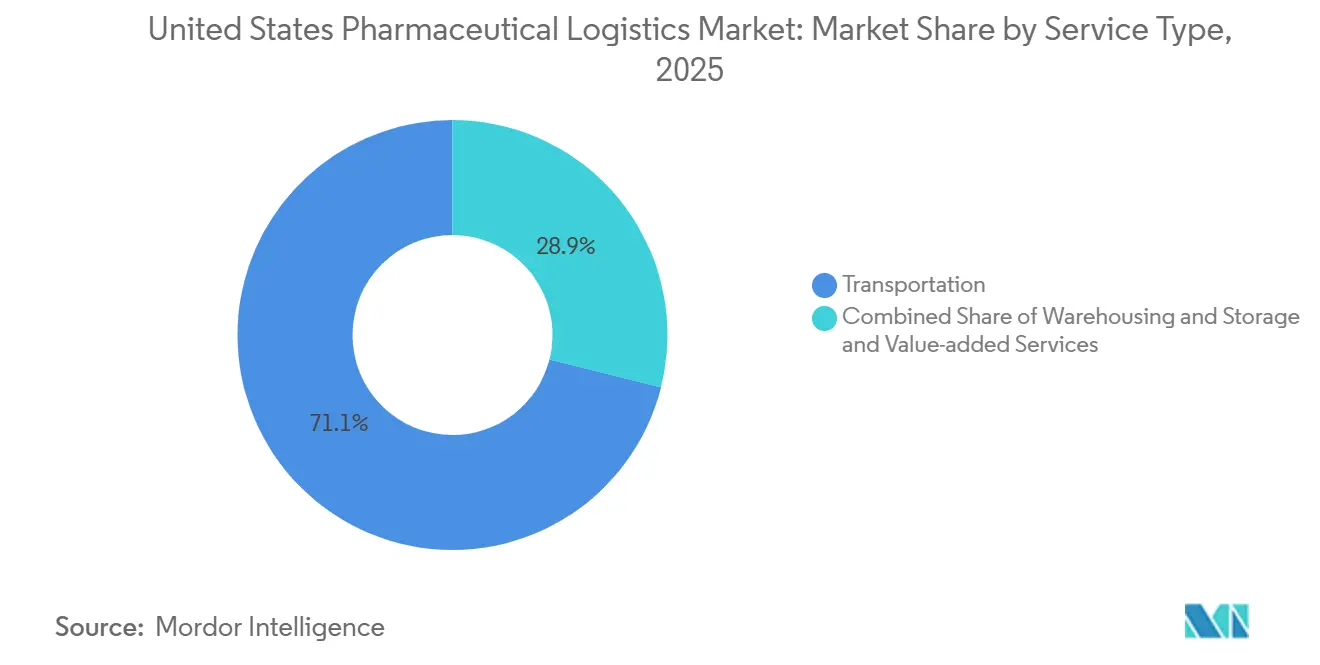
- By service type, transportation led with a 71.07% share of the United States pharmaceutical logistics market in 2025, while value-added services are projected to expand at a 5.24% CAGR through 2031.
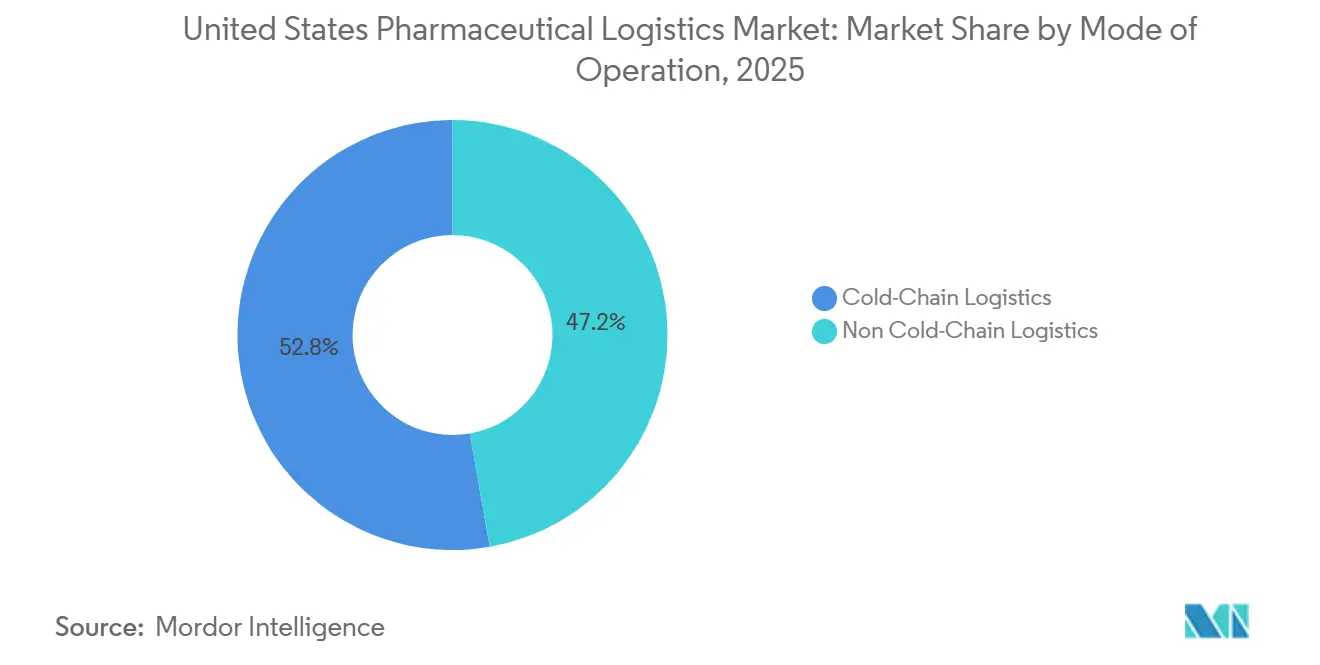
- By mode of operation, cold-chain held 52.77% of the United States pharmaceutical logistics market share in 2025, and non-cold-chain is forecast to grow at a 3.71% CAGR between 2026-2031.
- By product type, prescription drugs accounted for a 28.69% share of the United States pharmaceutical logistics market size in 2025, yet clinical trial materials is advancing at a 6.79% CAGR to 2031.
- By country, the South captured 25.2% of the United States pharmaceutical logistics market share in 2025, whereas the Midwest is the fastest-growing region at 5.7% CAGR for 2026-2031.
Note: Market size and forecast figures in this report are generated using Mordor Intelligence’s proprietary estimation framework, updated with the latest available data and insights as of 2026.
United States Pharmaceutical Logistics Market Trends and Insights
Drivers Impact Analysis*
| Driver | (~) % Impact on CAGR Forecast | Geographic Relevance | Impact Timeline |
|---|---|---|---|
| Ongoing mRNA-Vaccine Booster Programs Driving Nationwide ULT Capacity | +0.9% | National, concentration in Northeast and West Coast hubs | Medium term (2-4 years) |
| Surge of Specialty and Mail-Order Pharmacies Boosting Parcel-Level Pharma Freight | +0.8% | National, highest penetration in urban and suburban markets | Short term (≤ 2 years) |
| Record Orphan-Drug Approvals Requiring Niche Temperature-Secure Lanes | +0.7% | National, specialized distribution through limited pharmacy networks | Medium term (2-4 years) |
| Decentralized Clinical Trials Creating Micro-Fulfillment Flows | +0.6% | National, early adoption in major metropolitan areas | Long term (≥ 4 years) |
| Reshoring Incentives for API and Fill-Finish Plants Increasing Domestic Haulage | +0.5% | Southeast and Midwest manufacturing corridors | Long term (≥ 4 years) |
| State Drug-Price Transparency Laws Spurring Real-Time Logistics Data Platforms | +0.4% | State-level, early implementation in CA, CO, CT | Medium term (2-4 years) |
| Source: Mordor Intelligence | |||
Ongoing mRNA-Vaccine Booster Programs Driving Nationwide ULT Capacity
Annual COVID-19 booster recommendations extend ultra-low-temperature (ULT) infrastructure from a pandemic response to a standing requirement. The Centers for Disease Control and Prevention advises yearly vaccination for everyone aged six months and older. Only 15% of United States pharmacies had freezers capable of -70 °C storage prior to 2020, so carriers now invest in dry-ice replenishment, redundant power, and trained crews to avoid excursions. Permanent ULT lanes lower marginal costs for emerging mRNA oncology and rare-disease therapies, encouraging manufacturers to collocate production with certified logistics hubs. Providers that secure guaranteed capacity at -70 °C enjoy pricing power and higher asset utilization, raising barriers for late entrants. The shift from surge shipments to predictable seasonal volumes also enables network planners to reposition containers and reduce empty miles.
Surge of Specialty and Mail-Order Pharmacies Boosting Parcel-Level Pharma Freight
Mail-order prescriptions reached 42% market share in 2024. CVS Caremark alone processes millions of patient-specific parcels every month through automated fulfillment centers. Instead of pallet shipments to wholesalers, manufacturers now tender small, high-value cartons that ride express networks with hour-by-hour monitoring. Specialty drugs represent 2% of prescriptions but half of spending; their temperature sensitivity and limited dispensing networks command premium freight rates. Reverse logistics for unused injectables and data loggers create backhaul opportunities yet add regulatory paperwork. Express carriers differentiate through late pickup windows, in-transit interventions, and integrated reimbursement data that satisfy payer audits[1].U.S. Food and Drug Administration, “Orphan-Drug Designations and Approvals,” fda.gov
Record Orphan-Drug Approvals Requiring Niche Temperature-Secure Lanes
The Food and Drug Administration cleared 42 orphan therapeutics in 2024, extending a multiyear streak that now tops 200 cumulative approvals. Small, geographically dispersed patient pools demand shipment integrity over volume efficiency. Many therapies ship under Risk Evaluation and Mitigation Strategy programs that limit dispensing to certified sites, so lanes operate at low frequency yet demand redundant monitoring. Cell and gene products add chain-of-identity requirements, compelling logistics partners to blend blockchain audit trails with real-time GPS. Because average revenue per kilogram is high, providers can justify dedicated equipment and white-glove handling, but inconsistent volumes make cost recovery dependent on multi-client pooling.
Decentralized Clinical Trials Creating Micro-Fulfillment Flows
Eighty-five percent of 2024 United States studies used at least one decentralized element. Sponsors now ship investigational kits directly to homes, bypassing investigator sites. That swap multiplies delivery points and compresses transit windows, pushing 3PLs to blend courier networks with patient-scheduling apps and temperature-controlled packaging sized for single doses. Food and Drug Administration guidance on decentralized trials elevates documentation standards, so each hand-off triggers a timestamp and signer record. Margins improve because per-unit freight pricing exceeds bulk rates, yet providers carry higher liability for failed visits or temperature excursions. Long term, platform providers that combine logistics, telehealth, and data capture are positioned to win bundled contracts.
Restraints Impact Analysis*
| Restraint | (~) % Impact on CAGR Forecast | Geographic Relevance | Impact Timeline |
|---|---|---|---|
| Truck-Driver Shortages and HOS Limits Constraining Time-Critical Road Capacity | -0.7% | National, acute in rural and secondary markets | Short term (≤ 2 years) |
| Escalating Warehouse Rents in Gateway Metros Compressing 3PL Margins | -0.5% | New York, Los Angeles, Chicago, Boston | Medium term (2-4 years) |
| New IATA Lithium-Battery Rules Limiting Use of IoT Data-Loggers in Airfreight | -0.3% | International routes and domestic air cargo | Short term (≤ 2 years) |
| Scope-3 Carbon Accounting Discouraging High-Emission Overnight Air Lanes | -0.4% | National, especially firms with public climate commitments | Long term (≥ 4 years) |
| Source: Mordor Intelligence | |||
Truck-Driver Shortages and HOS Limits Constraining Time-Critical Road Capacity
The American Trucking Associations estimated a 78,000-driver shortfall in 2024 and warns of deficits exceeding 160,000 by 2031. Pharmaceutical lanes need hazmat certificates, temperature-controlled experience, and security clearances, shrinking the eligible pool even further. Hours-of-Service rules cap single-driver reach, so distributors rely on team driving or relay models that inflate costs. Wage offers rose 8-10% in 2025 but failed to offset retirements, leaving rural hospitals exposed to delayed replenishment. Some carriers pilot autonomous yard tractors and electric straight trucks, yet regulatory and infrastructure hurdles prevent near-term scale.
Escalating Warehouse Rents in Gateway Metros Compressing 3PL Margins
Industrial rents in Los Angeles, New York, and Chicago rose 15-20% year on year in 2024. GDP-certified cold rooms command even higher premiums because they require redundant HVAC, back-up generators, and controlled-access security. Smaller 3PLs absorb cost spikes or relocate to inland markets such as Columbus and Kansas City, trading proximity for savings. A number of providers pivot to automation, using shuttle systems and robotics to raise cubic utilization and offset rent through higher throughput. Others pursue build-to-suit facilities with long leases to lock in predictable occupancy costs[2].CBRE, “U.S. Industrial Outlook 2024,” cbre.com
*Our forecasts treat driver/restraint impacts as directional, not additive. The impact forecasts reflect baseline growth, mix effects, and variable interactions.
Segment Analysis
By Service Type: Value Integration Outpaces Traditional Freight
Transportation services generated 71.07% of the United States pharmaceutical logistics market revenue in 2025, reflecting the central role of road and air capacity. Value-added services, although smaller, are projected to grow at a 5.24% CAGR through 2031 as manufacturers outsource serialization, kitting, and regulatory documentation. Road freight retains leadership because trucks provide door-to-door temperature control and security, but driver shortages lengthen lead times. Air freight remains indispensable for clinical supplies, shortage mitigation, and high-value biologics. Sea freight gains limited traction for non-urgent cargo as firms chase lower emissions, while rail remains niche.
Cardinal Health’s Fort Worth automated center ships 10,000 orders daily, illustrating how robotics lifts productivity across transportation, warehousing, and value-added tasks. Warehousing & Storage demand grows moderately because reshoring drives higher domestic inventories, and direct-to-patient models need forward-deployed stock. Providers blend pick-by-light, cold tunnels, and blockchain hand-offs to cut error rates. As execution expands beyond pallets to compliance paperwork, shippers increasingly award integrated contracts, deepening the competitive moat for full-service carriers.


By Mode of Operation: Ambient Formulations Challenge Cold-Chain Dominance
Cold-chain logistics captured 52.77% share of the United States pharmaceutical logistics market size in 2025 due to biologics growth and mRNA vaccine boosters. However, Non-Cold-Chain revenues are forecast to rise at a 3.71% CAGR, supported by reformulated drugs that remain stable at room temperature. Ultra-low-temperature lanes created for COVID-19 now service cell therapies, achieving better asset turns and lower per-kilogram costs. Yet each degree of temperature control adds packaging, energy, and monitoring expense, encouraging R&D teams to pursue thermostable versions of current blockbusters.
The non-cold segment covers oral solids, devices, and OTC products, which leverage parcel networks without refrigerated trailers. Although infrastructure costs are lower, regulatory duties such as serialization and chain-of-custody still demand investment. Direct-to-patient channels rely heavily on ambient stability to avoid dry ice and coolant packs. Cold shippers counter with phase-change materials and vacuum-insulated panels that extend pack-out life, enabling more lanes to travel by ground rather than air. Providers that balance asset pools across both modes mitigate seasonality and maximize trailer utilization.
By Product Type: Trial Materials Surge Past Commercial Distribution
Prescription Drugs held 28.69% of the United States pharmaceutical logistics market size in 2025, reflecting stable chronic-therapy demand. Clinical Trial Materials, while smaller, leads growth at 6.79% CAGR because decentralized protocols push more shipments to homes. Each investigational kit travels under strict chain-of-identity rules, multiplying the number of temperature-qualified boxes a sponsor must dispatch. Biologics and biosimilars, vaccines, and blood products maintain cold-chain pressure, while emerging cell and gene therapies require -70 °C storage plus GPS escorts.
The US pharmaceutical logistics market share for medical devices and diagnostics edges higher as home testing gains traction, yet these items often ride consumer goods networks with lighter compliance. Veterinary medicines track pet adoption trends and livestock health requirements, creating a parallel cold-and-ambient mix with separate labeling rules. Manufacturers weigh inventory buffers against accelerated lead times that mail-order models demand. 3PLs that can route both investigational and commercial freight through shared hubs lower fixed costs and win long-term master service agreements.
Geography Analysis
The South accounted for 25.2% of the United States pharmaceutical logistics market revenue in 2025, supported by large production campuses and parcel hubs in Texas, Georgia, and Tennessee. Eli Lilly, Pfizer, and Catalent expansions reinforce south-bound freight and attract cold-chain warehousing clusters. Labor costs and land availability remain favorable versus coastal metros, and airports in Memphis and Louisville offer integrated express uplifts.
The Midwest posts the fastest growth at 5.7% CAGR to 2031, propelled by central highway access that puts 80% of the U.S. population within a two-day drive. Columbus, Indianapolis, and Kansas City host new GDP-certified mega centers that blend automation with renewable-energy microgrids. Reshoring of APIs and fill-finish suites boosts inbound raw materials and outbound finished-dose traffic, shifting volume from ports to domestic lanes[3].Fierce Pharma, “Eli Lilly Commits USD 5.3 Billion to Indiana Manufacturing Expansion,” fiercepharma.com
The Northeast and West maintain R&D intensity and biotech clusters but confront congestion, high rents, and limited land for greenfield cold rooms. Boston and San Diego 3PLs focus on niche gene-therapy moves and early-stage clinical supplies. West Coast ocean ports process temperature-controlled imports from Asia, yet some lanes re-route through Gulf gateways to cut chassis dwell. Providers in both coastal regions differentiate through regulatory expertise and white-glove add-ons rather than volume scale. Overall, inland migration moderates real-estate inflation and reallocates capital toward automation instead of rent premiums.
Competitive Landscape
Competition hinges on specialized capability, compliance track record, and end-to-end integration rather than pure freight rates. UPS, DHL, and FedEx spent more than USD 5 billion combined on health-care logistics since 2024, building GDP-certified hubs, dry-ice plants, and IoT command centers. UPS deepened its temperature-controlled reach by acquiring Andlauer Healthcare Group for USD 1.6 billion. DHL earmarked EUR 2 billion (USD 2.35 billion) for life-science expansion, including United States multi-client pharma campuses[4]United Parcel Service, “UPS to Acquire Andlauer Healthcare Group,” ups.com .
Traditional wholesalers Cencora, McKesson, and Cardinal Health defend positions by layering analytics, specialty care services, and at-home solutions on top of nationwide distribution. McKesson’s USD 850 million purchase of PRISM Vision accelerates ophthalmology penetration while adding data assets for real-world evidence. Cardinal Health integrates 74 robots in Fort Worth to cut cycle time and labor exposure. GXO and other pure-play 3PLs win multi-year contracts by showcasing automation density and risk-sharing pricing tied to service-level adherence.
Niche providers carve profitable pockets in cell-therapy escort moves, ultra-low-temperature dry-shipper management, and direct-to-patient scheduling. Technology startups supply blockchain ledgers, temperature-as-a-service devices, and carbon-footprint dashboards that incumbents integrate via partnership or bolt-on acquisition. Consolidation is likely as express giants seek last-mile cold lockers and compliance talent, while wholesalers scout digital health platforms to defend specialty volumes.
United States Pharmaceutical Logistics Industry Leaders
FedEx
UPS
Cencora
McKesson
Cardinal Health
- *Disclaimer: Major Players sorted in no particular order

Recent Industry Developments
- November 2025: United Parcel Service completed its acquisition of Andlauer Healthcare Group (AHG) for about USD 1.6 billion, significantly enhancing its cold chain and pharmaceutical logistics capabilities across North America and globally.
- October 2025: FedEx expanded its healthcare logistics footprint, adding specialized healthcare logistics services (e.g., temperature-controlled solutions, advanced tracking, value-added fulfillment) and investing in life science centers globally, including in the United States, aimed at biologics, vaccines, and clinical samples.
- September 2025: DHL Supply Chain & Global Forwarding agreed to acquire SDS Rx, a United States provider of finalmile healthcare delivery services, enhancing its healthcare and pharmaceutical logistics network.
- March 2025: DHL acquired CryoPDP, a United States pharmaceutical logistics firm focused on clinical trial and biopharma shipments, as part of its strategy to grow life sciences logistics.


United States Pharmaceutical Logistics Market Report Scope
By Service Type
| Transportation | Road Freight |
| Air Freight | |
| Sea Freight | |
| Rail Freight | |
| Warehousing and Storage | |
| Value-added Services and Others |
By Mode of Operation
| Cold-Chain Logistics |
| Non-Cold-Chain Logistics |
By Product Type
| Prescription Drugs |
| OTC Drugs |
| Biologics and Biosimilars |
| Vaccines and Blood Products |
| Clinical Trail Materials |
| Cell and Gene Therapies |
| Medical Devices and Diagnostics |
| Veterinary Medicine |
| Others |
By Region (United States)
| Northeast |
| Midwest |
| South |
| West |
| By Service Type | Transportation | Road Freight |
| Air Freight | ||
| Sea Freight | ||
| Rail Freight | ||
| Warehousing and Storage | ||
| Value-added Services and Others | ||
| By Mode of Operation | Cold-Chain Logistics | |
| Non-Cold-Chain Logistics | ||
| By Product Type | Prescription Drugs | |
| OTC Drugs | ||
| Biologics and Biosimilars | ||
| Vaccines and Blood Products | ||
| Clinical Trail Materials | ||
| Cell and Gene Therapies | ||
| Medical Devices and Diagnostics | ||
| Veterinary Medicine | ||
| Others | ||
| By Region (United States) | Northeast | |
| Midwest | ||
| South | ||
| West |


Key Questions Answered in the Report
How large will the United States pharmaceutical logistics market be by 2031?
It is forecast to reach USD 93.47 billion by 2031, expanding at a 3.51% CAGR from 2026.
Which service segment is growing the fastest?
Value-Added Services is projected to register the quickest pace at 5.24% CAGR for 2026-2031 as shippers outsource serialization and regulatory tasks.
Why is the Midwest growing faster than other regions?
Central highway access, lower real-estate costs, and new API manufacturing plants drive a 5.7% CAGR for Midwestern logistics revenues.
What is driving demand for ultra-low-temperature capacity?
Recurring mRNA vaccine boosters and emerging cell and gene therapies require –70 °C lanes, leading carriers to invest in ULT freezers and monitoring.
How are sustainability goals affecting transport choices?
Scope-3 carbon accounting pushes manufacturers to favor ground or ocean modes when medical timelines allow, discouraging routine overnight air shipments.
What technological trend is reducing spoilage costs?
AI-driven control-towers that integrate real-time sensor data and predictive analytics reroute at-risk shipments before temperature excursions, lowering annual spoilage valued at USD 48 billion.
Page last updated on:


