
Market Overview
| Study Period | 2020 - 2031 |
|---|---|
| Forecast Data Period | 2026 - 2031 |
| Historical Data Period | 2020 - 2024 |
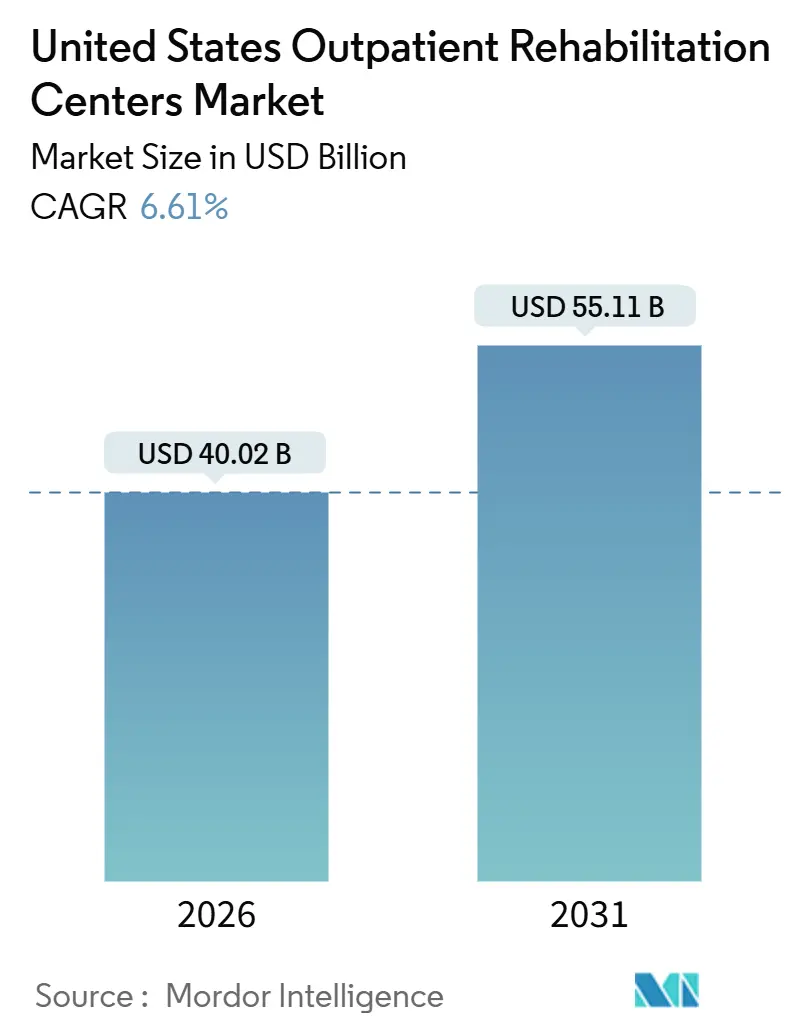
| Market Size (2026) | USD 40.02 Billion |
| Market Size (2031) | USD 55.11 Billion |
| Growth Rate (2026 - 2031) | 6.61 % |
| Market Concentration | Low |
Major Players *Disclaimer: Major Players sorted in no particular order Image © Mordor Intelligence. Reuse requires attribution under CC BY 4.0. | |
United States Outpatient Rehabilitation Centers Market Analysis by Mordor Intelligence
The United States Outpatient Rehabilitation Centers Market size is estimated at USD 40.02 billion in 2026, and is expected to reach USD 55.11 billion by 2031, at a CAGR of 6.61% during the forecast period (2026-2031).
Extensions of hospital-at-home waivers, surging Medicare Advantage enrollment, and employer-sponsored onsite clinics are steering patient volumes away from inpatient facilities and toward community-based therapy. Physical therapy dominates the revenue mix, yet tele-rehab platforms that blend in-person and virtual visits are posting double-digit growth as sensor-based motion tracking lifts adherence and expands therapist panel capacity. Musculoskeletal disorders remain the largest caseload driver, but neurological rehabilitation is the fastest-expanding condition segment as longer survival after stroke and Parkinson’s disease lengthens therapy timelines. Reimbursement headwinds from consecutive CMS fee-schedule cuts are pressuring independent operators, spurring consolidation and accelerating technology adoption that lowers per-episode costs. Workforce shortages and uneven clinic density - especially in rural Sun Belt and Midwest counties - continue to shape expansion strategies and capital allocation in the United States outpatient rehabilitation centers market.
Key Report Takeaways
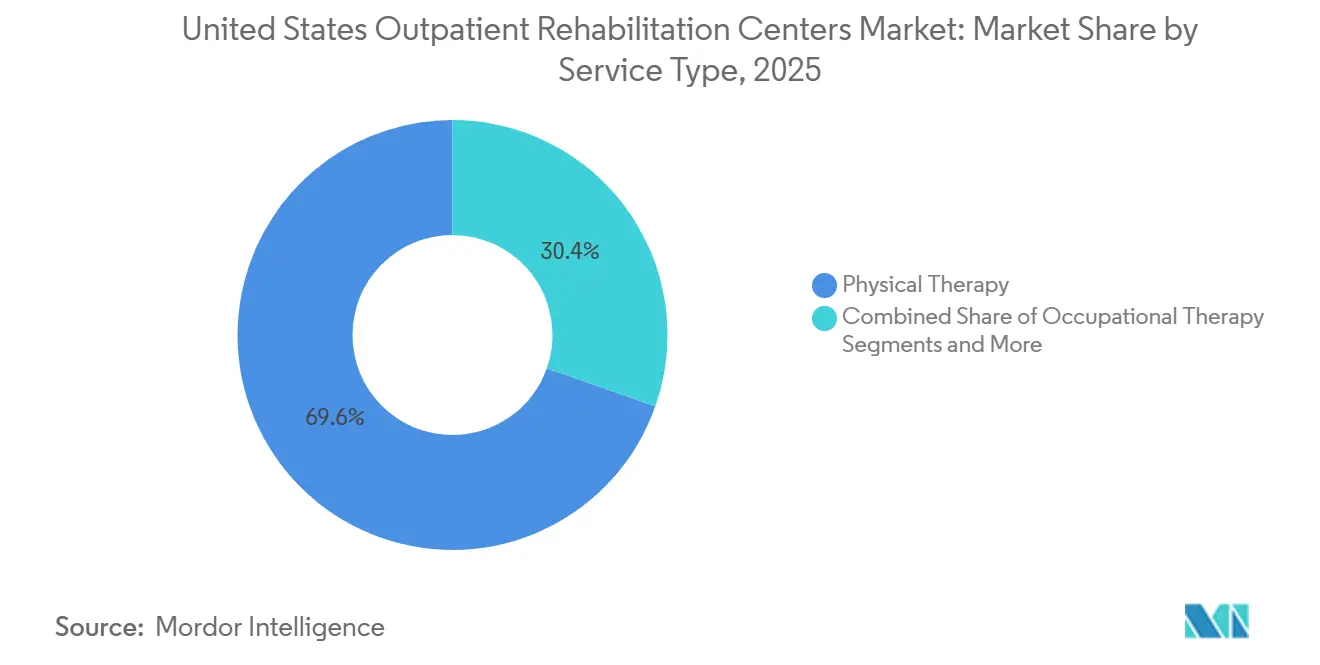
- By service type, physical therapy captured 69.62% of revenue in 2025, while tele-rehab physical therapy is on track for a 10.52% CAGR to 2031.
- By rehabilitation condition, musculoskeletal disorders commanded 58.56% of 2025 case volume; neurological rehabilitation is projected to expand at 9.24% through 2031.
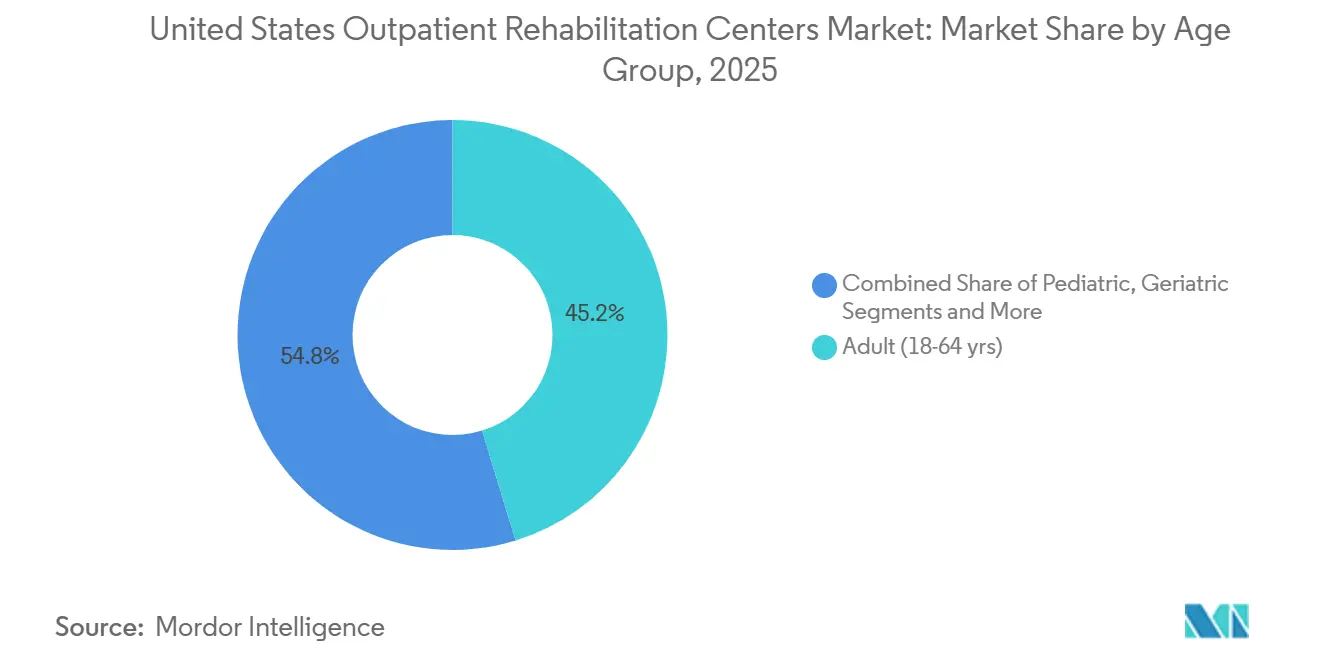
- By age group, geriatric visits are forecast to grow at an 8.32% CAGR, outpacing the adult segment that still represented 45.24% of visits in 2025.
- By payer type, private insurance held 39.22% of the United States outpatient rehabilitation centers market share in 2025; Medicare Advantage is the fastest-growing channel at 8.73% CAGR.
Note: Market size and forecast figures in this report are generated using Mordor Intelligence’s proprietary estimation framework, updated with the latest available data and insights as of January 2026.
Market Trends and Insights
Drivers Impact Analysis of United States Outpatient Rehabilitation Centers Market*
| Driver | (~) % Impact on CAGR Forecast | Geographic Relevance | Impact Timeline |
|---|---|---|---|
| Aging population & chronic musculoskeletal burden | +1.8% | Florida, Arizona, Texas | Long term (≥ 4 years) |
| Shift to value-based outpatient care models | +1.2% | California, New York, Pennsylvania | Medium term (2–4 years) |
| Rising sports injuries & active-lifestyle demand | +0.9% | Colorado, Oregon, Washington, North Carolina | Short term (≤ 2 years) |
| Hospital-at-home codes enabling hybrid rehab | +0.7% | New York, Massachusetts, Illinois | Medium term (2–4 years) |
| Employer-sponsored onsite rehab clinics | +0.5% | Texas, California, Georgia | Medium term (2–4 years) |
| AI-driven motion tracking boosts adherence | +0.6% | California, Washington, Massachusetts | Short term (≤ 2 years) |
| Source: Mordor Intelligence | |||
Aging Population & Chronic Musculoskeletal Burden
The 65-plus cohort climbed 3.1% to 61.2 million in 2024 and is projected to reach 78 million by 2040, a shift that dovetails with higher arthritis, chronic back pain, and fall-related injuries.[1] Arthritis affects 53.2 million adults, chronic back pain is reported by 39% of adults, and falls result in 3 million emergency visits annually, prompting Medicare to reimburse evidence-based fall-prevention therapy that saves USD 3 in acute-care costs for every rehabilitation dollar spent.[2] Sun Belt states show the steepest senior growth yet remain below median clinic density, stretching wait times beyond three weeks in suburban Phoenix and Tampa. As the geriatric population accumulates multiple chronic conditions, the United States outpatient rehabilitation centers market increasingly relies on multi-modal programs that target strength, balance, and pain management within one care plan.
Shift to Value-Based Outpatient Care Models
Medicare Advantage enrollment hit 33.8 million in 2024, or 54% of eligible beneficiaries, and many plans now pay for additional physical therapy visits beyond fee-for-service limits.[3] Bundled payment models covering joint replacement and cardiac episodes delivered 18% more outpatient therapy visits in the first 90 days post-discharge than fee-for-service cohorts, rewarding clinics that can share real-time outcomes data with accountable care organizations. Providers adept at risk-sharing are securing preferred-network status, especially in California, New York, and Pennsylvania, where value-based contracts tie up to 15% of revenue to quality metrics such as functional-outcome scores and 90-day readmission rates. The United States outpatient rehabilitation centers market thus favors operators with interoperable EHRs and analytics that quantify therapy’s economic returns.
AI-Driven Motion Tracking Boosts Adherence
FDA-cleared digital therapeutics that employ smartphone cameras or wearable sensors now guide home exercises, logging repetitions and flagging risky compensations. Studies published in 2024 show patients using AI-guided platforms complete 72% of prescribed exercises, versus 48% on paper programs, resulting in superior functional-gain scores. Clinics integrating these tools expand therapist panels from 12 to 18 patients per full-time equivalent, trimming facility costs by 35% per episode while maintaining outcomes. However, only half of commercial payers reimburse remote monitoring codes as of early 2026, creating uneven adoption across the United States outpatient rehabilitation centers market.
Hospital-at-Home Codes Enabling Hybrid Rehab
CMS extended its Acute Hospital Care at Home waiver through December 2025, allowing more than 300 hospitals to deliver inpatient-level care - and accompanying rehabilitation - inside patients’ homes. Early evidence shows 30–40% lower episode costs and satisfaction scores above 90%. Urban health systems in New York, Massachusetts, and Illinois have already captured up to 12 percentage points of post-surgical rehab share in active ZIP codes, compelling freestanding centers to form joint ventures that maintain continuity when patients transition from acute home care to community-based therapy.
Restraints Impact Analysis of United States Outpatient Rehabilitation Centers Market*
| Restraint | (~) % Impact on CAGR Forecast | Geographic Relevance | Impact Timeline |
|---|---|---|---|
| CMS fee-schedule reimbursement cuts | -0.8% | National, rural emphasis | Short term (≤ 2 years) |
| Licensed therapist workforce shortage | -0.6% | Rural Midwest, Appalachia, non-metro South | Long term (≥ 4 years) |
| Rising urban clinic real-estate costs | -0.3% | New York, San Francisco, Boston, Seattle, Los Angeles | Medium term (2–4 years) |
| Data-privacy friction for sensor monitoring | -0.2% | California and biometric-law states | Short term (≤ 2 years) |
| Source: Mordor Intelligence | |||
CMS Fee-Schedule Reimbursement Cuts
The Medicare physician fee schedule reduced payment for core evaluation and therapeutic exercise codes by 3.37% in 2024 and a further 2.83% in 2025, slicing already thin 8–12% EBITDA margins for independent clinics. Rural operators, unable to leverage large commercial payer contracts, face disproportionate pressure and are either consolidating or exiting the United States outpatient rehabilitation centers market. National chains are downsizing footprints, shortening visit lengths, and shifting to group sessions to offset lost revenue while lobbying continues for multi-year phase-ins.
Licensed Therapist Workforce Shortage
Physical therapist employment is forecast to grow 14% from 2022 to 2032, yet only 10,200 new graduates entered the workforce in 2024, while turnover in outpatient settings tops 18%. Rural counties average fewer than 0.5 clinics per 10,000 residents, and sign-on bonuses exceed USD 15,000. Telehealth offers partial relief, but licensure reciprocity remains incomplete, with 12 states still outside the Physical Therapy Compact. Unless graduate program capacity rises or international credentialing accelerates, staffing constraints will temper clinic expansion across the United States outpatient rehabilitation centers market.
*Our forecasts treat driver/restraint impacts as directional, not additive. The impact forecasts reflect baseline growth, mix effects, and variable interactions.
United States Outpatient Rehabilitation Centers Market Segment Analysis
By Service Type:
Physical Therapy Anchors Revenue, Tele-Rehab AcceleratesPhysical therapy held 69.62% of 2025 revenue in the United States outpatient rehabilitation centers market, while tele-rehab PT is growing at 10.52% annually through 2031. Occupational therapy leverages Medicare’s expanded fall-prevention benefits, speech therapy meets rising post-stroke aphasia needs, and respiratory therapy gains traction from long-COVID cases. Hybrid care models typically start and finish in clinic but shift six to eight mid-episode visits online, cutting facility costs by 35%. Reimbursement parity is improving; Medicare pays 95% of in-person rates, but commercial discounts of up to 30% still challenge aggressive virtualization.
Continued tele-rehab adoption is supported by 2024 competency standards that make virtual-care skills mandatory for new graduates. Yet interoperability gaps and payer variability keep in-person visits dominant for occupational therapy that requires environmental assessments and for speech therapy nuances best captured face-to-face. Providers balance modality mix to sustain margins across the United States outpatient rehabilitation centers market size.

By Rehabilitation Condition:
Musculoskeletal Volume Meets Neurological GrowthMusculoskeletal disorders accounted for 58.56% of 2025 cases, reflecting 53.2 million arthritis sufferers, chronic back pain prevalence, and 120,000 ACL repairs. Neurological rehabilitation is set to grow 9.24% through 2031 as 7.6 million stroke survivors and 1 million Parkinson’s patients demand extended therapy. Cardiopulmonary programs benefit from CMS expansion to 36 covered sessions, and post-operative pathways thrive under bundled payments that reward early mobilization.
Constraint-induced movement therapy and LSVT BIG protocols require 20–40 visits, boosting revenue per episode versus routine orthopedic cases. Medicare Advantage plans accept the cost because robust neurological programs cut nursing-home placements, lowering long-term spend. Operators diversify into these higher-acuity lines to cushion CMS fee-schedule cuts, sustaining the United States outpatient rehabilitation centers market share.
By Age Group:
Geriatric Surge Reshapes DemandGeriatric visits are expanding at an 8.32% CAGR as the senior population surges, even though adults aged 18–64 still generated 45.24% of 2025 clinic volume. Pediatric cases grow modestly via early-intervention mandates but suffer from lower Medicaid reimbursement. Clinics are redesigning schedules to accommodate geriatric needs—longer evaluations, caregiver coordination—and extending evening hours for working adults.
Preventive fall-prevention programs now reimbursed by Medicare lower acute admissions, aligning with capitated Advantage incentives. Meanwhile, minimally invasive procedures shorten adult rehab timelines and remote work reduces workplace injuries, tempering growth in the younger cohort within the United States outpatient rehabilitation centers market.
By Payer Type:
Medicare Advantage Gains SharePrivate insurance delivered 39.22% of 2025 revenue, yet Medicare Advantage is the fastest-rising payer at 8.73% CAGR as enrollment climbs past half of all beneficiaries. Advantage plans reward clinics capable of real-time outcome reporting and accept lower per-visit rates in exchange for steady volume. Traditional Medicare lags due to beneficiary migration and fee-schedule cuts, while Medicaid continues to reimburse at 60–70% of Medicare, leading many providers to cap volume.
Workers’ compensation declines with safer workplaces, and self-pay remains niche amid USD 75–150 visit costs. Risk-based contracts and supplemental benefits position Medicare Advantage as the pivotal growth engine for the United States outpatient rehabilitation centers market size over the forecast.
Geography Analysis
Regional disparities influence expansion. Sun Belt states show the fastest senior growth yet sub-median clinic density, prompting de novo builds in Phoenix, Tampa, and Austin. California, New York, and Pennsylvania lead Medicare Advantage penetration, enabling value-based networks that capture referrals. Rural Midwest and Appalachian counties wrestle with therapist shortages, where sign-on incentives are highest.
Urban coastal hubs face medical office rents topping USD 55 per square foot, compelling footprint downsizing or relocations to secondary submarkets. Hospital-at-home programs thrive in these same metros, diverting post-operative cases from freestanding centers unless joint ventures secure downstream therapy. Tele-rehab scalability is limited in 12 non-compact states, further segmenting the United States outpatient rehabilitation centers market geographically.
Regulatory Landscape
Outpatient rehabilitation reimbursement and compliance are anchored by the Centers for Medicare and Medicaid Services (CMS) through the Medicare Physician Fee Schedule (MPFS) rules for therapy services and the Conditions of Participation for Comprehensive Outpatient Rehabilitation Facilities (CORFs) under 42 CFR 485.50-74. For calendar year 2026, Medicare retained the KX modifier medical-necessity threshold at USD 2,480 for combined physical therapy and speech-language pathology services and USD 2,480 for occupational therapy, making documentation discipline a core operational requirement for centers managing higher-acuity and longer-duration cases.
CMS billing rules also shape staffing and digital-care delivery. Services furnished by physical therapist assistants (PTAs) and occupational therapy assistants (OTAs) continue to receive a 15% payment reduction through the CQ and CO modifiers, influencing visit mix and supervision models. From January 1, 2026, new Remote Therapeutic Monitoring (RTM) treatment management codes were designated as sometimes therapy services, and CMS finalized technical corrections to CY 2026 OPPS payment policies effective February 23, 2026, increasing the importance of accurate coding, modifier use, and compliant remote-monitoring workflows.
Value Chain Analysis
Demand is generated through referrals and authorization pathways from orthopedic and neurology practices, health systems, ambulatory surgery centers, Medicare Advantage plans, employers, and hospital-at-home programs, then converted into episodes of care delivered by outpatient clinics and CORFs under physician-led plans of treatment. Core delivery inputs include licensed clinicians (PT/OT/SLP), scheduling and EHR infrastructure, outcomes measurement, and a growing layer of tele-rehab and remote monitoring software that supports hybrid visit models.
On the supply side, rehabilitation centers source consumables and therapy equipment (mobility aids and personalized therapy tools), alongside higher-ticket technology such as wearable sensors and, in some cases, rehabilitation robotics. Procurement is often aggregated through group purchasing organizations and shared service models to reduce unit costs and standardize vendor performance, while bottlenecks tend to form around specialized DME availability, last-mile delivery for critical devices, and platform reliability for remote monitoring. CORF-specific compliance requirements under 42 CFR Part 485 reinforce the role of standardized clinical protocols, documentation, and vendor-supported training as the episode moves from evaluation through supervised in-clinic sessions and monitored home exercise adherence.
Competitive Landscape
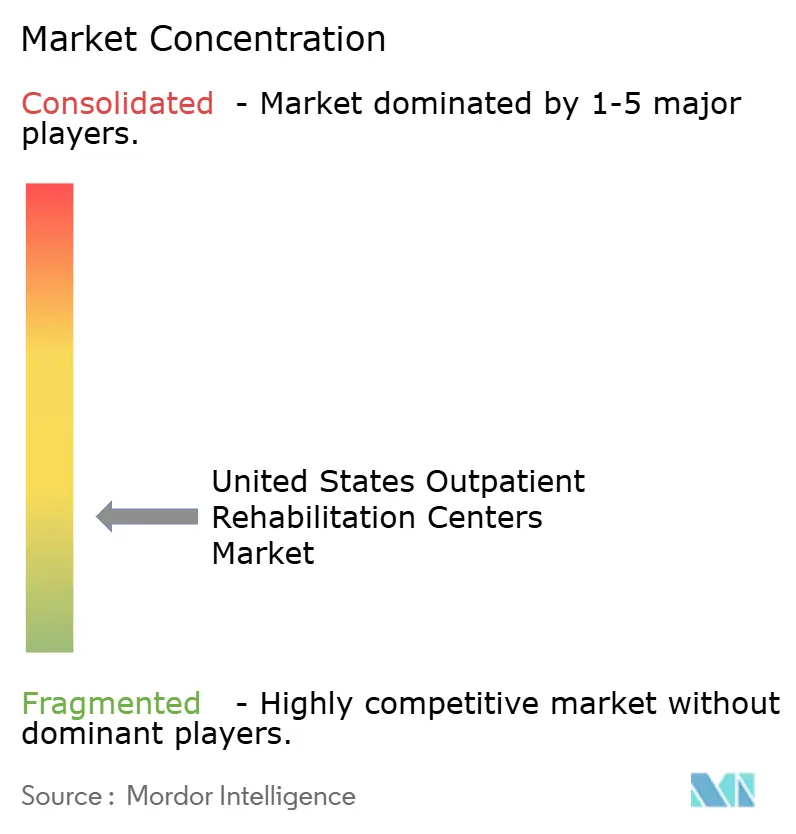
The five largest providers include Encompass Health, Select Medical, U.S. Physical Therapy, ATI Physical Therapy, and Athletico, underscoring fragmentation. Private-equity roll-ups and public chains are executing de novo builds in growth corridors and acquiring single-site clinics to aggregate share. Competitive edge now rests on technology integration, outcomes-based contracting, and payer diversification.
Chains deploying AI motion tracking expand therapist capacity while cutting costs, positioning themselves for Medicare Advantage preferred-network status. Rural markets offer whitespace but require creative staffing models, whereas urban systems leverage hospital-at-home programs to internalize rehab revenue. Select Medical grew its outpatient footprint 6.2% in 2024, focusing on Advantage-dense metros and orthopedic ASC partnerships that funnel high-margin post-surgical cases. Consolidation and technology-enabled efficiency will define strategy across the United States outpatient rehabilitation centers market.
United States Outpatient Rehabilitation Centers Industry Leaders
-
Select Medical Corporation
-
Encompass Health Corp.
-
U.S. Physical Therapy Inc.
-
ATI Physical Therapy
-
Kindred Rehabilitation
- *Disclaimer: Major Players sorted in no particular order
United States Outpatient Rehabilitation Centers Market Companies Covered in this Report
- AdventHealth Outpatient Rehab
- Athletico Physical Therapy
- ATI Physical Therapy
- Baylor Scott & White Rehab
- BenchMark PT (Upstream)
- Concentra
- CORA Health Services
- Encompass Health
- HCA Healthcare Outpatient Services
- Kindred Rehabilitation
- Mayo Clinic Outpatient Rehab
- Mercy Health Outpatient Rehab
- NovaCare Rehabilitation
- OrthoCarolina Rehab
- Pivot Physical Therapy
- PT Solutions
- Sanford Health Rehab
- Select Medical
- Shirley Ryan AbilityLab
- U.S. Physical Therapy Inc.
Read Analysis of United States Outpatient Rehabilitation Centers Companies
Market Opportunities and Future Outlook
Hybrid therapy delivery has a clear reimbursement runway under Medicare, expanding addressable use cases for tele-rehab and sensor-enabled monitoring within outpatient episodes. CMS actions effective January 1, 2026 created additional pathways to bill remote therapeutic monitoring treatment management codes as sometimes therapy services, supporting platforms that capture adherence, repetitions, and functional progress outside the clinic.
The Consolidated Appropriations Act 2026 (Section 6209) extended PT, OT, and SLP telehealth authorities, including telephone assessment and management services, through December 31, 2027, reducing policy-expiration risk for operators building multi-site virtual care teams and centralized scheduling. Network contracting and service-line depth are practical whitespace areas as payer mix shifts toward Medicare Advantage and value-based referral models that tie revenue to measurable outcomes. Operators that can integrate RTM data into outcomes reporting and manage KX threshold documentation (USD 2,480 for CY 2026) have a practical edge in longer-duration neurological and geriatric care plans. Additional opportunities also show up in outpatient cardiopulmonary programs, where CMS enabled virtual direct supervision for cardiac and pulmonary rehabilitation beginning in 2026, supporting more flexible staffing models and partnerships between outpatient therapy providers and physician or hospital outpatient departments.
Recent Industry Developments in United States Outpatient Rehabilitation Centers Market
- July 2026: In July 2026, U.S. Physical Therapy acquired a 67% equity interest in a twelve-clinic physical therapy practice, expanding operations into a 45th state. The deal strengthens the company's nationwide footprint and supports multi-market coverage for payers and employer clients.
- June 2026: In June 2026, Encompass Health opened the 40-bed Eastside Rehabilitation Hospital in Loganville, Georgia, in partnership with Piedmont. The added capacity supports post-acute rehabilitation throughput and expands the downstream referral base that can spill into outpatient therapy pathways in the surrounding market.
- May 2026: In May 2026, Select Medical and Carilion Clinic formed a joint venture to build and operate a new 50-bed inpatient rehabilitation hospital in Roanoke, Virginia, with construction beginning in spring 2026. This extends health-system aligned rehabilitation infrastructure, reinforcing integrated care networks that can redirect patient flows and contracting leverage across adjacent outpatient rehabilitation services.
United States Outpatient Rehabilitation Centers Market Report Scope and Research Methodology
Market Definition and Coverage
This market covers outpatient rehabilitation services delivered in the United States where patients receive structured therapy without an inpatient stay. It includes clinical evaluation, treatment planning, and therapy sessions provided through licensed rehab centers and hospital outpatient departments.
Scope exclusions: We exclude inpatient-only rehabilitation stays, home-health visits delivered in the patient home, and non-clinical wellness or fitness coaching that is not billed as outpatient rehab care.
Segments Covered in This Report
- By Service Type
- Physical Therapy
- Occupational Therapy
- Speech & Language Therapy
- Respiratory Therapy
- By Rehabilitation Condition
- Musculoskeletal Disorders
- Neurological Disorders
- Cardiopulmonary Conditions
- Post-Operative Recovery
- Sports & Orthopedic Injuries
- By Age Group
- Pediatric (0-17 yrs)
- Adult (18-64 yrs)
- Geriatric (65+ yrs)
- By Payer Type
- Private Insurance
- Medicare
- Medicaid
- Workers’ Compensation
- Self-Pay / Out-of-Pocket
Data Sources, Market Sizing, and Validation
Desk Research
Desk research started with a simple question, how much outpatient rehabilitation is being delivered and paid for in the United States, and which demand and utilization factors move that total up or down. We anchored demand and utilization signals using public sources such as CDC injury and chronic-condition statistics, AHRQ healthcare utilization indicators, and the US Census Bureau age and population series. For payer and reimbursement mechanics, we relied on CMS sources such as Medicare coverage guidance and physician fee schedule references, since they help indicate how therapy visits are coded, paid, and updated year to year.
To keep the supply-side picture realistic, we also reviewed Bureau of Labor Statistics data on therapist employment and wages, along with state health department and licensure board portals where facility and provider rules are described. Company filings, investor presentations, credible association websites, and reputable press were used to understand clinic expansion, staffing constraints, and setting shifts between hospital outpatient departments and freestanding clinics. Paid subscription databases for company financials and for news and financials were used selectively to validate revenue ranges and event timelines, and then any outliers were re-checked. The sources listed here are illustrative and not exhaustive, since many other documents were reviewed for data collection, validation, and clarification.
Primary Interviews and Surveys
Primary research was used to validate what desk sources do not fully explain, especially visit intensity by therapy type, payer mix shifts, and real pricing realization after denials and authorizations. We spoke with clinic owners and administrators, hospital outpatient leaders, therapy directors, and billing and revenue-cycle specialists across the US, then we checked referral-side views to confirm how patient flow is changing.
Distribution of primary research fieldwork respondents
| Company type | Respondent position |
|---|---|
| Top tier: 30% | CXOs: 14% |
| Mid tier: 56% | Functional/Unit leaders: 39% |
| Smaller Players: 14% | Managers: 47% |
Market-Sizing & Forecasting
Our sizing logic starts with a top-down build where national outpatient rehab spend is reconstructed through payer coverage rules, therapy visit patterns, and the addressable treated pool that typically reaches outpatient settings after a referral. We then test that total using selective bottom-up approximations, such as sampled clinic revenue per visit, therapist productivity, and typical reimbursement rates by payer, which helps adjust for over-counting and gaps.
Inputs that materially influence the model include the share of musculoskeletal and post-operative recovery cases routed to outpatient care, therapist headcount and average caseload, payer mix across Medicare, Medicaid, private insurance, workers compensation, and self-pay, average reimbursed amount per visit by therapy type, and denial or authorization friction that changes realized volumes. Where local variation is strong, such as rural access and staffing availability, we handle gaps through range checks and then normalize back to observed utilization signals from interviews.
For forecasting, we use scenario analysis because reimbursement policy, staffing supply, and referral behavior can shift faster than long-term historical trends. The base case is informed by what practitioners expect for visit growth, pricing updates, and mix changes, then stress-tested with faster and slower volume paths to keep the outlook practical for planning.
Data Validation & Update Cycle
Validation happens in layers so unusual results get caught early, and then checked again before sign-off. We compare the market totals against independent signals, including therapist employment trends, clinic count direction, and payer policy updates that would logically move visit volumes or reimbursement. If a segment grows too quickly or falls out of pattern, we re-check assumptions and, where needed, re-contact relevant experts to confirm what changed.
Before publication, outputs are reviewed by another analyst for logic consistency across years and across key demand drivers. Reports are refreshed annually, with interim updates made when material events occur, such as major policy changes, sharp reimbursement shifts, or large-scale consolidation. Right before delivery, the latest public updates are reviewed so clients receive the most current view.
Mordor Intelligence's United States Outpatient Rehabilitation Centers Market Size Versus Other Published Estimates
Published market sizes for outpatient rehab in the US can look far apart because the scope line is not always drawn the same way, and because pricing and volume assumptions vary by payer. Differences also show up when some estimates lean heavily on provider counts, while others rely on broader healthcare spend totals without fully separating care settings.
By tracking payer-specific visit intensity and refreshing outpatient-only scope filters, Mordor Intelligence keeps the total focused on services delivered in outpatient rehabilitation centers and hospital outpatient departments, instead of mixing in inpatient rehab revenue or home-health therapy. The biggest gaps in third-party numbers usually come from whether inpatient rehabilitation facilities are included, whether behavioral or addiction treatment revenue is treated as rehab center revenue, and how Medicare versus commercial reimbursement updates are applied in the base year.
Benchmark comparison
| Source | Market Size | Gaps in Research Methodology |
|---|---|---|
| Mordor Intelligence | USD 40.02 B (2026) | |
| Industry Database A | USD 10.10 B (2025) | This estimate aligns to a narrower physical therapy clinic revenue pool in a single year, and it can exclude occupational and speech therapy revenue along with some hospital outpatient department activity. |
| Industry Database B | USD 49.90 B (2024) | This number reflects a broader therapy and rehabilitation center definition that can combine inpatient and outpatient revenues, which lifts the total when compared with an outpatient-only scope. |
Taken together, the spread is mainly explained by what settings and therapy services are counted, followed by differences in payer mix and how reimbursement changes are rolled forward. Our method stays traceable because each year is tied to clear demand and pricing drivers, and then checked against staffing capacity and billing realities, which makes the final number easier to repeat and explain.
Key Questions Answered in the Report
How fast is the United States outpatient rehabilitation centers market expected to grow?
The market is forecast to expand at a 6.61% CAGR, rising from USD 40.02 billion in 2026 to USD 55.11 billion by 2031.
Which service category leads revenue?
Physical therapy accounts for 69.62% of 2025 revenue, sustained by musculoskeletal and post-operative demand.
Why is Medicare Advantage pivotal for outpatient rehab providers?
Advantage plans are growing at 8.73% CAGR and reward clinics that can furnish real-time outcomes and accept risk-based payments.
Where are clinic shortages most acute?
Rural Midwest and Appalachian counties average fewer than 0.5 clinics per 10,000 residents, constraining access and fueling sign-on bonuses.
What technology trends are reshaping outpatient rehabilitation?
FDA-cleared AI motion-tracking tools raise home-exercise adherence, expand therapist capacity, and support hybrid in-person/virtual care models.