
Market Overview
| Study Period | 2020 - 2031 |
|---|---|
| Forecast Data Period | 2026 - 2031 |
| Base Year Market Size (2025) | USD 13.74 Billion |
| Market Size (2026) | USD 14.6 Billion |
| Market Size (2031) | USD 19.8 Billion |
| Growth Rate (2026 - 2031) | 6.28 % |
| Market Concentration | Medium |
Major Players *Disclaimer: Major Players sorted in no particular order Image © Mordor Intelligence. Reuse requires attribution under CC BY 4.0. | |
United States Manufactured Homes Market Analysis by Mordor Intelligence
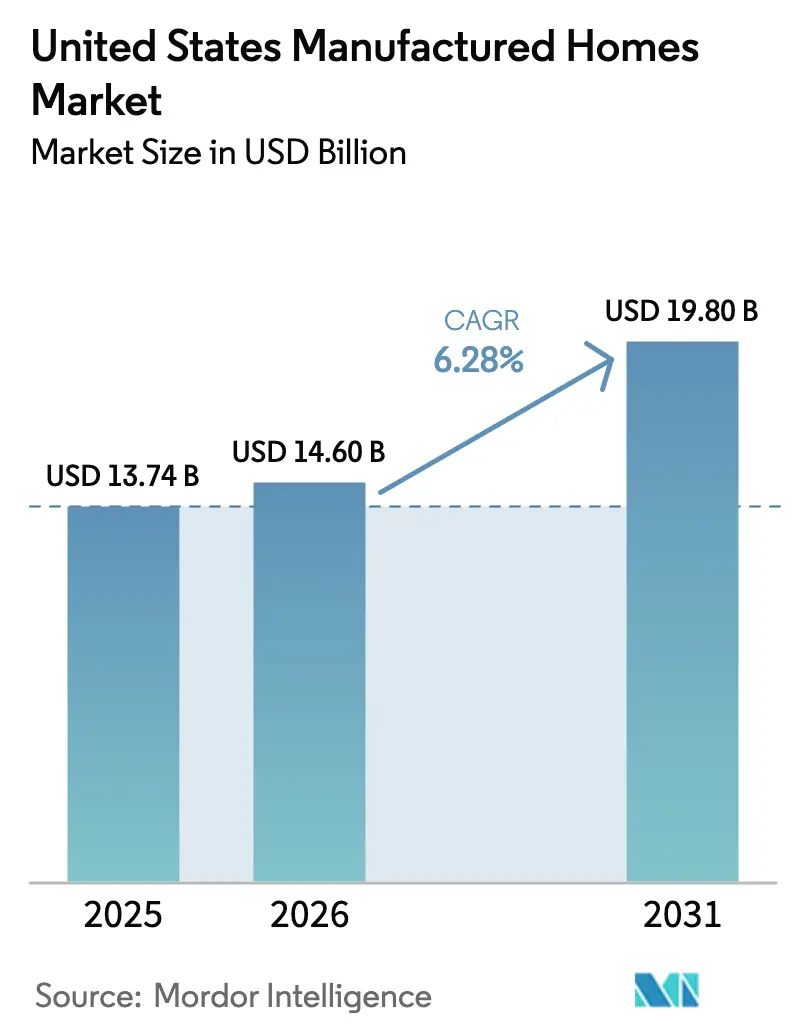
The United States Manufactured Homes market size is expected to grow from USD 13.74 billion in 2025 to USD 14.6 billion in 2026 and is forecast to reach USD 19.8 billion by 2031 at 6.28% CAGR over 2026-2031. Demand continues to widen as factory-built units offer price points that are USD 50,000–100,000 lower than site-built houses, an advantage that resonates with households earning below USD 75,000 and with institutional investors seeking reliable yields. Federal rule modernisation, effective September 2025, permits multi-unit layouts, Energy Star and Zero Energy Ready specifications, and taller rooflines, raising the sector’s appeal to suburban and even urban buyers. Shipments averaged 108,000 units a month in April 2025, a volume that has held firm despite higher interest rates because factory construction cuts build time and labour exposure. Industry leaders are using digital retail, energy-efficient designs, and acquisitions to secure scale as zoning reforms gain traction across Maryland, Rhode Island, and several Sun Belt states.
Key Report Takeaways
- By structure type, multi-section homes led with 54.65% US manufactured homes market share in 2025, while single-section units are poised to grow at a 6.85% CAGR to 2031.
- By application, the single-family segment captured 71.65% of the US manufactured homes market size in 2025; the multi-family segment is projected to expand at an 7.74% CAGR through 2031.
- By material, timber maintained a 64.05% revenue share in 2025, but metal-framed units represent the fastest trajectory at an 8.02% CAGR to 2031.
- By geography, Texas accounted for 18.45% of the total value in 2025, whereas Florida is forecast to post the highest regional CAGR of 8.28% to 2031.
Note: Market size and forecast figures in this report are generated using Mordor Intelligence’s proprietary estimation framework, updated with the latest available data and insights as of 2026.
United States Manufactured Homes Market Trends and Insights
Drivers Impact Analysis*
| Drivers | (~) % Impact on CAGR Forecast | Geographic Relevance | Impact Timeline |
|---|---|---|---|
| Annual unit shipment growth driven by affordable-housing demand | +1.8% | Nationwide, strongest in South and West | Medium term (2-4 years) |
| Rising share of total U.S. home sales as price gap with site-built widens | +1.5% | High-cost coastal metros | Long term (≥ 4 years) |
| Climbing median unit price signalling improved quality perceptions | +1.2% | Suburban markets nationwide | Medium term (2-4 years) |
| Urban affordability crunch steering buyers to factory-built homes | +1.0% | Major metros with high housing costs | Medium term (2-4 years) |
| Faster build cycles and efficient land use in growth suburbs | +0.9% | Texas, Florida, North Carolina suburbs | Short term (≤ 2 years) |
| Federal codes tightening energy and safety performance | +0.7% | Nationwide | Long term (≥ 4 years) |
| Source: Mordor Intelligence | |||
Steady increase in annual unit shipments driven by growing demand for affordable housing alternatives
The US manufactured homes market is witnessing steady growth, driven by increasing demand for affordable housing alternatives. In April 2025, monthly shipments averaged 108,000 units, showcasing consistent activity even as traditional housing starts declined. A significant portion of buyers now comes from households priced out of conventional construction. In 2024, Legacy Housing sold 2,471 home sections, each starting at approximately USD 33,000. Retailers in Texas reported a 4.7% month-over-month increase in deliveries, highlighting the South's critical role in this market. Research from Freddie Mac indicates that 60% of consumers, including 68% of Millennials and 62% of Gen X, are open to considering manufactured homes. This sustained shipment momentum positions the sector as a key solution to the nation’s affordability challenges.
Manufactured homes’ share of total U.S. home sales expanding as pricing gaps widen versus site-built homes
Manufactured homes are gaining traction in the U.S. housing market as affordability challenges persist. Buyers of factory-built homes are saving between USD 50,000 and 100,000 compared to their site-built counterparts. This price gap is widening, driven by inflationary pressures on labor and materials faced by traditional builders. In Q2 2025, Champion Homes announced an average selling price of USD 92,400, marking a 4.5% annual uptick, yet still trailing behind site-built prices. Between 2017 and 2021, "Duty to Serve" programs spurred a 141% surge in loan acquisitions for real-property manufactured homes, indicating a growing liquidity in the secondary market. In 2023, the sector shipped 89,200 homes, accounting for roughly 4% of the nation's housing production. This share is on the rise, especially as CrossMod designs align with single-family zoning regulations. The increasing market share highlights the evolution of the U.S. manufactured homes market, transitioning from a counter-cyclical niche to a central player in the housing arena[1]Sandra Thompson, “2024 Duty To Serve Manufactured Housing Plan,” Federal Housing Finance Agency, fhfa.gov.
Rising median price per unit reflecting greater consumer acceptance and improved quality standards
The U.S. manufactured homes market is witnessing significant advancements, driven by regulatory updates and innovative practices. In September 2024, HUD rolled out 90 new or updated standards, focusing on multi-unit layouts, open floor plans, and contemporary roofing, all aimed at enhancing perceived value. In 2024, Clayton Homes constructed over 51,000 off-site units, with a remarkable 95% certified as Zero Energy Ready, enabling homeowners to slash energy bills by up to 50%. For the fourth consecutive year, Skyline earned the title of America’s Most Trusted Manufactured Home Builder, achieving an impressive Net Trust Quotient Score of 98.5. According to DOE modeling, revamped HVAC protocols could reduce energy consumption for space conditioning by 57% in 800,000 units set to be built from 2023 to 2030. Elevated specification levels empower manufacturers to maintain firm pricing without compromising the affordability edge that bolsters the U.S. manufactured homes market.
Increased adoption due to faster construction timelines and cost-effective land use in suburban regions
The growing demand for faster construction timelines and efficient land use is driving the adoption of manufactured homes in suburban regions. Factory production is shrinking build cycles from months to mere weeks. This rapid turnaround is especially enticing for fast-growing suburbs grappling with a housing supply that's struggling to keep pace with an influx of new residents. Cavco, with its 31 production lines, employs lean manufacturing techniques, effectively minimizing waste and countering labor shortages. In a testament to the trend, Cook County is rolling out a USD 12 million modular pilot in 2025, introducing 120 homes across three neighborhoods. This move underscores how municipalities are leveraging manufactured homes to expedite ownership. Meanwhile, Texas, in 2024, embraced new industrialized housing codes, streamlining approval processes and slashing costs for developers. On another front, the USDA has broadened its rural manufactured housing pilots, extending them through May 2025, thus enhancing financing avenues for suburban and ex-urban areas. With such accelerated deliveries, the US manufactured homes market is solidifying its role as a remedy for shortages in burgeoning growth corridors.
Restraints Impact Analysis*
| Restraints | (~) % Impact on CAGR Forecast | Geographic Relevance | Impact Timeline |
|---|---|---|---|
| Limited mortgage access and higher financing costs due to non-traditional lending frameworks | -1.4% | National, with acute impact in rural and low-income markets | Medium term (2-4 years) |
| Regulatory zoning barriers in multiple states limiting community expansion and placement approvals | -1.1% | 845 counties nationally, concentrated in Northeast and West Coast | Long term (≥ 4 years) |
| Lingering consumer perception issues tied to outdated views of quality and depreciation | -0.8% | National, with stronger impact in suburban and affluent markets | Medium term (2-4 years) |
| Competitive pressure from downsized site-built homes and modular housing formats gaining momentum | -0.6% | Metropolitan areas with active homebuilding markets | Short term (≤ 2 years) |
| Source: Mordor Intelligence | |||
Limited mortgage access and higher financing costs due to non-traditional lending frameworks
Access to affordable financing remains a critical challenge for the U.S. manufactured homes market. Chattel loans for manufactured units often carry rates 150–200 basis points higher than conventional mortgages, diminishing monthly savings and dampening demand for upgrades. While FHA revised Title I caps in late 2024, the personal property classification still bars many borrowers from accessing 30-year fixed-rate products. Fannie Mae's annual target for MHRP acquisitions stands at a mere 7,400, overshadowed by the over 100,000 units shipped each year. Although USDA's January 2025 rule expands Section 502 eligibility, its delayed rollout to May 2025 hampers the relief effort. Without a broader appetite in the secondary market, financing challenges are likely to stifle the growth potential of the U.S. manufactured homes market.
Regulatory zoning barriers in multiple states limiting community expansion and placement approvals
Zoning regulations continue to pose significant challenges to the expansion of manufactured housing communities in the United States. In 845 counties, particularly near affluent coastal metros where affordability is most needed, outdated county codes either ban or limit manufactured housing. While CrossMod designs, which resemble traditional site-built homes, offer some relief, achieving full zoning equality remains a challenge. In 2024, Rhode Island and Maryland introduced pro-manufactured housing laws, yet significant disparities between states continue. Despite industry associations pushing for overarching frameworks, the deep-rooted tradition of local control makes uniform changes challenging. Addressing these zoning barriers is crucial for unlocking the full potential of the US manufactured homes market.
*Our forecasts treat driver/restraint impacts as directional, not additive. The impact forecasts reflect baseline growth, mix effects, and variable interactions.
Segment Analysis
By Structure Type: Multi-Section Dominance Drives Premium Positioning
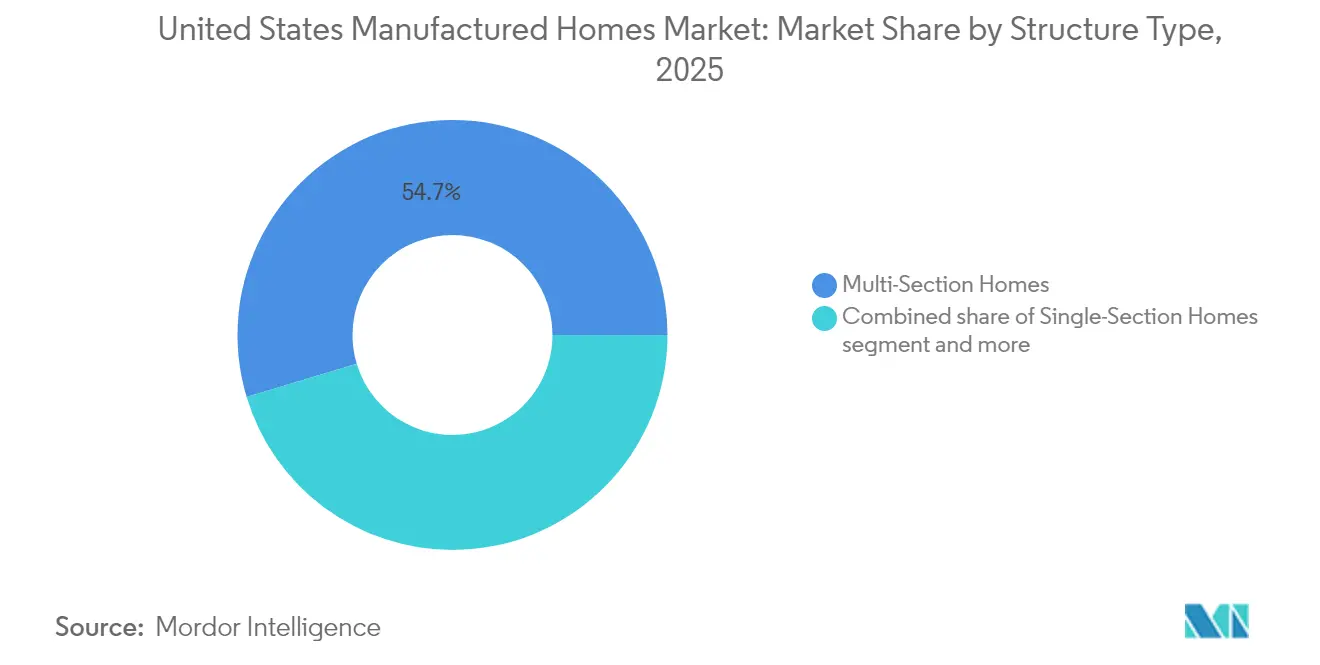
Multi-section homes secured 54.65% of 2025 revenue, underscoring consumer preference for larger footprints that rival site-built floor plans. The US manufactured homes market size for single-section units is expected to climb fastest at a 6.85% CAGR as first-time buyers and urban infill developers leverage compact designs. Clayton’s CrossMod series blurs lines between modular and HUD-code, enabling placement in single-family zones that once excluded factory-built stock. Champion operates 48 plants, posting a 31.3% jump in U.S. homes sold during Q2 2025 as demand spanned both structure types. Price spreads between single and multi-section models are shrinking as energy-efficiency and smart-home features become standardised. HUD’s 2025 rule allows multi-unit configurations inside a single chassis, opening rental and multi-generational use cases and deepening structural diversity.
Multi-section units retain a premium perception because they offer open kitchens, higher ceilings, and optional garages that match suburban buyer expectations. However, factory upgrades such as drywall interiors and full-size porches are now filtering into single-section lines, broadening appeal without eroding affordability. In disaster-prone states, multi-section steel-framed variants provide wind ratings that exceed local codes, a selling point post-hurricane. As production scale expands, manufacturers are shortening custom-order cycles, making multi-section units deliverable in as little as 60 days, versus 120 days five years ago. These efficiencies anchor the long-term share leadership of multi-section homes while keeping the US manufactured homes market open to value-oriented single-section growth.



By Application: Single-Family Leadership Faces Multi-Family Acceleration
Single-family usage represented 71.65% of 2025 revenue, reflecting the product’s roots in owner-occupied housing. Yet multi-family parks and rental portfolios are forecast to log the highest CAGR at 7.74% through 2031, fuelled by investor appetite for stable cash flows and low capital expenditure profiles. Sun Communities’ 99.0% blended occupancy in 2024 highlights resilient demand in lifestyle communities. Freddie Mac’s financing of the California Leisureville park illustrates how agency capital is now backing resident-owned cooperatives. The US manufactured homes market benefits as HUD’s USD 225 million PRICE grants funnel infrastructure upgrades into existing parks, enhancing value and livability.
Institutional buyers favour multi-family parks because lot rent growth is historically less volatile than apartment rents. UMH Properties manages 141 communities with 26,500 sites and has won multiple innovation awards, emphasizing customer-service-driven operations. Disaster recovery programmes also deploy multi-family clusters to re-house displaced populations quickly, expanding the addressable base. As demographic shifts send retirees southward, resort-style parks with amenities such as pickleball courts and marinas are commanding premium valuations. Single-family retention remains strong, but the rising professionalisation of community management signals that the US manufactured homes market will see applications diversify well beyond traditional owner-occupancy.
By Material: Timber Tradition Challenged by Metal Innovation
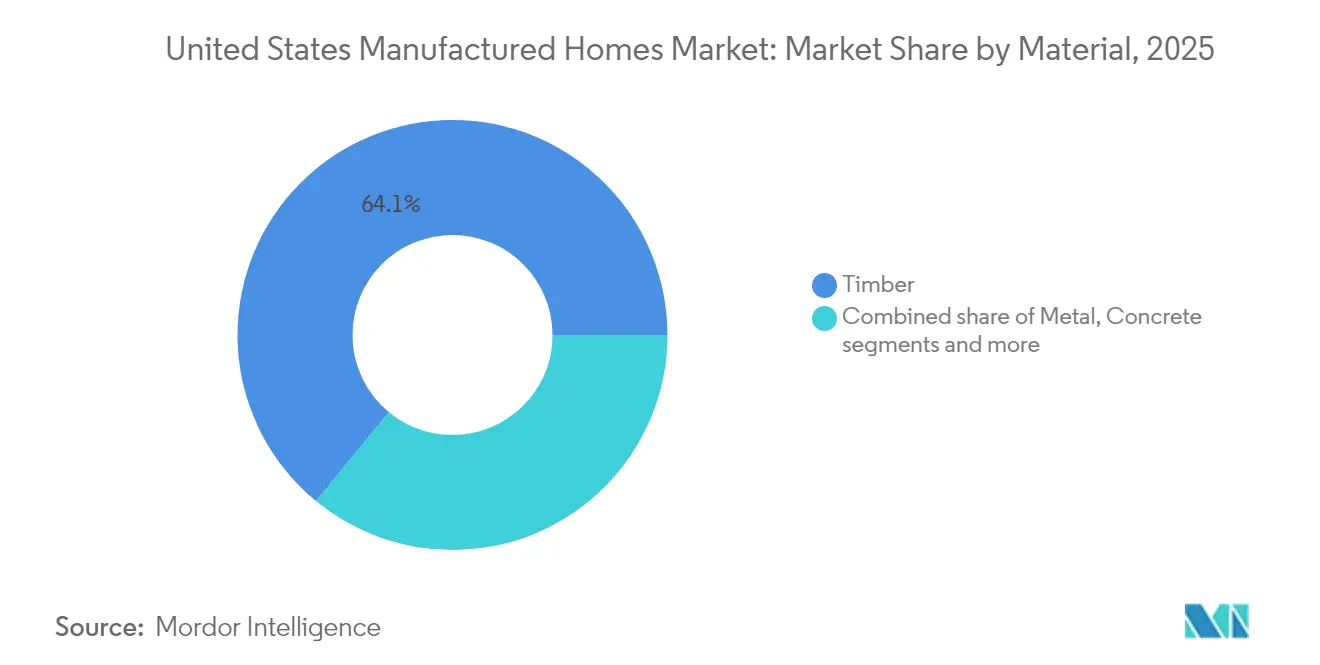
Timber framing accounted for 64.05% of 2025 shipments, supported by entrenched supply chains and builder familiarity. Metal-framed units are projected to record an 8.02% CAGR, the highest among all materials, due to superior wind resistance and lower lifecycle maintenance. HUD’s new Class A fire-rated roof rules encourage composite and steel roofing, nudging buyers toward hybrid builds. DOE incentives for energy-efficient envelopes make structural insulated panels and steel studs more cost-competitive. The US manufactured homes market size for timber remains large, but diverse material mixes improve resilience against lumber price swings.
Clayton achieved Zero Energy Ready status on 95% of output by combining advanced window glazing, thicker insulation, and HVAC heat pumps, choices made feasible by lighter-gauge steel roofs that offset added wall weight. Cavco is trialling cold-formed steel floors in Gulf Coast plants to meet 180 mph wind-zone codes without excessive cost increases. Concrete skirting and fiber-cement siding are penetrating mid-price lines, signaling that buyers accept premium materials when they translate into insurance savings. Supply-chain diversification across metal roll-formers in Mexico and the Southeast reduces import risk from Canadian lumber tariffs. Across materials, continuous code tightening keeps the US manufactured homes market on a technology-upgrade path that benefits manufacturers with engineering depth.
Geography Analysis
Texas retained an 18.45% revenue share in 2025, anchored by business-friendly regulations, above-national-average population growth, and streamlined approval pathways that encourage both retail sales and community development. The state’s April 2025 data show a 2% month-on-month rise in new-home sales and a 4.7% jump in shipments to local retailers, confirming sustained traction despite higher mortgage rates. Updated industrialised-housing codes adopted in 2024 cut plan-review times, allowing manufacturers to stage inventory closer to demand and reinforcing Texas as the volume hub of the US manufactured homes market.
Florida is the fastest-growing state, projected to post an 8.28% CAGR through 2031. Demographic inflows from retirees and remote workers, coupled with frequent hurricane rebuild cycles, create durable demand for code-compliant, wind-rated units. State zoning guidelines support community expansion, and insurers offer premium discounts for HUD-code homes exceeding Wind Zone III standards, strengthening the value proposition. Developers also leverage manufactured homes to address seasonal labour accommodation near tourism corridors, widening the buyer base. As a result, Florida is moving from an opportunistic buyer market to a strategic growth pole within the broader US manufactured homes market.
California, New York, and Illinois illustrate the constraints imposed by dense zoning and lengthy entitlement processes. Despite elevated median home prices, manufactured housing penetration remains modest because many local ordinances still limit placement. Nevertheless, municipal pilot programmes, such as Cook County’s USD 12 million modular initiative that will add 120 units across three neighbourhoods, demonstrate growing political recognition of factory-built value. USDA’s rural lending pilots, extended to May 2025, further unlock demand in surrounding ex-urban counties, particularly in the Midwest and Mid-Atlantic where conventional builders face labour shortages. As additional states replicate Maryland’s and Rhode Island’s 2024 zoning reforms, latent demand could shift the geographic mix, enabling the US manufactured homes market to penetrate historically under-served corridors.
Regulatory Landscape
Manufactured housing in the United States is governed under the National Manufactured Housing Construction and Safety Standards Act of 1974, administered by the US Department of Housing and Urban Development (HUD) Office of Manufactured Housing Programs (OMHP). Core construction and safety requirements are codified in 24 CFR Part 3280 (the HUD Code) and enforced through State Administrative Agencies (SAAs) and third-party inspection frameworks, with each home section carrying a HUD certification label and manufacturer quality-control documentation as proof of compliance.
Rulemaking and technical updates flow through the Manufactured Housing Consensus Committee (MHCC), which advises the HUD Secretary on revisions to construction, installation, and dispute-resolution regulations. In addition to the existing HUD Code pathway, the 21st Century ROAD to Housing Act enacted in July 2026 removed the permanent steel chassis mandate and directed HUD to issue updated minimum energy-efficiency standards within one year, shifting near-term compliance focus for manufacturers and suppliers.
Value Chain Analysis
The US manufactured homes value chain covers raw-material and component suppliers (timber, steel, insulation, windows, and HVAC), factory-based manufacturers producing HUD-code sections under regulated quality-control and inspection regimes, and downstream transport, setup, and installation handled through retailers, installers, and developers. Distribution is executed through independent dealers and vertically integrated retail networks, while community operators and institutional investors buy homes for placement in land-lease communities or rental portfolios; post-sale service and warranty networks then cover repairs and upgrades.
Financing and compliance act as key gatekeepers. Lenders and captive finance arms shape conversion by offering chattel and real-property products, while inspection agencies and SAAs perform the compliance checks required for HUD tags and shipment release. Scale and channel control remain differentiators: Champion Homes reports a 46-facility manufacturing footprint (US and western Canada) and fiscal 2026 net sales of USD 2.7 billion, and Cavco integrates financing through CountryPlace Mortgage (an approved Fannie Mae and Freddie Mac seller/servicer). Industry coordination and advocacy are handled through bodies such as the Manufactured Housing Institute (MHI) and state associations, including the North Carolina Manufactured and Modular Homebuilders Association (NCMHA).
Competitive Landscape
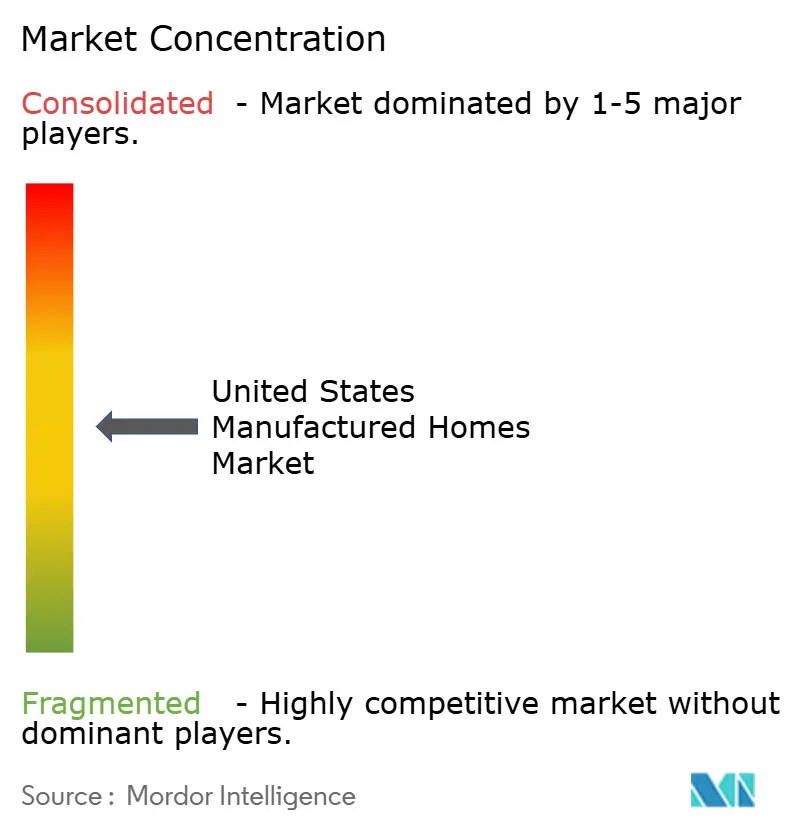
The environment of the United States Manufactured Homes Market is moderately concentrated. Clayton Homes, Skyline Champion Corporation, and Cavco Industries together shipped just under half of all HUD-code units in 2024, yet more than 150 regional producers ensure buyers have localised options. Clayton recorded USD 12.4 billion in revenue, leveraging Berkshire Hathaway capital to integrate retail, finance, and distribution channels while absorbing material-cost inflation. Skyline Champion operates 46 plants in North America, securing 19.9% domestic share through organic expansion and the 2024 purchase of Regional Homes, which added seven facilities and 40 retail centres. Cavco’s 31 lines focus on lean manufacturing that delivered a 22.8% gross margin in the twelve months to September 2024, even as lumber volatility persisted[3]John Goodwin, “2024 Manufactured Housing Production Report,” Manufactured Housing Institute, manufacturedhousing.org.
Strategic themes revolve around energy efficiency, digital sales, and vertical integration. Champion’s direct-to-consumer web platform drove a 32.9% net-sales jump to USD 616.9 million in its fiscal Q2 2025 and a 31.3% rise in U.S. homes sold, validating e-commerce for high-ticket housing. Legacy Housing differentiates via in-house financing that underwrites chattel and land-home loans, capturing buyers unable to secure bank mortgages. Smaller firms such as Deer Valley Homebuilders and Sunshine Homes focus on niche customisation and regional tastes, adding design diversity that keeps the US manufactured homes market responsive to local preference shifts.
Acquisition momentum signals further consolidation. Brookfield divested nearly 80 mobile-home parks for USD 1.6 billion in December 2024, redirecting capital while highlighting institutional appetite for the asset class. Sun Communities exited marinas in a USD 5.65 billion transaction in 2024 to concentrate on manufactured housing and RV sites, freeing up balance-sheet capacity for park expansions. Automation investments—robotic framing lines, computer-numeric-controlled wall saws, and AI-driven quality assurance—are scaling in flagship factories to offset skilled-labour shortages. As energy-performance mandates tighten, players with R&D heft and supply-chain leverage are positioned to widen share, steering the US manufactured homes market toward higher but more efficient concentration.
United States Manufactured Homes Industry Leaders
Clayton Homes, Inc.
Skyline Champion Corporation
Cavco Industries, Inc.
Legacy Housing Corporation
Fleetwood Homes (Cavco)
- *Disclaimer: Major Players sorted in no particular order

Market Opportunities and Future Outlook
Regulatory modernization and legislative changes are creating siting and product opportunities for manufactured homes beyond traditional land-lease community placements. The July 2026 21st Century ROAD to Housing Act removed the permanent chassis mandate, which supports new home architectures that better fit suburban and infill expectations, and it establishes a federal track for HUD-led minimum energy-efficiency standards within one year, improving clarity for high-performance specification planning.
Capacity build-out and channel expansion provide practical near-term paths for share gains in supply-constrained corridors, especially in the South and West where shipments and community development activity are concentrated. In May 2026, Cavco announced construction of a 616,000-square-foot manufacturing facility in El Mirage, Arizona, and Champion Homes entered a definitive agreement (May 2026) to acquire 11 Homes Direct retail locations across Arizona, California, Colorado, New Mexico, and Oregon, expanding consumer access and strengthening manufacturer-to-buyer conversion. Public-sector programs also keep attention on infrastructure-ready placements and faster delivery, including Cook County’s USD 12 million modular pilot (2025) and HUD’s USD 225 million PRICE awards (2024), which support community upgrades and added factory-built inventory.
Recent Industry Developments
- July 2026: The 21st Century ROAD to Housing Act was enacted on July 11, 2026, removing the 1974 federal mandate requiring manufactured homes to be built on a permanent steel chassis. The change broadens design flexibility for producers and could influence project timelines and deployment across multiple markets.
- May 2026: Champion Homes announced a definitive agreement to acquire assets of Homes Direct, including 11 retail locations across AZ, CA, CO, NM, and OR. The move expands Champion's distribution and retail footprint, strengthening consumer access and accelerating multi-state growth.
- May 2026: Cavco Industries announced construction of a 616,000-square-foot manufacturing facility in El Mirage, Arizona. The expansion augments HUD-code production capacity and enhances supply chain resilience, enabling greater regional output.


Research Methodology Framework and Report Scope
Market Definition and Coverage
This market is sized as the annual value generated from new manufactured homes sold in the United States, tracked in USD and aligned to delivered home demand across key end users.
Scope exclusions: Pre-owned home resales, standalone land value, community rental income, and broader site-built modular construction are not counted in this market value.
Segmentation Overview
- By Structure Type
- Single-Section Homes
- Multi-Section Homes
- Other Types
- By Application
- Single Family
- Multi Family
- By Material
- Timber
- Metal
- Concrete
- Others
- By States
- Texas
- California
- Florida
- New York
- Illinois
- Rest of US
Data Sources, Market Sizing, and Validation
Desk Research
Desk research starts by mapping the manufactured housing demand pool and supply output, then cross-checking against publicly visible housing signals. We use sources such as the U.S. Census Bureau Manufactured Housing Survey and HUD USER series to understand shipment direction, seasonality, and state-level concentration, which are needed before any pricing assumptions are applied.
To keep assumptions grounded, we also reference public releases and datasets from organizations such as the Federal Reserve Economic Data (FRED) and industry associations such as MHI and MHARR, along with building and housing indicators from government and state sources when available. We review company filings, investor materials, and credible press to track pricing moves, product mix shifts (single-section versus multi-section), and channel changes. In parallel, we may use paid subscriptions for company financial intelligence, news and financials, patent lookups, and shipment-level import-export checks when it helps validate exposure to components or materials. These desk sources are not exhaustive, and we consulted other public documents for data collection, validation, and clarification.
Primary Interviews and Surveys
Primary work is used to pressure-test the desk assumptions that drive the model, especially pricing, mix, and what is treated as a manufactured home sale versus an adjacent housing product. We speak with stakeholders across the value chain, including manufacturers, retailers, community operators, lenders, installers, and housing-focused advisors, then we re-check inputs across major demand pockets in the country so the conclusions are not anchored to a single state.
Distribution of primary research fieldwork respondents
| Company type | Respondent position |
|---|---|
| Top tier: 29% | CXOs: 16% |
| Mid tier: 55% | Functional/Unit leaders: 38% |
| Smaller Players: 16% | Managers: 46% |
Market-Sizing & Forecasting
Sizing is built using a top-down approach where national manufactured housing shipments and their state pattern are reconstructed from official housing series, then a price and mix layer is applied to arrive at market value. To keep totals practical, the output is compared against selective bottom-up approximations such as sampled average selling prices times unit volumes for common home types, plus channel checks from retailer and community conversations.
The model uses a short list of market fingerprints that are observable and can be refreshed, then it is tuned with interview feedback. Key inputs include annual and monthly shipment levels, the split between single-section and multi-section units, state-level shipment concentration, average selling price progression, and financing accessibility indicators that affect conversion for chattel and mortgage pathways. Where a data series is missing for a state or a small segment, we fill the gap using proxy shares from nearby periods and then adjust using expert feedback so the implied price per home stays in a believable band.
For forecasting, scenario analysis is applied around interest rate sensitivity, affordability-driven substitution from site-built housing, and expected changes in product mix. Scenarios are then narrowed to a base case based on what industry respondents describe as most likely over the next few years. Each forecast year is checked so shipments and pricing do not move in ways that break historical seasonality or create unrealistic jumps.
Data Validation & Update Cycle
Validation is done in layers, starting with simple checks and moving to deeper reviews before the final numbers are signed off. We compare outputs against independent signals such as shipment trend lines, state concentration, and implied average selling prices, then investigate any variance that looks inconsistent with known housing conditions.
Anomalies trigger follow-up calls and a rebuild of the sensitive assumptions, which often include price growth, mix shifts, or adoption changes across key states. The work is reviewed in multiple analyst steps before publication, and the report is refreshed annually, with interim updates if a material event changes demand, supply, or pricing. Before delivery, a final pass is completed so clients receive the latest updated view.
Mordor Intelligence's United States Manufactured Homes Market Size Versus Other Published Estimates
Published market values for manufactured homes can look far apart because each publisher chooses different inclusions, different pricing logic, and even different timing for currency and inflation adjustments. Two reports can sound similar, yet one may be counting a different set of dollars.
The main gap comes from whether community operations and resale activity are blended into the total. Mordor Intelligence treats the market as new manufactured home sales value tied to shipment and delivered-home demand, rather than adding used-home turnover or land and community rental income.
Benchmark comparison
| Source | Market Size | Gaps in Research Methodology |
|---|---|---|
| Mordor Intelligence | USD 13.74 B (2025) | |
| Trade Journal A | USD 221.30 B (2024) | This type of estimate often reflects the broader manufactured housing asset base or property value view, which can fold in community real estate, land, and existing home stock value, thereby inflating totals versus new home sales value. |
| Industry Association B | USD 10.33 B (2024) | Association tracking is typically unit-led and may be closest to shipments, but converting units to value can differ due to varying assumptions on average selling price, multi-section share, and whether transport and installation are included. |
The spread in the table is mostly explained by what is being counted, and then by how unit volumes are translated into dollars. By tying the estimate to observable shipments, a clearly stated scope, and interview-checked pricing and mix assumptions, we keep the market value traceable and repeatable when the model is refreshed.


Key Questions Answered in the Report
How big is the US manufactured homes market today?
The US manufactured homes market stood at USD 14.6 billion in 2026 and is projected to reach USD 19.8 billion by 2031.
What is driving growth in the sector?
A widening price gap with site-built houses, faster build times, and updated federal codes that permit modern designs are the principal demand catalysts.
Which state is the largest market for manufactured homes?
Texas leads with an 18.45% share thanks to streamlined approvals, robust population growth, and a supportive regulatory environment.
Why are financing challenges still a restraint?
Many manufactured homes are titled as personal property, meaning buyers rely on higher-rate chattel loans; secondary-market appetite for real-property loans is improving but remains limited.
Who are the major players in the industry?
Clayton Homes, Skyline Champion Corporation, and Cavco Industries are the largest manufacturers, together shipping nearly half of all HUD-code units in 2024.
Are energy-efficient manufactured homes available?
Yes. Over 95% of Clayton Homes’ 2024 production met Zero Energy Ready standards, and federal tax credits of up to USD 5,000 support buyers of high-performance units.
Page last updated on:




