
United States Disaster Restoration Services Market Size and Share
Market Overview
| Study Period | 2020 - 2031 |
|---|---|
| Forecast Data Period | 2026 - 2031 |
| Base Year Market Size (2025) | USD 17.91 Billion |
| Market Size (2026) | USD 18.62 Billion |
| Market Size (2031) | USD 23.28 Billion |
| Growth Rate (2026 - 2031) | 4.57 % |
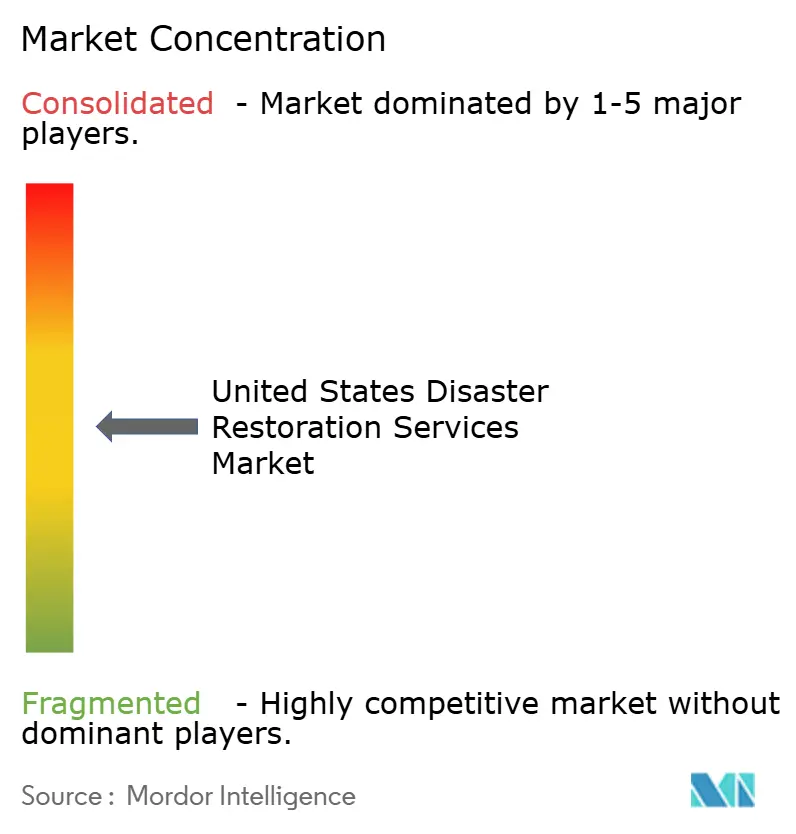
| Market Concentration | Medium |
Major Players *Disclaimer: Major Players sorted in no particular order Image © Mordor Intelligence. Reuse requires attribution under CC BY 4.0. | |
United States Disaster Restoration Services Market Analysis by Mordor Intelligence
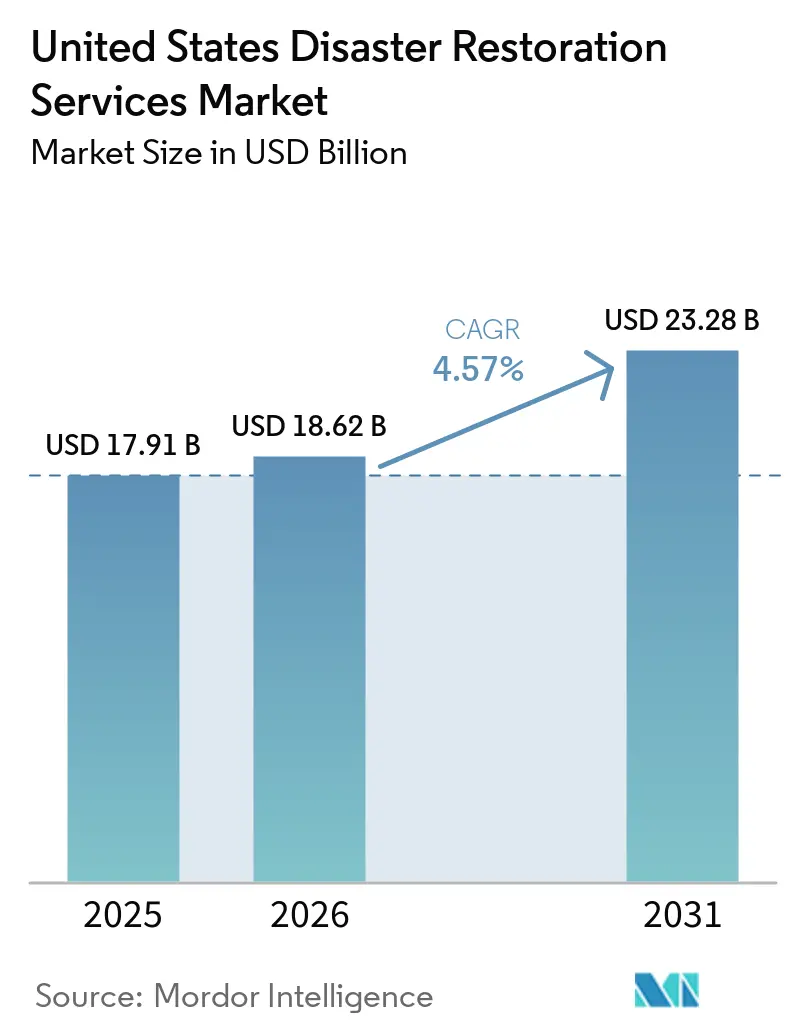
The United States Disaster Restoration Services Market size is expected to grow from USD 17.91 billion in 2025 to USD 18.62 billion in 2026 and is forecast to reach USD 23.28 billion by 2031 at 4.57% CAGR over 2026-2031.
The United States disaster restoration services market is supported by property losses linked to severe weather, a mature housing base, and close operational ties between insurers and restoration providers. Routine losses from plumbing failures, appliance leaks, and localized flooding provide a steady base of assignments even when catastrophe activity is lower. Larger weather events then create periods of intense demand that test available crews, equipment, and insurer networks. Insurers increasingly favor providers that can respond at all hours, document work digitally, and meet certification requirements, which gives established platforms an advantage. The United States disaster restoration services market also has room for wider coverage in secondary cities and rural areas, although technician shortages and slower claims payments can limit near-term capacity.
Key Report Takeaways
- By service type, water damage restoration held 32.60% of the United States disaster restoration services market share in 2025, while others are forecast to grow at a 6.90% CAGR through 2031.
- By application, commercial and industrial properties held 53.30% of the United States disaster restoration services market size in 2025, while residential services are projected to grow at a 5.50% CAGR through 2031.
- By customer/payor type, insurance-funded restoration work held 52.90% of the United States disaster restoration services market share in 2025, while public-sector and government-funded restoration work is forecast to grow at a 5.60% CAGR through 2031.
Note: Market size and forecast figures in this report are generated using Mordor Intelligence’s proprietary estimation framework, updated with the latest available data and insights as of January 2026.
United States Disaster Restoration Services Market Trends and Insights
Drivers Impact Analysis*
| Driver | (~) % Impact on CAGR Forecast | Geographic Relevance | Impact Timeline |
|---|---|---|---|
| Severe Storm and Flood Property Losses | +1.2% | National, concentrated in the South, Gulf Coast, and Midwest | Short term (≤ 2 years) |
| Aging Housing Stock and Building Systems | +1.0% | National, most pronounced in the Northeast and Midwest | Long term (≥ 4 years) |
| Expansion Of Insurer Preferred-Vendor Networks | +0.8% | National | Medium term (2-4 years) |
| Business Interruption Avoidance and End-To-End Recovery | +0.6% | National, concentrated in commercial metropolitan areas | Medium term (2-4 years) |
| Connected Leak Detection and Digital Claims Integration | +0.4% | National, with early gains in multifamily urban areas | Long term (≥ 4 years) |
| Franchise Expansion in Underserved Territories | +0.1% | Secondary and rural markets in the Midwest, South, and West | Medium term (2-4 years) |
| Source: Mordor Intelligence | |||
More Frequent Severe Convective Storm and Flood-Related Property Losses
The United States disaster restoration services market receives a major demand stimulus when widespread storms damage homes, businesses, and public facilities at the same time. Climate Central recorded USD 23 billion in weather and climate disasters in 2025, with total damages of USD 115 billion.[1]Climate Central, “2025 in Review: U.S. Billion-Dollar Disasters,” Climate Central, climatecentral.org. Severe convective storms accounted for 21 of those events, which was a new annual record and reflected concentrated tornado outbreaks across the central United States. January 2025 Los Angeles wildfires caused USD 61.2 billion in estimated damage, damaged or destroyed more than 16,000 properties, and led to more than 200,000 evacuations. The interval between billion-dollar disasters fell from 82 days in the 1980s to 16 days during 2016-2025, leaving less time for contractors and carriers to clear prior losses. A 2025 study estimated a 54% probability that aggregate United States weather and climate disaster damages would exceed USD 1 trillion during 2026-2030, supporting the need for larger restoration capacity.
Aging Housing Stock and Building Systems Requiring Repeated Mitigation
Aging homes create recurring repair needs for the United States disaster restoration services market because older plumbing, electrical, roofing, and HVAC systems fail more often. Nearly 48% of owner-occupied homes were built before 1980, and the median age of owner-occupied housing reached 41 years in 2023, up from 31 years in 2005.[2]National Association of Home Builders, “Remodeling Market Poised for Growth as the Age of Owner-Occupied Homes Increases,” National Association of Home Builders, nahb.org. Harvard University's Joint Center for Housing Studies found that maintenance spending for homes built before 1980 was 76% higher than for homes built from 2010 onward. That spending gap reflects more frequent system failures that can lead to water damage, fire damage, mold, and related remediation work. New construction added only 3% to the owner-occupied housing stock from 2020 through 2023, so new supply did little to change the age profile. Older homes with delayed upkeep can require work across several systems after one event, increasing both the scope and the billable value of a job. This base of recurring work gives providers a steadier assignment flow beyond major catastrophe periods.
Insurer Preferred-Vendor Networks Expanding Outsourced Restoration Volume
The United States disaster restoration services market is shaped by the shift toward managed repair programs run by property and casualty insurers. These programs channel work to contractors that meet carrier requirements for training, documentation, response time, and customer service. The National Association of Insurance Commissioners established its Third-Party Data and Model Task Force in 2024, and its work continued in 2025 as regulators considered third-party data practices in insurance operations. More detailed oversight of third-party claims data can reinforce the value of reliable documentation and accountable vendor processes. Contractors that hold preferred status can build a more predictable referral base and support investment in certified staff and digital claims systems. The same structure may reduce the share of insurance assignments available to firms that lack credentials or always-on response capability. This supports further consolidation among national and regional platforms that can meet carrier standards at scale.
Business-Interruption Avoidance and Demand for End-To-End Recovery
Commercial clients use the United States disaster restoration services market to reduce the period during which a damaged site cannot operate. Business-interruption coverage commonly addresses lost income during the period of restoration, so policyholders and insurers both have a reason to shorten recovery time. The Insurance Information Institute stated that business-interruption losses can range from USD 500,000 to USD 3 million for mid-tier operations and from USD 5 million to USD 50 million or more for major facilities with complex supply chains. This financial exposure favors contractors that coordinate emergency mitigation, structural repair, and reconstruction through one project team. Risk managers and underwriters have placed more attention on restoration duration as business-interruption coverage has become harder to secure. Providers that complete work efficiently can therefore compete on recovery planning and documentation, rather than only on initial cleanup pricing. The United States disaster restoration services market benefits when broader recovery work is assigned to one contractor after a large commercial loss.
Restraints Impact Analysis*
| Restraint | (~) % Impact on CAGR Forecast | Geographic Relevance | Impact Timeline |
|---|---|---|---|
| Skilled Technician Shortages and Certification Bottlenecks | -0.8% | National, most acute in the South and West | Short term (≤ 2 years) |
| Insurance Payment Delays and Scope Disputes | -0.7% | National, the most severe in California and the Gulf Coast states | Medium term (2-4 years) |
| Catastrophe Surge Capacity and Labor Mismatch | -0.5% | National, concentrated in high-frequency catastrophe zones | Short term (≤ 2 years) |
| Preventive Monitoring Reducing Severe Reactive Losses | -0.3% | National, concentrated in multifamily and commercial properties | Long term (≥ 4 years) |
| Source: Mordor Intelligence | |||
Skilled Technician Shortages and Certification Bottlenecks
Labor availability limits how quickly the United States disaster restoration services market can respond when losses rise sharply. A 2026 Restoration Industry Association survey found that 78% of restoration companies had difficulty hiring qualified technicians. IICRC reported that its active certified technician base was approaching 50,000 to 60,000 practitioners and that its certified firm count was near 8,000. Some state legislatures are also making IICRC certification a licensure requirement for mold remediation and related work, which can tighten the effective labor pool. The shortage can lead to delayed assignments, longer project backlogs, and service risk when a catastrophe produces more work than local crews can handle. It also raises the importance of training pipelines, cross-regional deployment, and equipment availability for large platforms. The issue is most severe in places where repeated storms, wildfires, or flooding create overlapping recovery periods.
Insurance Payment Delays, Scope Disputes, and Claims-Administration Friction
Claims handling can slow the United States disaster restoration services market when payment timing and repair scope remain unresolved. In May 2026, the California Department of Insurance reported 398 alleged violations of the Unfair Insurance Practices Act across 220 randomly reviewed State Farm wildfire claims. The examination cited failures involving California's 15-day investigation, 40-day acceptance or denial, and 30-day payment requirements.[3]California Department of Insurance, “California Takes Legal Action Against State Farm After Investigation Finds Widespread Mishandling of LA Wildfire Claims,” California Department of Insurance, insurance.ca.gov. The department sought a major civil penalty and required corrective claims-handling actions. Los Angeles County filed a September 2026 lawsuit alleging delays, low repair estimates, and underpayments affecting 11,300 policyholders who had claims from the Eaton and Palisades Fires.[4]Los Angeles County Counsel, “Los Angeles County Sues State Farm for Unfair Business Practices in Handling 2025 Wildfire Claims,” County of Los Angeles, lacounty.gov. Across the country, payment cycles of 60-120 days and scope disagreements can tie up contractor cash flow and make it harder to add crews or enter new territories. These conditions can be especially difficult for independent operators who have less financial capacity to carry on work before reimbursement.
*Our forecasts treat driver/restraint impacts as directional, not additive. The impact forecasts reflect baseline growth, mix effects, and variable interactions.
Segment Analysis
By Service Type: Water Damage Restoration Anchors Revenue Amid Diversifying Loss Profiles
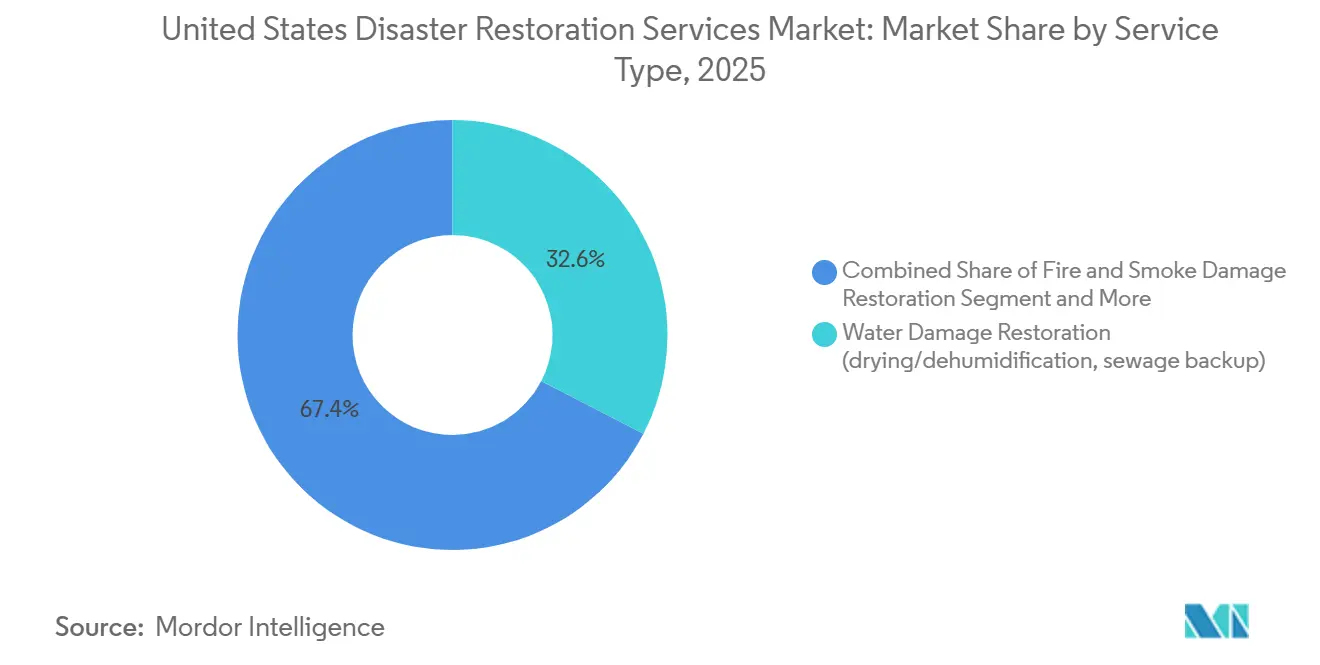
Water damage restoration held 32.60% of the United States disaster restoration services market share in 2025. The segment has a large volume of calls because plumbing failures, appliance leaks, sewage backups, and weather-related flooding occur in every region. The Insurance Information Institute estimated that 1 in 60 insured homes filed a water or freezing damage claim each year. This recurring incidence gives water work a dependable demand floor and supports local response networks. Fire and smoke damage restoration saw heavier demand after the January 2025 Los Angeles wildfires. ATI Restoration deployed more than 1,000 team members and managed more than 500 recovery projects in Southern California during that response. Storm and catastrophe work also increased with the 21 severe-storm billion-dollar events recorded in 2025. These events can require providers to move crews and equipment across state lines while maintaining everyday local assignments.
Others is the fastest-growing service group, with a projected 6.90% CAGR through 2031 for the United States disaster restoration services market size. This category includes contents restoration, pack-out, cleaning, storage, personal property management, and document drying. Clients often seek one provider that can address property contents and structural work in the same recovery plan. Mold remediation grows after water events create secondary contamination that needs specialized treatment. Biohazard and trauma cleanup is also extending into health care, multifamily housing, and commercial settings under IICRC S540 protocols. Specialty services can gain scope where pre-assessment is needed for older buildings, including properties subject to EPA lead paint disclosure rules. The combination of secondary services and full recovery expectations gives companies more opportunities to retain work after the initial emergency call.



By Application: Commercial Dominance Persists While Residential Demand Accelerates
Commercial and industrial properties accounted for 53.30% of the United States disaster restoration services market size in 2025. Large multi-tenant buildings, office parks, retail complexes, and health care facilities have greater exposure per event than a typical single-family assignment. Business-interruption costs can reach USD 5 million to USD 50 million or more at major facilities with complex supply chains. This exposure makes speed, project coordination, and operating continuity central to commercial restoration decisions. Commercial clients often prefer a contractor that manages mitigation, repair, and reconstruction under one contract. Third-party administrators can favor providers that maintain 24/7 capability, certified personnel, and disciplined claims documentation. This encourages national and regional platforms to strengthen their technician depth and carrier relationships. It also helps explain why large commercial losses often go to established providers rather than smaller firms with a limited-service range.
Residential restoration is projected to grow at 5.50% CAGR through 2031 in the United States disaster restoration services market. A large share of the nation's owner-occupied homes was built before 1980, creating continued exposure to aging plumbing, roofing, and electrical systems. Water intrusion in an older home can spread across several rooms or systems before it is discovered. Preferred-vendor endorsements used by homeowners' insurers can simplify referrals to approved restoration firms after a covered loss. That process can reduce the time between reporting a claim and assigning a contractor. Older properties in deferred-maintenance condition may need broader treatment after a loss, including drying, repair, mold work, and reconstruction. Residential work, therefore, offers a large volume of smaller assignments that can complement commercial large-loss projects. The mix can help providers maintain utilization across different weather conditions and regional demand patterns.
By Customer/Payor Type: Insurance Dominance Supported by a Rapidly Scaling Government Channel
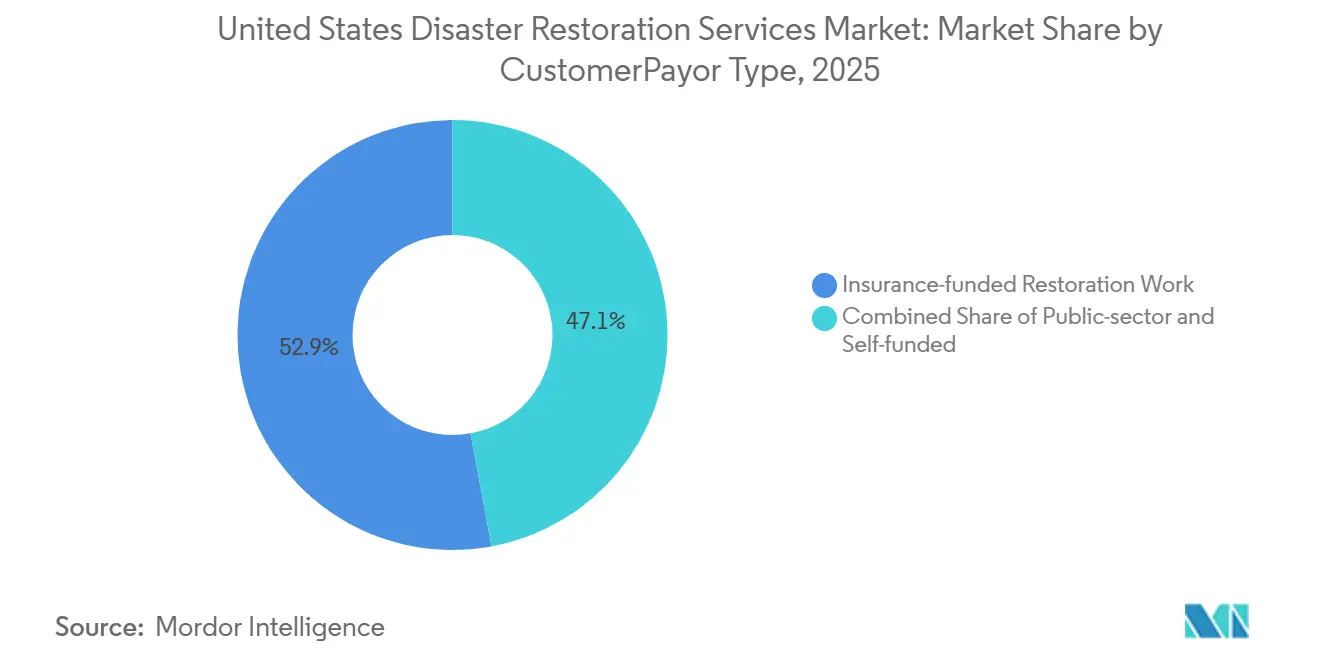
Insurance-funded restoration work held 52.9% of the United States disaster restoration services market in 2025. The category benefits from the established role of insurers in authorizing covered repairs and guiding policyholders to qualified providers. Carrier programs generally place weight on credentials, response standards, estimating discipline, and customer communication. This gives approved contractors a more reliable source of assignments than firms that rely only on direct local marketing. It can also place pressure on margins where third-party administrator fee schedules do not fully reflect project complexity. Self-funded and direct-pay work can rise when deductibles increase or insurers withdraw from catastrophe-prone locations. Those customers still need urgent repair work, but they may make different choices around scope and timing. The payor mix, therefore, affects both assignment volume and the cash-flow profile of restoration providers.
Public-sector and government-funded restoration work is forecast to grow at 5.60% CAGR through 2031. Federal disaster declarations in 2025 covered severe storms, flooding, and tornadoes in Texas, Indiana, Missouri, Kansas, Mississippi, Arkansas, West Virginia, and New Mexico. These declarations create restoration requirements at public buildings and infrastructure in affected areas. In July 2026, SERVPRO received a CoreTrust cooperative contract for emergency disaster restoration services for public agencies nationwide. Cooperative purchasing can allow eligible agencies to use pre-approved purchasing arrangements rather than run a separate procurement process. This creates a route to public work for suppliers that satisfy the relevant contract requirements. Government assignments can be large and geographically dispersed, which favors providers that can coordinate local franchise or branch coverage.
Geography Analysis
The South and Gulf Coast is the highest-volume geography in the United States disaster restoration services market because its weather profile combines hurricanes, severe convective storms, tornadoes, and flood exposure. Texas, Mississippi, Arkansas, and other Southern states received major disaster declarations in 2025 for severe storms, flooding, and tornadoes. The region also contains the Gulf Coast petrochemical corridor, health care campuses, hospitality sites, and retail infrastructure that can generate high-value commercial assignments. These sites often need fast recovery to reduce operating interruption and safety risk. Franchise networks have dense coverage in Texas, Florida, and the Gulf States. That local footprint helps them respond to daily water losses as well as regional catastrophe surges. The broad mix of residential and commercial properties supports a steady service base between major weather events.
The West saw the sharpest shift in demand conditions during 2025. January 2025 Los Angeles wildfires caused USD 61.2 billion in estimated damage and forced more than 200,000 evacuations. The event showed that wildfire response needs now extend beyond the scale historically associated with Gulf Coast hurricanes. Secondary and rural locations can have fewer credentialed providers and less ready access to specialized equipment. PuroClean announced the release of 15 franchise territories in the San Francisco Bay Area in April 2026. It also announced an expansion in El Paso, Texas, in June 2026. These moves show how franchise providers extend coverage where wildfire, smoke, flood, and routine property losses create a growing need for service capacity.
The Northeast has a dense base of aging homes and urban building systems, which supports continuing demand from nor'easters, ice dams, and plumbing failures. Massachusetts, New York, and Pennsylvania have high concentrations of pre-1980 housing, adding to the need for repair and mitigation work. The Midwest remained a center of severe convective storm activity in 2025. The March 2025 Central Tornado Outbreak caused USD 11 billion in damage and produced more than 180 tornadoes. Kansas, Indiana, Missouri, and West Virginia also received federal disaster declarations for storm damage during 2025. Liberty Restoration Group acquired ServiceMaster of Columbia in April 2026 and ServiceMaster Restoration Services by KRS in August 2026, adding offices in Illinois and Wisconsin. The acquisition extended its ServiceMaster Restore platform to 8 Midwestern locations and increased coverage in markets that had less national network presence.
Competitive Landscape
The United States disaster restoration services market is moderately fragmented among national platforms, while regional and independent contractors continue to compete through local relationships and response speed. Large franchise systems and private-equity-backed operators receive a disproportionate share of insurance-assigned and large-loss commercial work. SERVPRO operated more than 2,390 franchises in the United States and Canada as of January 2026, representing 12% growth over the prior 3 years. BELFOR Property Restoration reported annual revenue above USD 2 billion. ATI Restoration, BluSky Restoration Contractors, and FirstService's First Onsite and Paul Davis brands are also active large operators. Their scale matters because major losses require available crews, equipment, certified project managers, and relationships with insurers. ServiceMaster Restore signed 36 franchise agreements in the first half of 2026. PuroClean had surpassed 500 locations by early 2026 and continued to expand across the Midwest, South, and West.
Technology now has a greater role in how providers compete in the United States disaster restoration services market. Digital claims platforms, estimating software, moisture mapping, and drone-based damage assessments can improve documentation and speed decisions after a loss. These tools can make cycle time and record quality more important than basic emergency-service pricing. Connected water sensors and shutoff devices can also trigger a response earlier after water intrusion. This can reduce the extent of damage, although it may lower the number of severe reactive losses over time. National platforms can spread the cost of software, equipment, and training across many locations. Smaller firms may remain competitive through specialist expertise and local trust, but they can face a heavier investment burden. The United States disaster restoration services industry is, therefore, likely to see further emphasis on operating systems that link field teams with insurers and customers.
Strategic expansion remains visible among several leading firms. SERVPRO's July 2026 CoreTrust contract created a national cooperative purchasing route for public agencies seeking emergency restoration support. PuroClean's April 2026 Bay Area territory release targeted markets where wildfire smoke, flooding, and everyday property damage were adding demand. Liberty Restoration Group expanded through acquisitions in Missouri, Illinois, and Wisconsin during 2026. These actions increase coverage in locations with recurring storm exposure and rising demand for organized restoration networks. Private equity support can help operators fund acquisitions, recruit technicians, and add equipment during expansion. At the same time, independent providers remain important because many assignments require a nearby crew with local knowledge. The competitive structure is therefore concentrated in national program work but still dispersed across local service markets.
United States Disaster Restoration Services Industry Leaders
SERVPRO Industries, LLC
BELFOR Holdings Inc.
ServiceMaster Restore
ATI Restoration
Paul Davis Restoration, Inc.
- *Disclaimer: Major Players sorted in no particular order

Recent Industry Developments
- August 2026: Liberty Restoration Group completed its second acquisition of 2026, acquiring ServiceMaster Restoration Services by KRS, ServiceMaster Restore, and adding offices in Peoria and Bloomington, Illinois, and Milwaukee, Wisconsin, expanding its private-equity-backed platform, funded by MBN Brands, Petra Capital Partners, and SharpVue Capital, to 8 Midwestern markets. The deal strengthens restoration coverage across Missouri, Illinois, Wisconsin, Ohio, and Kentucky.
- July 2026: SERVPRO Industries was awarded a cooperative contract with CoreTrust to provide emergency disaster restoration services to public agencies nationwide. Competitively solicited by the Little Rock Water Reclamation Authority, the contract creates a pre-approved procurement vehicle enabling government buyers to engage SERVPRO's franchise network without a separate bidding process.
- April 2026: PuroClean announced expansion into the San Francisco Bay Area, releasing 15 franchise territories spanning San Jose, Santa Clara, Palo Alto, and Oakland to address rising wildfire smoke, flooding, and property restoration demand in underserved Western markets.
- April 2026: Liberty Restoration Group completed the acquisition of ServiceMaster of Columbia in Columbia, Missouri, marking its first acquisition of 2026 and launching its deliberate Midwestern expansion strategy backed by its private equity consortium.


United States Disaster Restoration Services Market Report Scope
| Water Damage Restoration (drying/dehumidification, sewage backup) |
| Fire & Smoke Damage Restoration |
| Mold Remediation |
| Storm / Catastrophe Restoration (wind, hail, flood response, large-loss) |
| Biohazard & Trauma Cleanup (crime scene, unattended death, infectious cleanup) |
| Specialty Services |
| Others (contents restoration, pack-out, cleaning, storage, etc.) |
| Residential |
| Commercial & Industrial |
| Insurance-funded Restoration Work |
| Self-funded / Direct-pay Restoration Work |
| Public-sector / Government-funded Restoration Work |
| By Service Type | Water Damage Restoration (drying/dehumidification, sewage backup) |
| Fire & Smoke Damage Restoration | |
| Mold Remediation | |
| Storm / Catastrophe Restoration (wind, hail, flood response, large-loss) | |
| Biohazard & Trauma Cleanup (crime scene, unattended death, infectious cleanup) | |
| Specialty Services | |
| Others (contents restoration, pack-out, cleaning, storage, etc.) | |
| By Application | Residential |
| Commercial & Industrial | |
| By Customer/Payor Type | Insurance-funded Restoration Work |
| Self-funded / Direct-pay Restoration Work | |
| Public-sector / Government-funded Restoration Work |


Key Questions Answered in the Report
What is the forecast growth rate for the United States disaster restoration services?
The sector is forecast to grow at a 4.57% CAGR from 2026 to 2031, reaching USD 23.28 billion by 2031.
Which service type generated the largest revenue in 2025?
Water damage restoration led service demand with 32.60% revenue share in 2025, supported by recurring plumbing, appliance, and flooding losses.
Why are commercial and industrial properties important to restoration providers?
Commercial and industrial properties held 53.30% revenue share in 2025, and their high business-interruption exposure supports demand for rapid, end-to-end recovery.
Which payor type is growing fastest through 2031?
Public-sector and government-funded restoration work is projected to grow at 5.60% CAGR, supported by disaster declarations and public-facility recovery needs.
What factors limit restoration capacity after a catastrophe?
Technician shortages, certification requirements, insurance payment delays, scope disputes, and local labor shortages can delay assignments and project completion.
Which United States regions have the strongest restoration demand?
The South and Gulf Coast have the highest volume due to hurricane, flood, and severe-storm risk, while the West has seen growing wildfire-related demand.
Page last updated on:





