North America Dairy Desserts Market Size and Share
Market Overview
| Study Period | 2026 - 2031 |
|---|---|
| Forecast Data Period | 2026 - 2031 |
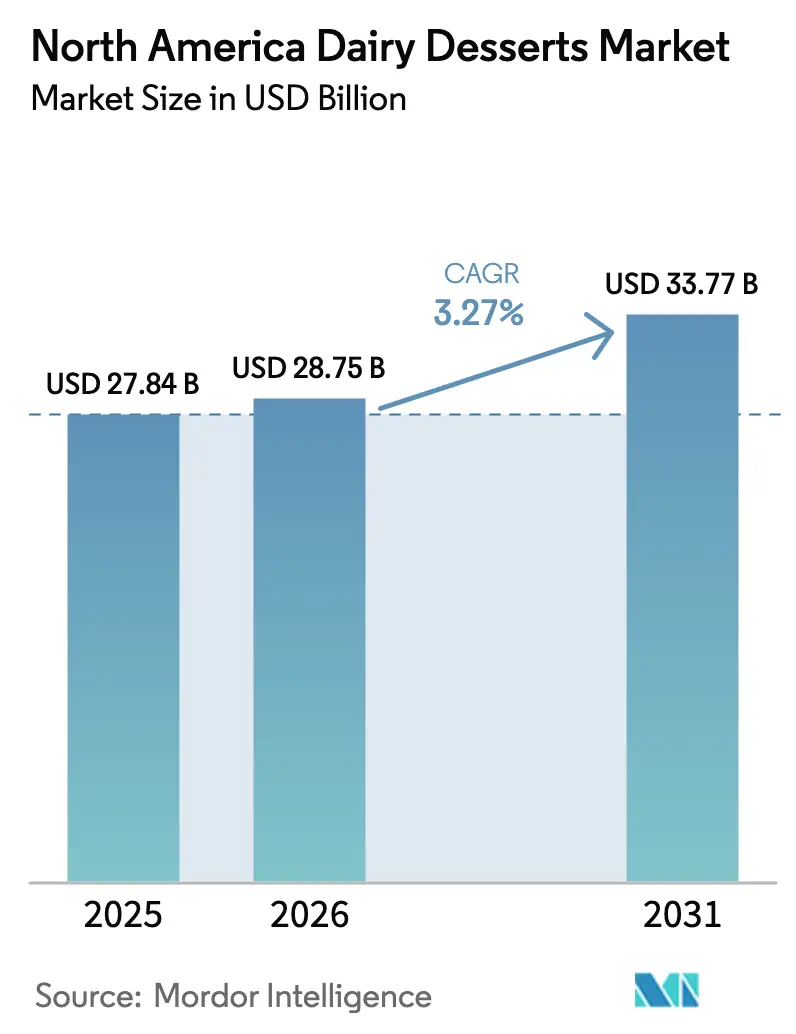
| Base Year Market Size (2025) | USD 27.84 Billion |
| Market Size (2026) | USD 28.75 Billion |
| Market Size (2031) | USD 33.77 Billion |
| Growth Rate (2026 - 2031) | 3.27% CAGR |
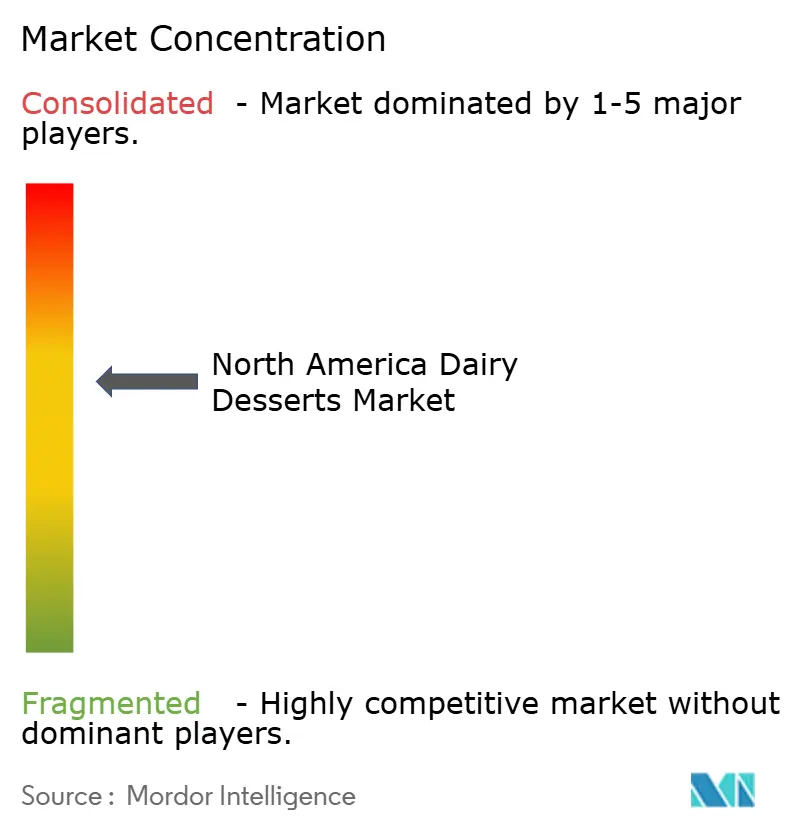
| Market Concentration | Medium |
Major Players
*Disclaimer: Major Players sorted in no particular order Image © Mordor Intelligence. Reuse requires attribution under CC BY 4.0. |
|
North America Dairy Desserts Market Analysis by Mordor Intelligence
The North America Dairy Desserts Market size is projected to increase from USD 27.84 billion in 2025 to USD 28.75 billion in 2026, and reach USD 33.77 billion by 2031, growing at a CAGR of 3.27% from 2026 to 2031. This growth is bolstered by a robust base of ice cream enthusiasts, a trend towards premium offerings, and a resurgence in foodservice patronage. As consumers blend indulgence with wellness, there's a rising demand for frozen desserts, non-dairy options, and protein-enriched treats. The competitive landscape is evolving, with regional experts, direct-to-consumer newcomers, and precision-fermentation providers taking center stage. Meanwhile, established players are benefiting from tech investments in rapid freezing and energy-efficient tools, leading to reduced unit costs. However, the market faces challenges: regulatory scrutiny on added sugars and allergen labels, and rapidly changing flavor trends driven by social media, necessitating swift innovation across all price ranges.
Key Report Takeaways
- By type, ice cream led with an 89.62% volume share in 2025; frozen desserts are forecast to expand at a 4.03% CAGR through 2031.
- By category, dairy-based desserts accounted for a 94.24% volume share in 2025; non-dairy alternatives will advance at a 3.58% CAGR to 2031.
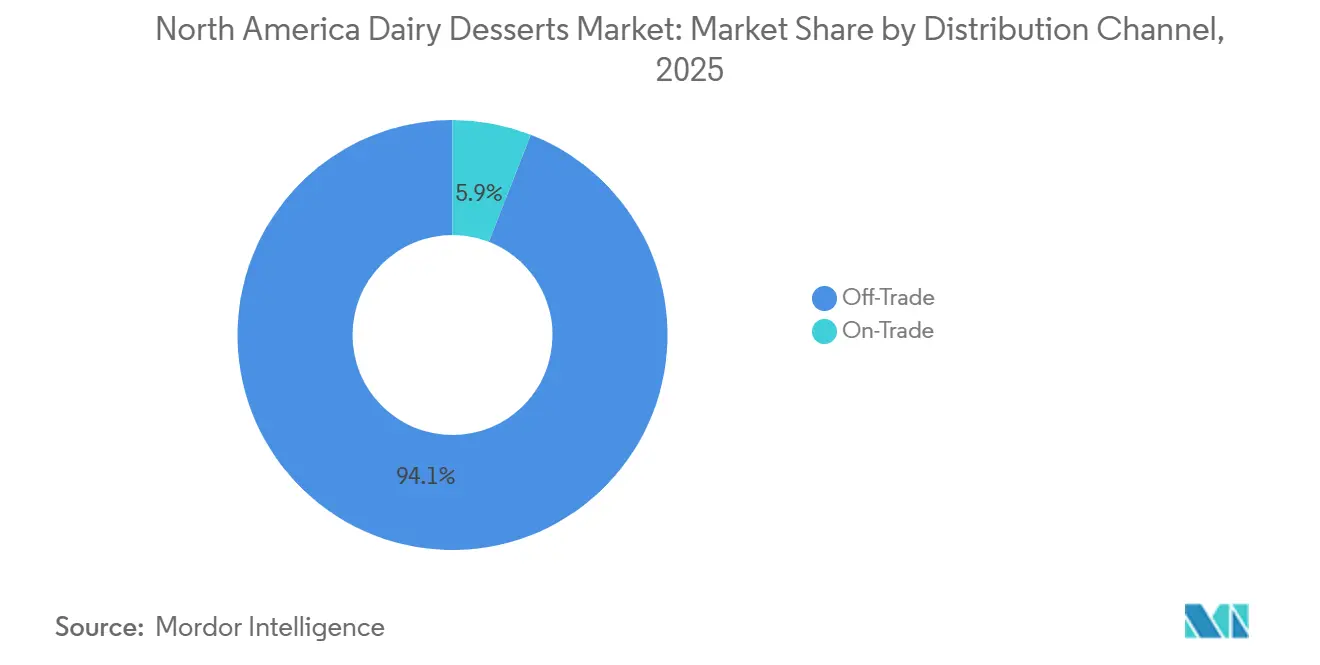
- By distribution channel, off-trade captured 94.08% of 2025 sales; on-trade is projected to grow at a 4.92% CAGR to 2031.
- By geography, the United States commanded 82.93% of regional demand in 2025; Mexico is poised to expand at a 3.95% CAGR through 2031.
Note: Market size and forecast figures in this report are generated using Mordor Intelligence’s proprietary estimation framework, updated with the latest available data and insights as of January 2026.
North America Dairy Desserts Market Trends and Insights
Drivers Impact Analysis*
| Drivers | (~) % Impact on CAGR Forecast | Geographic Relevance | Impact Timeline |
|---|---|---|---|
| Low-sugar, low-fat, and protein-enriched options appeal to health-conscious consumers | +0.8% | United States, Canada | Medium term (2-4 years) |
| Premium and artisanal offerings with unique ingredients attract millennials seeking experiential indulgence | +0.6% | United States, Canada, urban Mexico | Short term (≤ 2 years) |
| E-commerce platforms like Amazon and Walmart enable bulk purchases and subscriptions | +0.5% | United States, Canada | Short term (≤ 2 years) |
| Advancements in freezing, texturization, and shelf-life technologies | +0.4% | North America-wide | Long term (≥ 4 years) |
| Menu innovation in foodservice and quick-service restaurants | +0.5% | United States, urban Canada and Mexico | Medium term (2-4 years) |
| Rising influence of social media and food trends | +0.4% | United States, Canada, Mexico | Short term (≤ 2 years) |
| Source: Mordor Intelligence | |||


Low-Sugar, Low-Fat, and Protein-Enriched Options Appeal to Health-Conscious Consumers
By mid-2024, 12 million Americans were using GLP-1 receptor agonists, which was driving changes in dessert options. These users are reducing their sugar intake by 20-30%, pushing brands to use alternative sweeteners like allulose and erythritol. These sweeteners provide a similar taste and texture to sugar without raising blood glucose levels. In January 2025, Unilever launched Breyers Carb Smart, offering 4 grams of net carbs per serving by using fiber-enriched bases. The product maintains a creamy texture with the help of hydrocolloid blends. Protein fortification has become a standard feature. In 2024, Mars added 5 grams of whey isolate to its Snickers Ice Cream Bars, turning them into post-workout snacks that are priced 15% higher than regular bars. The USDA's 2025 Dietary Guidelines recommend limiting added sugars to less than 10% of daily calories, increasing the pressure on manufacturers to reformulate their products or risk losing shelf space in health-focused stores like Whole Foods[1]U.S. Department of Agriculture. "Dietary Guidelines for Americans 2025", dietaryguidelines.gov. The use of stevia and monkfruit extracts in new product launches highlights a clear shift toward zero-calorie sweeteners.
Premium and Artisanal Offerings with Unique Ingredients Attract Millennials Seeking Experiential Indulgence
Millennials and Gen Z consumers are spending 30% more per pint on small-batch ice creams, such as those made with single-origin vanilla or adaptogenic mushrooms. According to the US Census Bureau, in 2024, Millennials were the largest generation group in the United States, making up about 21.81% of the population[2]US Census Bureau, "Population distribution in the United States in 2024, by generation", census.gov. For these groups, desserts are seen as affordable luxuries rather than everyday items. In 2024, Van Leeuwen partnered with Grey Goose vodka to create an espresso martini ice cream, which sold out online in just 48 hours. This shows how alcohol-infused products can avoid traditional distribution challenges and achieve viral success with minimal marketing costs. In 2025, Tillamook launched its marionberry pie ice cream, made with Oregon-grown berries and a graham-cracker swirl. By focusing on its local ingredients, Tillamook set a price of USD 6.99 per pint, which is 40% higher than national brands. Social media is driving the popularity of limited-edition products. For example, TikTok’s focus on Dubai’s chocolate trend in Q4 2024 caused a 200% increase in searches for pistachio-kunafa ice cream. This trend pushed regional producers to release similar products within six weeks. Quick responses like these benefit flexible co-packers, who can adjust production faster than larger, vertically integrated companies. This agility is fragmenting market share and reducing brand loyalty.
E-Commerce Platforms Like Amazon and Walmart Enable Bulk Purchases and Subscriptions
In 2024, online grocery sales grew significantly, according to the U.S. Census Bureau. Frozen foods have played a major role in this growth, supported by improvements in dry-ice packaging and last-mile cold-chain logistics. Amazon's Subscribe & Save program offers a 15% discount on regular ice cream deliveries, turning occasional purchases into steady income and reducing seasonal demand fluctuations. Walmart has also taken advantage of peak summer demand by securing delivery slots, allowing bulk buyers to purchase 12-pint cases at a 20% discount per unit. This strategy appeals to large families and event organizers who previously relied on warehouse clubs. Direct-to-consumer brands like Van Leeuwen are bypassing distributors entirely, delivering 8-pint bundles for USD 80 with fast 2-day dry-ice shipping. This approach gives them a 25% gross margin, compared to the 12% they would earn through traditional retail. E-commerce is also enabling more personalization, as customers can create their own mixed-flavor packs online, something physical stores cannot easily offer due to the high costs of managing many product variations.
Advancements in Freezing, Texturization, and Shelf-Life Technologies
In 2024, Cornell University partnered with the USDA's Agricultural Research Service to show that flash-freezing at -40°C within 90 seconds after extrusion reduces ice-crystal size by 60%. This method creates a smoother texture that stays consistent even when temperatures change during distribution. Isochoric freezing, which keeps the product at a constant volume while cooling, prevents fruit cells from breaking. This allows cheesecake producers to use fresh strawberries without losing their texture, even after being frozen for 12 months. Pulsed electric field (PEF) processing is another innovation that kills spoilage microbes without using heat. This process doubles the shelf life of chilled mousse from 14 to 28 days while keeping flavor compounds intact, which are usually lost during thermal pasteurization. Additionally, Mars invested USD 70 million in 2024 to improve scraped-surface freezers at its Burr Ridge, Illinois facility. This upgrade reduced energy use per gallon by 18%, helping the company manage rising dairy costs without increasing retail prices. These advancements are closing the cost gap between premium and regular products, making high-quality options more affordable and increasing competition in the market.
Restraints Impact Analysis*
| Restraint | (~) % Impact on CAGR Forecast | Geographic Relevance | Impact Timeline |
|---|---|---|---|
| Rising health concerns related to sugar and fat intake | -0.6% | United States, Canada | Medium term (2-4 years) |
| Lactose intolerance and dairy sensitivity among consumers | -0.4% | United States, Canada | Long term (≥ 4 years) |
| Short shelf life of chilled dairy desserts | -0.3% | Mexico, rural United States and Canada | Medium term (2-4 years) |
| Stringent food safety and labeling regulations | -0.2% | North America-wide | Long term (≥ 4 years) |
| Source: Mordor Intelligence | |||
Rising Health Concerns Related to Sugar and Fat Intake
In 2024, the American Heart Association recommended that women limit added sugar intake to 25 grams per day and men to 36 grams. A standard half-cup serving of ice cream contains 14 grams of sugar, which is nearly half of the daily limit. This has shifted ice cream from being a regular purchase to more of an occasional treat[3]American Heart Association. "Added Sugars Guidance.", heart.org. The CDC reported that 41.9% of U.S. adults were obese in 2024, increasing concerns about high-calorie desserts. Retailers like Kroger have responded by expanding "better-for-you" freezer sections, reducing space for full-fat products. Premium ice creams, which often contain more than 10 grams of saturated fat per serving, exceed dietary guidelines that recommend a daily limit of 13 grams for a 2,000-calorie diet. To address this, brands are reformulating their products using coconut oil or avocado-based fats, though these alternatives lack the creamy texture of traditional ice cream. Meanwhile, GLP-1 medications, which reduce appetite and cravings for sweets, have become more popular. Novo Nordisk reported 15 million U.S. prescriptions for Ozempic and Wegovy by Q3 2024. This trend has led many people to skip desserts entirely instead of choosing healthier options. Indulgent desserts like cheesecakes and mousses are particularly affected, as they do not offer the portion-control convenience of single-serve bars.
Short Shelf Life of Chilled Dairy Desserts
According to FDA guidelines, chilled mousses and cheesecakes have a refrigerated shelf life of 14-21 days. This restricts their distribution to within 500 miles of production facilities and prevents exports to Mexico's interior regions, where cold-chain infrastructure is inadequate. During summer, spoilage risks increase as high temperatures often exceed the cooling capacity of last-mile delivery vans. This leads to 8-12% product losses, further reducing already narrow profit margins. Retailers require at least 7 days of shelf life remaining upon delivery, cutting the saleable period in half. As a result, manufacturers must produce smaller, more frequent batches, which increases costs and reduces efficiency. In Mexico, 60% of retail sales occur through independent tiendas, many of which lack proper refrigeration. This limits the availability of chilled desserts to modern trade outlets, mainly in cities like Mexico City, Monterrey, and Guadalajara. On the other hand, frozen desserts avoid these challenges entirely. With a shelf life of 18-24 months, they can be distributed nationwide and exported, giving them a 4.03% CAGR advantage over chilled desserts.
*Our forecasts treat driver/restraint impacts as directional, not additive. The impact forecasts reflect baseline growth, mix effects, and variable interactions.
Segment Analysis
By Type: Frozen Desserts Gain Share Through Innovation
In 2025, ice cream dominated the market with an 89.62% share, supported by strong brand loyalty and availability in 180,000 retail outlets across the U.S. However, frozen desserts, including novelties, sherbet, and gelato, are expected to grow at a 4.03% CAGR through 2031. This growth is driven by manufacturers introducing portion-controlled options and adding functional ingredients to meet wellness trends. In July 2025, Mars announced a USD 2 billion investment in U.S. manufacturing to increase its frozen novelty production. In rural areas, frozen formats are more popular as they can handle temperature changes during transit. Gelato, positioned as a premium product and priced at USD 8-12 per pint, appeals to urban millennials who value its European authenticity. However, its lower butterfat content (8-10% compared to ice cream's 14-16%) and slower production process make it difficult to scale for mass markets.
The frozen desserts market is growing due to strategic efforts by major players. For example, in January 2025, Unilever launched Breyers Carb Smart frozen bars, which contain 4 grams of net carbs and 5 grams of protein per serving. These bars cater to GLP-1 users with lower sugar tolerance while maintaining the convenience of hand-held treats that encourage impulse purchases at convenience stores. Sherbet, once considered a low-margin product, saw a revival in 2024-2025 as brands reformulated it with real fruit purees and probiotics, turning it into a premium-priced functional snack. Frozen yogurt bars and fruit-based popsicles are also gaining popularity among parents looking for portion-controlled treats for children. Children account for 28% of frozen dessert consumption but only 19% of ice cream pint sales. The FDA's 21 CFR Part 135 standards require ice cream to have at least 10% milkfat, but frozen desserts are not subject to this rule. This gives manufacturers the flexibility to reduce costs or increase protein content without regulatory restrictions.


By Category: Non-Dairy Alternatives Accelerate Despite Small Base
In 2025, dairy-based products dominated the market with a 94.24% share of the total volume. This was driven by consumer familiarity and the creamy texture provided by milkfat. However, non-dairy alternatives are expected to grow at a 3.58% CAGR through 2031 as options like oat, almond, and coconut milk expand from niche health-food stores to mainstream supermarkets. Van Leeuwen's oat milk ice cream, launched in 2024 with flavors like bourbon cherries jubilee, sold 2 million pints in its first year. Despite being priced at USD 6.99—30% higher than dairy-based ice cream—it demonstrated that good taste can offset the higher cost of plant-based products. Although 36% of Americans are lactose intolerant, according to NIH data, non-dairy bases accounted for only 5.76% of the 2025 market volume. This gap presents an opportunity for companies like Perfect Day, which use precision fermentation to create animal-free whey proteins that replicate the creamy texture of dairy. In February 2024, Unilever launched Breyers Lactose-Free Chocolate, made with Perfect Day's fermented whey. This product bridges the gap between dairy and plant-based options and targets the 40 million lactose-intolerant Americans who previously relied on coconut-based products, often criticized for their grainy texture.
Coconut milk dominates the non-dairy segment with a 60% market share, thanks to its high saturated fat content (13-14%), which mimics the richness of cream. However, oat milk is gaining popularity as brands like Oatly license their barista blend to ice cream manufacturers. This appeals to consumers looking for clean-label products and options with a lower environmental impact. Almond-based products lag behind due to their thinner consistency and tendency to separate during freeze-thaw cycles, limiting their use to fruit-flavored sorbets where texture is less critical. Cashew-based products are creamier than almond but face cost challenges. In 2024, raw cashew prices increased by 22% due to supply disruptions in West Africa, squeezing margins for smaller producers. Dairy-based products still hold key advantages, including well-established supply chains, lower input costs (USD 18 per hundredweight for milk compared to USD 35 for oat milk), and the perception that "real" ice cream must contain dairy. However, with 40% of Gen Z identifying as flexitarian and millennials willing to pay 20-30% more for sustainable options, the 3.58% CAGR for non-dairy products could accelerate if taste improves and prices become more competitive with dairy options.
By Distribution Channel: On-Trade Recovery Outpaces Retail
In 2025, off-trade channels accounted for 94.08% of sales, with supermarkets leading at 60%. They used 12-16 feet of freezer space per store to display both mainstream and artisanal products. In 2024, U.S. online grocery sales reached USD 95.8 billion, with frozen foods making up 11%, supported by improved dry-ice packaging and cold-chain logistics. Convenience stores held 18% of off-trade volume, benefiting from impulse purchases during commutes or late nights. Single-serve novelties, priced at USD 1.99-2.49, delivered 40% gross margins, higher than the 28% from pints, prompting retailers to expand freezer options. Walmart secured summer delivery slots, offering 12-pint cases at 20% discounts, appealing to bulk buyers like large families and party planners.
The on-trade market is projected to grow at a 4.92% CAGR through 2031, outpacing off-trade's 3.1%, as foodservice recovers from the pandemic. Quick-service restaurants are adding frozen desserts to value meals to increase check sizes. For example, McDonald's reported a 12% rise in transaction values during 2024-2025 McFlurry promotions, with desserts costing USD 0.40 to make but selling for USD 2.99. Full-service restaurants introduced liquid-nitrogen ice cream stations, creating a theatrical experience that justified USD 15 prices and 70% gross margins, compared to 35% for pre-portioned pints. Sysco's 2025 catalog added 40 new frozen dessert options, including portion-controlled and gluten-free items, reflecting confidence in foodservice demand. Independent ice cream parlors and brands like Cold Stone Creamery thrived as consumers prioritized unique dining experiences over convenience, paying 3-4 times retail prices for customized treats.
Geography Analysis
In 2025, the U.S. led the regional market with 82.93% of the volume, supported by 180,000 retail outlets and a high per-capita consumption of 20 pounds annually—double Canada’s 10 pounds and triple Mexico’s 6 pounds. Mars’ USD 2 billion investment in U.S. manufacturing, announced in July 2025, highlights efforts to maintain market share by focusing on protein-fortified novelties for GLP-1 users with reduced sugar tolerance. Canada’s bilingual labeling rules under CFIA add USD 0.05-0.10 per unit in compliance costs for U.S. exporters, benefiting local producers like Chapman's and Agropur. The South and Midwest regions of the U.S. account for 55% of national volume due to preferences for indulgent desserts and higher obesity rates, while the West Coast, with 25% of the population, drives 40% of non-dairy sales due to health-conscious consumers.
In Mexico, growth is focused in Monterrey, Guadalajara, and Mexico City, where Walmart de México and Soriana operate 3,500 stores with reliable cold chains. However, most sales still come from independent tiendas without refrigeration, limiting chilled desserts to modern trade and leaving rural areas to shelf-stable products. Canada’s per-capita consumption stayed at 10 pounds annually from 2020 to 2025, influenced by health campaigns targeting sugar reduction. Premium products like Häagen-Dazs’ "exträaz," launched in 2024 with layered textures and European ingredients, grew 8% annually by attracting frequent buyers willing to pay CAD 8.99 per pint. The rest of North America, including the Caribbean and Central America, contributes less than 2% of regional volume but shows potential as tourism boosts demand for branded ice cream in resorts, which spills into local retail. The U.S. FDA’s 21 CFR Part 135 standards for frozen desserts are mirrored by Canada’s CFIA and Mexico’s COFEPRIS, simplifying cross-border compliance for global manufacturers but creating challenges for regional startups.
Quebec, which accounts for 23% of Canada’s volume, prefers unique flavors like maple walnut and tourtière-inspired swirls, often overlooked by Anglo brands, creating opportunities for local players like Coaticook. In 2024, Mexico introduced NOM-051-SCFI/SSA1-2010, requiring front-of-package warning labels for high-sugar products. These black octagons cover up to 20% of the label, discouraging health-conscious buyers. However, premium brands like Häagen-Dazs saw little impact, as their customers prioritize indulgence. In the U.S., market maturity is driving growth through premiumization and new channels. Unilever’s March 2024 spin-off of its EUR 7.9 billion ice cream division reflects a shift from commoditized segments to higher-margin categories, creating opportunities for regional specialists and private-label brands.
Competitive Landscape
The North America dairy desserts market is moderately consolidated, with a handful of large multinational and regional players accounting for a significant share of sales alongside numerous niche and private-label brands. Leading companies benefit from strong brand equity, extensive cold-chain infrastructure, and wide distribution across supermarkets, convenience stores, and foodservice channels. Their scale allows them to maintain consistent product availability, invest in marketing, and efficiently manage seasonal demand fluctuations, particularly in frozen dessert categories.
At the same time, smaller and emerging players remain competitive by focusing on product differentiation and premium positioning. Artisanal ice creams, organic and clean-label desserts, and reduced-sugar or lactose-free variants cater to evolving consumer preferences and enable niche brands to capture value despite limited scale. Private labels also play an important role, leveraging retailer trust and shelf access to offer quality dairy desserts at competitive price points, further shaping the competitive landscape.
Competition in the market is increasingly driven by innovation, portfolio diversification, and brand-led engagement rather than price alone. Established players are expanding into premium, better-for-you, and limited-edition offerings to protect market share, while selective acquisitions are used to enter high-growth niches and accelerate innovation. This balance between scale advantages and niche specialization sustains the moderately consolidated structure of the North America dairy desserts market.
North America Dairy Desserts Industry Leaders
-
Blue Bell Creameries LP
-
Froneri International Limited
-
Unilever PLC
-
Wells Enterprises Inc.
-
Dairy Farmers of America Inc.
- *Disclaimer: Major Players sorted in no particular order

Recent Industry Developments
- December 2025: Ben and Jerry's has expanded its product line with the launch of five new ice cream bars. According to the brand, new flavors are Cookie Dough, Chocolate Fudge Brownie, Strawberry Cheesecake, PB Pretzel and Caramel Blondie, a swirl.
- April 2025: Chobani announced a USD 1.2 billion investment to build a 1.4 million square foot dairy processing plant in Rome, New York, with capacity exceeding 1 billion pounds of dairy products annually and expected to create over 1,000 full-time jobs while processing approximately 12 million pounds of milk per day. This represents the largest single dairy processing investment in recent years and significantly expands yogurt-based dessert production capacity.
- July 2025: Dessert Holdings, a premium dessert company, acquired Willamette Valley Pie Co., a manufacturer of high-quality, premium pie and dessert products. This acquisition expands Dessert Holdings' portfolio of scratch-made, clean label, premium desserts.
- February 2025: Wells Enterprises, an ice cream manufacturer, partnered with Ferrero North America to launch a new range of ice cream candy bars featuring popular candy flavors like Butterfinger, Baby Ruth, and 100 Grand.


North America Dairy Desserts Market Report Scope
Cheesecakes, Frozen Desserts, Ice Cream, Mousses, Others are covered as segments by Product Type. Off-Trade, On-Trade are covered as segments by Distribution Channel. Canada, Mexico, United States are covered as segments by Country.| Ice Cream |
| Cheesecakes |
| Frozen Desserts |
| Mousses |
| Others |
| Dairy-based |
| Non-dairy based |
| On-trade | |
| Off-trade | Convenience Stores |
| Specialist Retailers | |
| Supermarkets and Hypermarkets | |
| On-line Retail Stores | |
| Others Distribution Channels |
| United States |
| Canada |
| Mexico |
| Rest of North America |
| Type | Ice Cream | |
| Cheesecakes | ||
| Frozen Desserts | ||
| Mousses | ||
| Others | ||
| Category | Dairy-based | |
| Non-dairy based | ||
| Distribution Channel | On-trade | |
| Off-trade | Convenience Stores | |
| Specialist Retailers | ||
| Supermarkets and Hypermarkets | ||
| On-line Retail Stores | ||
| Others Distribution Channels | ||
| Country | United States | |
| Canada | ||
| Mexico | ||
| Rest of North America | ||


Market Definition
- Butter - Butter is a yellow-to-white solid emulsion of fat globules, water, and inorganic salts produced by churning the cream from cows’ milk
- Dairy - Dairy product include milk and any of the foods made from milk, including butter, cheese, ice cream, yogurt, and condensed and dried milk.
- Frozen Desserts - Frozen dairy dessert means and includes products containing milk or cream and other ingredients which are frozen or semi-frozen prior to consumption, such as ice milk or sherbet, including frozen dairy desserts for special dietary purposes, and sorbet
- Sour Milk Drinks - Sour milk is thick, curdled milk, with a sour taste, obtained from the fermentation of milk. Sour milk drinks such as kefir, laban, buttermilk have been considered in the study
| Keyword | Definition |
|---|---|
| Cultured Butter | Cultured butter is prepared by having the raw butter go through chemical processing and has been added with certain emulsifiers and foreign ingredients. |
| Uncultured Butter | This type of butter is one which has not been processed in any way |
| Natural Cheese | The type of cheese in its most natural form. It is made from natural and simple products and ingredients, including fresh and natural salts, natural colors, enzymes, and high-quality milk. |
| Processed Cheese | Processed cheese undergoes the same processes as natural cheese; however, it requires more steps and many different forms of ingredients. Making processed cheese involves melting natural cheese, emulsifying it, and adding preservatives and other artificial ingredients or colorings. |
| Single Cream | Single cream contains around 18% fat. It’s a single layer of cream that appears over boiled milk. |
| Double Cream | Double cream contains 48% fat, more than double the amount of fat of single cream. It’s heavier and thicker than single cream |
| Whipping Cream | This has a much higher fat percentage than single cream (36%). Used to top cakes, pies, and puddings and as a thickener for sauces, soups, and fillings. |
| Frozen Desserts | Desserts that are meant to be eaten in frozen condition. E.g., sherbets, sorbets, frozen yogurts |
| UHT Milk (Ultra-high temperature milk) | Milk heated at a very high temperature. Ultra-high-temperature processing (UHT) of milk involves heating for 1–8 sec at 135–154°C. which kills the spore-forming pathogenic microorganism, resulting in a product with a shelf-life of several months. |
| Non-dairy butter/Plant-based butter | Butter made from plant-derived oil such as coconut, palm, etc. |
| Non-dairy Yogurt | Yogurt made from typically made from nuts, like almonds, cashews, coconuts, and even other foods like soybeans, plantains, oats, and peas |
| On-trade | It refers to restaurants, QSRs, and bars. |
| Off-trade | It refers to supermarkets, hypermarkets, on-line channels, etc. |
| Neufchatel cheese | One of the oldest kinds of cheese in France. It is a soft, slightly crumbly, mold-ripened, bloomy-rind cheese made in the Neufchâtel-en-Bray region of Normandy. |
| Flexitarian | It refers to a consumer preferring a semi-vegetarian diet, that is centered on plant foods with limited or occasional inclusion of meat. |
| Lactose Intolerance | Lactose intolerance is a reaction in digestive system to lactose, the sugar in milk. It causes uncomfortable symptoms in response to the consumption of dairy products. |
| Cream Cheese | Cream cheese is a soft and creamy fresh cheese with a tangy taste made from milk and cream. |
| Sorbets | Sorbet is a frozen dessert made using ice combined with fruit juice, fruit purée, or other ingredients, such as wine, liqueur, or honey. |
| Sherbet | Sherbet is a sweetened frozen dessert made with fruit and some sort of dairy product such as milk or cream. |
| Shelf stable | Foods that can be safely stored at room temperature, or "on the shelf," for at least one year and do not have to be cooked or refrigerated to eat safely. |
| DSD | Direct Store Delivery is the process in supply chain management wherein the product is delivered from manufacturing plant directly to the retailer. |
| OU Kosher | Orthodox Union Kosher is a kosher certification agency based in New York City. |
| Gelato | Gelato is a frozen creamy dessert made with milk, heavy cream and sugar. |
| Grass-fed Cows | Grass-fed cows are allowed to graze in pastures, where they eat a variety of grasses and clover. |


Research Methodology
Mordor Intelligence follows a four-step methodology in all our reports.
- Step-1: Identify Key Variables: In order to build a robust forecasting methodology, the variables and factors identified in Step 1 are tested against available historical market numbers. Through an iterative process, the variables required for market forecast are set, and the model is built on the basis of these variables.
- Step-2: Build a Market Model: Market-size estimations for the forecast years are in nominal terms. Inflation is not a part of the pricing, and the average selling price (ASP) is kept constant throughout the forecast period for each country.
- Step-3: Validate and Finalize: In this important step, all market numbers, variables, and analyst calls are validated through an extensive network of primary research experts from the market studied. The respondents are selected across levels and functions to generate a holistic picture of the market studied.
- Step-4: Research Outputs: Syndicated Reports, Custom Consulting Assignments, Databases & Subscription Platforms


