
United States Air Purifier Market Size and Share
Market Overview
| Study Period | 2021 - 2031 |
|---|---|
| Forecast Data Period | 2026 - 2031 |
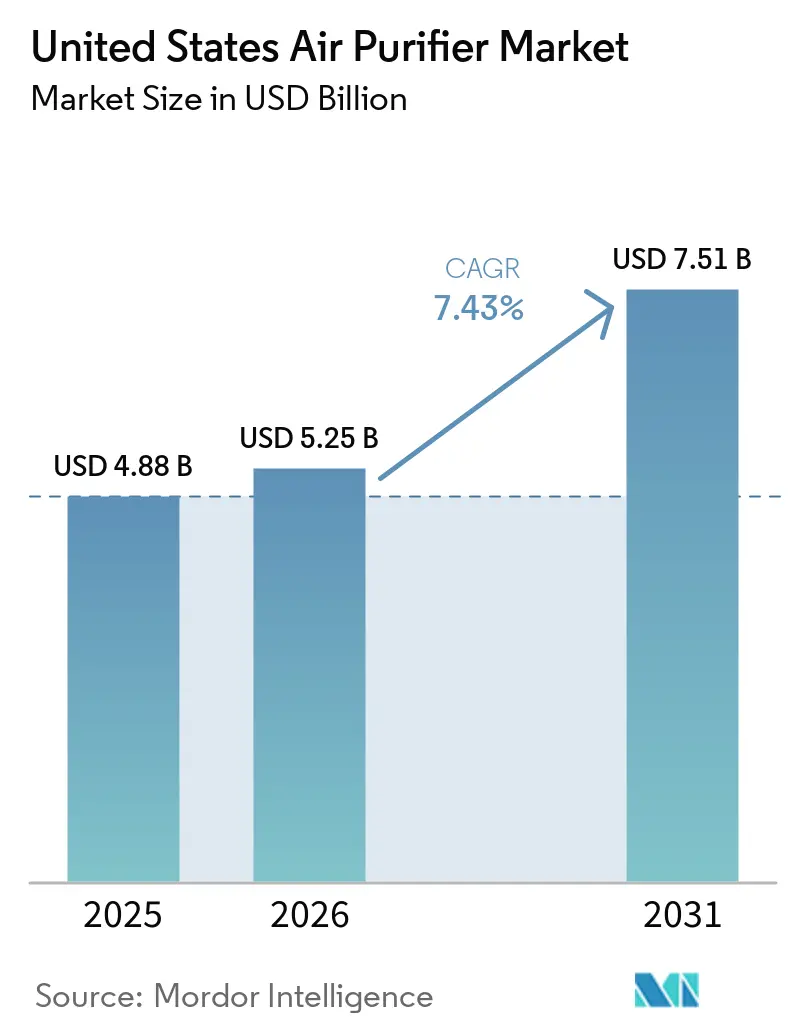
| Base Year Market Size (2025) | USD 4.88 Billion |
| Market Size (2026) | USD 5.25 Billion |
| Market Size (2031) | USD 7.51 Billion |
| Growth Rate (2026 - 2031) | 7.43 % |
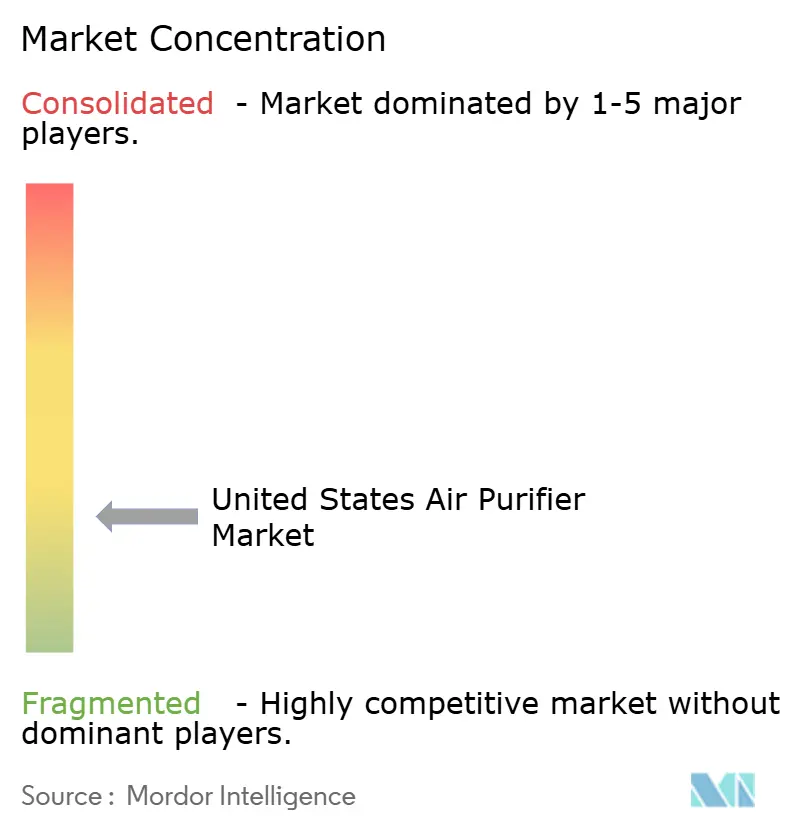
| Market Concentration | Low |
Major Players *Disclaimer: Major Players sorted in no particular order Image © Mordor Intelligence. Reuse requires attribution under CC BY 4.0. | |
United States Air Purifier Market Analysis by Mordor Intelligence
The US air purifier market size was valued at USD 4.88 billion in 2025 and is estimated to grow from USD 5.25 billion in 2026 to reach USD 7.51 billion by 2031, at a CAGR of 7.43% during the forecast period (2026-2031). Tighter public attention to particle pollution and more frequent smoke events are moving air cleaning from an occasional purchase toward a practical household measure. The Environmental Protection Agency lowered the annual PM2.5 standard to 9 µg/m³ in February 2024, strengthening the public health context for household air cleaning.[1] The American Lung Association reported in 2025 that 156 million Americans lived in counties with failing grades for ozone or particle pollution, the highest total in a decade.[2] The US air purifier market is also moving toward products that document air quality, operate efficiently, and create repeat revenue through filters or service plans. ENERGY STAR Version 3.0 took effect on October 9, 2025, using PM2.5 CADR per watt for room air cleaners and creating a clearer efficiency benchmark for product replacement.[3]
Key Report Takeaways
- By filtration technology, HEPA held 50.6% of the US air purifier market share in 2025, while activated carbon is forecast to expand at an 8.1% CAGR through 2031.
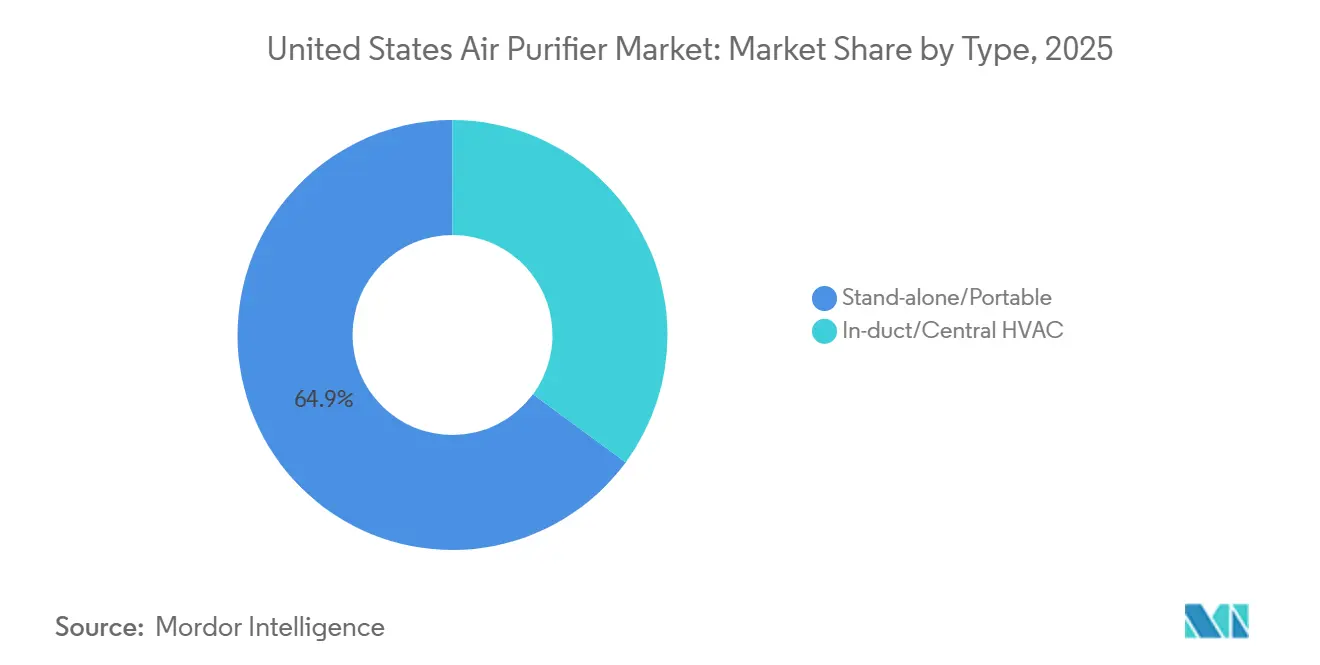
- By type, stand-alone and portable units accounted for 64.9% of the US air purifier market size in 2025, while in-duct and central HVAC systems are forecast to grow at an 8.8% CAGR through 2031.
- By connectivity, non-smart units held 85.8% of the US air purifier market share in 2025, while smart and IoT-enabled devices are forecast to grow at an 11.2% CAGR through 2031.
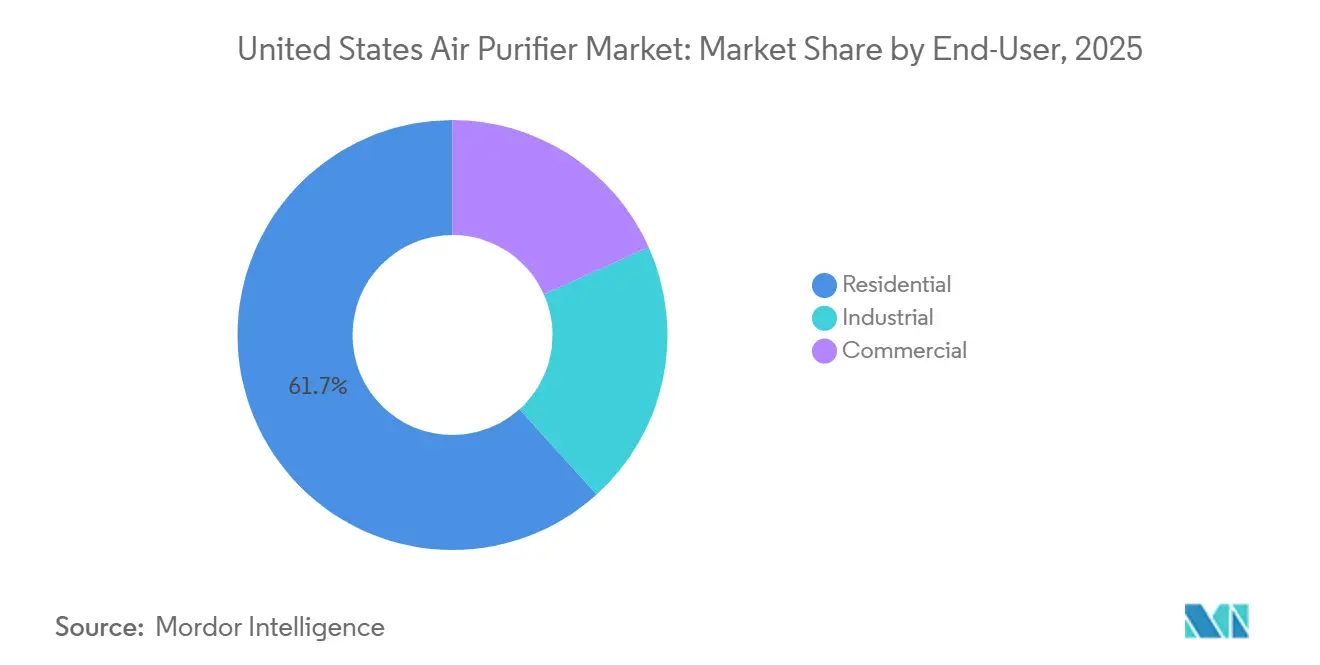
- By end user, residential buyers held a 61.7% share in 2025, while commercial users are forecast to expand at a 9.7% CAGR through 2031.
Note: Market size and forecast figures in this report are generated using Mordor Intelligence’s proprietary estimation framework, updated with the latest available data and insights as of January 2026.
United States Air Purifier Market Trends and Insights
Drivers Impact Analysis*
| Driver | (~) % Impact on CAGR Forecast | Geographic Relevance | Impact Timeline |
|---|---|---|---|
| Indoor Air Quality and Respiratory Health Awareness | +2.0% | National, with concentration in Western states, the urban Northeast, and Midwest | Long term (≥ 4 years) |
| Wildfire Smoke and Seasonal Particulate Exposure | +1.8% | Western states and the Minnesota to Texas corridor | Medium term (2-4 years) |
| Commercial Healthy-Building and Smart Monitoring Adoption | +1.3% | National, with early gains in New York, Chicago, Los Angeles, and Dallas | Medium term (2-4 years) |
| Connected Home Ecosystems and Remote Air Quality Control | +0.8% | National, with stronger penetration in coastal metros and technology-adopter suburbs | Long term (≥ 4 years) |
| Filter Replacement and Energy Analytics Service Models | +0.5% | National, particularly online-first and subscription-ready households | Long term (≥ 4 years) |
| Energy-Efficiency Rebates | +0.4% | Illinois, Texas, Louisiana, and utility service territories with ENERGY STAR rebates | Short term (≤ 2 years) |
| Source: Mordor Intelligence | |||
Rising Indoor Air Quality and Respiratory Health Awareness
Growing awareness of airborne pollutants is making air purifiers a more established household purchase in the US air purifier market. The American Lung Association found that 125 million Americans lived in counties with unhealthy ozone levels during its most recent monitored period. Its 2025 report also found that 77.2 million people experienced unhealthy short-term particle pollution spikes, the highest count in its 16-year series. The lower federal PM2.5 standard gives local public-health communications a more demanding reference point for particle exposure.[4] People managing asthma or chronic obstructive pulmonary disease may replace filters on care-related schedules, rather than delaying purchases during weaker consumer spending periods. This recurring need supports replacement-filter demand and reduces the reliance on first-time appliance sales.
Intensifying Wildfire Smoke and Seasonal Particulate Exposure
Wildfire smoke has broadened demand for the US air purifier market beyond its earlier concentration in Western states. Smoke from the 2023 Canadian wildfires reached the Midwest and Northeast, exposing many households to severe particle pollution events that had previously been uncommon in those regions. The EPA identifies portable air cleaners as a protective option during wildfire smoke events and recommends MERV 13 or higher HVAC filters for whole-house protection. These events can trigger immediate portable-unit demand when outdoor conditions deteriorate. They also raise interest in central systems where building operators need a longer-term response. Commercial buyers increasingly need records of indoor conditions, not only basic assurance that an air cleaner is operating.
Commercial Healthy-Building and Smart-Monitoring Adoption
Commercial property operators are giving more attention to documented indoor air quality in tenant retention, health, and risk-management decisions. ASHRAE Standard 241 addresses control of infectious aerosols and defines equivalent clean airflow requirements for Infection Risk Management Modes. AirBox America launched its Vortex 4000 HVP in February 2025 as a high-volume system designed for both ASHRAE 241 and ASHRAE 62.1 applications. Pyure introduced its Environment 360 platform in October 2025, combining purification, sensors, energy analytics, and annual certification. WELL and LEED programs make ongoing indoor-air performance relevant to building owners who pursue these certifications. This supports longer procurement cycles for higher-capacity systems and monitoring services.
Expansion of Connected Home Ecosystems and Remote Air-Quality Control
Connected home systems are placing air purifiers within broader home-control routines across the US air purifier market. Smart devices allow users to monitor conditions, schedule operating times, and adjust operation remotely. Coway expanded its connected residential offering in January 2026 with remote monitoring and energy-saving features described in the supplied draft. The company also connected selected offerings with Amazon Alexa and Amazon Dash Replenishment, linking filter use to reordering. These functions can make the filter relationship more continuous after the initial appliance sale. They also create a premium product path for households replacing older manual units.
Restraints Impact Analysis*
| Restraint | (~) % Impact on CAGR Forecast | Geographic Relevance | Impact Timeline |
|---|---|---|---|
| Filter and Electricity Costs | -1.0% | National, with stronger effects among lower-income and price-sensitive users | Long term (≥ 4 years) |
| Ozone, By-Product, and Efficacy-Claim Scrutiny | -0.7% | National, with California leading through CARB requirements | Medium term (2-4 years) |
| Sensor-Data Privacy and Cybersecurity Concerns | -0.5% | National, particularly enterprise and government procurement | Medium term (2-4 years) |
| Imported Component Supply and Tariff Exposure | -0.6% | National, particularly brands without diversified sourcing | Short term (≤ 2 years) |
| Source: Mordor Intelligence | |||
High Lifetime Cost of Filters and Electricity
The cost of ownership can limit continued use of air purifiers, especially for price-sensitive households. A typical residential HEPA filter needs replacement every 6-12 months, and the supplied draft identifies OEM cartridge prices of USD 30 to USD 100. Continuous operation also adds electricity costs over the life of the product. SharkNinja launched the Shark BreatheClear Max with NeverChange technology in April 2026, presenting a design intended to avoid routine filter replacement for up to 6 years. Alen and PuroAir use subscription-related incentives and warranties to make replacement filters easier to manage. Even so, the recurring cost remains a barrier for households that prioritize upfront price over lifetime operating economics.
Ozone, By-Product, and Efficacy-Claim Scrutiny
Regulatory attention to ozone, chemical by-products, and performance claims narrows the acceptable positioning for active air-cleaning technologies. California requires certification for portable and electronic in-duct air cleaners sold in the state and limits ozone emissions to 0.050 ppm. California's 2024 update also removed an earlier exemption for electronic in-duct devices. NIST reported in September 2025 that a new ASTM test method measures ozone, formaldehyde, and ultrafine particle by-products from air cleaners. The method gives manufacturers and laboratories a comparable basis for assessing emissions. It also increases the need for substantiated performance claims and cautious product communication.
*Our forecasts treat driver/restraint impacts as directional, not additive. The impact forecasts reflect baseline growth, mix effects, and variable interactions.
Segment Analysis
By Filtration Technology: HEPA Leads While Multi-Contaminant Systems Gain Attention
HEPA held 50.6% of the US air purifier market share in 2025, supported by its familiar role in particle-removal messaging. The EPA and CDC reference high-efficiency filtration in guidance for improving indoor air quality, while AHAM CADR testing provides a recognized performance reference. Established retail channels benefit from this familiarity because customers can compare HEPA-based products with limited technical explanation. The technology also supports premium pricing when products carry credible performance certifications. Activated carbon is forecast to grow at an 8.1% CAGR through 2031 as consumers pay more attention to volatile organic compounds and odors. Renovation activity and awareness of indoor chemicals support interest in filtration that addresses gases as well as particles. The US air purifier market includes ionic and electrostatic units, but these products face tighter limits on ozone emissions and closer review of their claimed benefits. UV-C and photocatalytic oxidation products face related scrutiny after NIST described the standardized measurement of chemical by-products.
Hybrid and multi-stage systems have a clearer role in premium competition because they combine particle filtration with gas-phase treatment. Blueair launched its Blue Signature in June 2025 with 7 filtration stages and a bio-based photocatalyst layer. The company said the model could clean 3,385 ft² in 1 hour, positioning it against high-throughput HEPA products. Multi-stage designs allow brands to address odors and gas-phase contaminants that basic HEPA designs do not target. ENERGY STAR Version 3.0 uses PM2.5 CADR per watt, which gives efficiency a more central role in product comparison. This may favor systems that meet the newer metric without major redesign. It may also require older product platforms to absorb recertification costs. The US air purifier industry therefore faces a more demanding balance between contaminant coverage, energy use, and compliance.
By Type: Portable Units Lead While In-Duct Systems Serve Commercial Needs
Stand-alone and portable units accounted for 64.9% of the US air purifier market size in 2025 because they are accessible and easy to place in individual rooms. Their broad retail presence supports purchases through e-commerce and large physical retailers. Households can deploy them without renovation or professional installation. Demand in Western states rises during periods of elevated wildfire smoke and air-quality alerts. This creates purchases that are not always linked to housing renovation activity. In-duct and central HVAC systems are forecast to grow at an 8.8% CAGR through 2031. Institutional buyers increasingly treat HVAC-integrated cleaning as building equipment rather than a discretionary appliance. ASHRAE Standard 241 makes equivalent clean airflow relevant to infectious-aerosol controls in applicable building operating modes.
Portable and in-duct categories differ in their buyers as well as their physical design. Consumers generally choose portable units, while in-duct projects involve facility managers, engineers, and sustainability personnel. These commercial buyers assess filtration ratings, safety listings, compliance needs, and operating costs. AprilAire and Daikin have relevant HVAC integration capabilities in this channel, as noted in the supplied draft. Department of Energy conservation standards apply to air cleaners manufactured or imported into the United States. The standards listed Tier 1 as effective December 31, 2023, and Tier 2 as effective December 31, 2025. This raises the design baseline for new equipment. It can also support replacement decisions for older commercial filter and air-cleaning installations.
By Connectivity: Non-Smart Units Form the Installed Base While Smart Devices Grow Faster
Non-smart units retained 85.8% share of the US air purifier market in 2025, making manual products the largest installed base. These units are familiar, usually simpler to operate, and often lower priced than connected alternatives. Many have multi-year ownership cycles, leaving a large population of products that may be replaced over time. ENERGY STAR Version 3.0 provides a newer PM2.5 CADR per watt metric for labeled room air cleaners. Retailers can use that standard to explain efficiency differences to customers considering a replacement. Smart and IoT-enabled devices are forecast to grow at an 11.2% CAGR through 2031. Their higher prices create a margin opportunity where remote monitoring and automated controls have clear user value.
Smart models also introduce data and cybersecurity considerations into product selection. The supplied draft cited a security disclosure involving Molekule devices and an unsecured MQTT broker, illustrating the sensitivity of connected-device data practices. An IEEE study published in 2026 described cloud-edge collaborative architectures for intelligent indoor air purification. Local processing can reduce dependence on cloud-based data transfer in appropriate product designs. Enterprise and premium residential buyers may place greater value on secure firmware and over-the-air update capability. These needs can influence vendor selection alongside sensor quality and app usability. The US air purifier market will therefore require connected-product suppliers to explain how device data is handled. Trust in these controls is particularly relevant for commercial buyers with formal procurement requirements.
By End User: Residential Demand Leads While Commercial Adoption Accelerates
Residential buyers held a 61.7% share in 2025, making households the largest end-user group in the US air purifier market. Demand is strongest among urban and suburban households that have children, respiratory concerns, or direct exposure to poor outdoor air conditions. Wildfire-related alerts can create sharp retail demand in California and other Western states. The 2023 Canadian wildfire episode showed that this response could extend to Midwest and Northeast communities. Residential customers generally favor products that are portable, familiar, and easy to maintain. They also respond to visible indicators of filter life and indoor conditions. Commercial users are forecast to grow at a 9.7% CAGR through 2031. Offices, schools, healthcare facilities, and hospitality sites are incorporating air cleaning into health and operating-resilience practices.
ASHRAE 241 makes documented Infection Risk Management Modes relevant to commercial organizations seeking structured control measures. This shifts certified purification toward a formal procurement requirement in some education and healthcare settings. Industrial facilities remain a smaller but significant end-user group, especially in precision manufacturing, semiconductor fabrication, pharmaceuticals, and food processing. These settings may require HEPA or ULPA filtration that reflects cleanroom and process needs. Their spending follows construction and expansion cycles more closely than seasonal smoke events. Service models are appearing across end users, including Pyure Environment 360 and PuroAir's subscription-linked warranty approach. These arrangements turn some hardware transactions into continuing service relationships. They can also reduce churn related to one-time appliance purchases.
Geography Analysis
Western states form the most consistently active regional demand area in the US air purifier market, led by California, Oregon, Washington, Colorado, and Nevada. Wildfire smoke, elevated particle exposure, and California's strict compliance rules shape product needs in this area. California requires certification for portable and electronic in-duct devices and limits ozone emissions to 0.050 ppm. The rule makes compliance important for suppliers seeking access to a large consumer base. The American Lung Association ranked San Bernardino, Riverside, Los Angeles, Tulare, and Kern counties among the 7 most particle-polluted counties in its 2025 findings. Maricopa County in Arizona and Clark County in Nevada were also identified among the top 15 counties, extending the high-demand zone beyond California.
The Northeast and Midwest have become a faster-changing demand frontier after the 2023 Canadian wildfire smoke event. New York, Chicago, and Minneapolis combine dense housing with large populations that had less prior wildfire exposure. This supports first-time purchases and makes smart features relevant to new users. Cook County, Illinois, and Fairfield County, Connecticut, were included among the American Lung Association's most ozone-polluted places in 2025. The combination of particle exposure and urban ozone supports interest in multi-stage systems. Ameren Illinois offers an instant rebate of USD 50 for qualifying ENERGY STAR air purifiers, reducing the initial cost for eligible consumers. These programs can increase adoption where air cleaner ownership was historically lower than in the West.
The Southeast and Sunbelt have different drivers, including pollen, humid indoor conditions, and fast-growing metropolitan populations. Harris County in Houston and Tarrant and Denton counties in the Dallas-Fort Worth area ranked among the top 15 most particle-polluted counties in the 2025 American Lung Association findings. The regional burden is linked to year-round industrial and vehicle emissions rather than only seasonal wildfire smoke. Dallas-Fort Worth and Atlanta also support commercial demand through corporate real-estate sustainability activity described in the supplied draft. New housing construction creates openings for HVAC-integrated purification in this region. Modern ventilation and energy-efficiency designs can make in-duct installation easier in new homes than in older housing stock. These regional conditions support a distinct expansion path for the US air purifier market. Regional demand patterns also make product mix important for suppliers. Western buyers may prioritize fast particle removal during smoke events, while Sunbelt installations can favor HVAC integration in new construction. The Northeast and Midwest offer a different combination of urban exposure, first-time ownership, and interest in connected controls. The US air purifier market benefits when companies match these regional needs to accessible product formats and dependable filter supply.
Competitive Landscape
The US air purifier market is fragmented and a long tail of specialist and direct-to-consumer brands. Dyson, Honeywell, Coway, Blueair, and SharkNinja compete through brand recognition, retail access, and product renewal. No company was identified as holding a dominant market share. Dyson has emphasized multifunction and connected products in its premium portfolio. The company launched the HushJet Purifier Compact in September 2025 with its HushJet Nozzle design and MyDyson app integration. In September 2026, Dyson introduced additional HushJet formats, including models that combine purification with heating or cooling. This approach extends purification into multi-use home climate products.
Coway has used design recognition and efficiency certification to strengthen its residential positioning. Its Airmega Mighty2 received the iF Design Award 2026 and Red Dot Design Award 2026, according to the supplied company announcement. Coway also launched the Airmega Halo in August 2026 as an ENERGY STAR Version 3.0-certified product for medium-to-large rooms. That positioning ties product development to the revised efficiency metric. SharkNinja offers a different response to filter economics through the BreatheClear Max and its claimed 6-year routine filter-replacement interval. PuroAir and Alen use filter subscriptions and warranty incentives, creating a competing recurring-revenue approach. These strategies give consumers different choices between lower maintenance and recurring filter service. The US air purifier market also gives retailers a role in how these offers reach consumers, because product visibility and replacement-filter availability can reinforce brand selection. Blueair, Coway, Dyson, and SharkNinja use different combinations of premium design, efficiency messaging, and maintenance claims. That variety keeps the US air purifier market open to appliance brands and specialist air-quality suppliers. It also limits the ability of a single commercial approach to define the category.
Commercial air-quality services remain less established than consumer appliance channels. Pyure Environment 360 combines equipment, sensor data, energy analytics, and annual certification for commercial facilities. ASHRAE 241 creates a procurement context that can reward suppliers with early commercial experience. Commercial contracts may run for 2-4 years, increasing the value of durable supplier relationships. Connected-device suppliers also need to address privacy and cybersecurity as enterprise selection criteria. Edge processing and local data handling could reduce cloud dependency where appropriate. Competition remains open because leading brands use different product, channel, and service models. The US air purifier market has room for suppliers that can connect indoor air quality data with verified equipment performance. Product selection is likely to remain divided between portable household appliances, HVAC-integrated systems, and commercial service offerings. Each group requires a different mix of design, installation, maintenance, and documentation capability. Newer efficiency requirements add another basis for comparing products, particularly for suppliers serving retail channels. The US air purifier market can therefore support multiple competitive positions without requiring a single supplier to dominate all customer groups. Market concentration score: 3/10, because the supplied draft identifies no dominant player and provides no evidence that the top 5 suppliers collectively control at least 30% of sales.
United States Air Purifier Industry Leaders
-
Honeywell International, Inc.
-
Dyson Ltd.
-
Vesync Co., Ltd. (Arovast Corporation)
-
COWAY CO., LTD.
-
Koninklijke Philips N.V.
- *Disclaimer: Major Players sorted in no particular order
Recent Industry Developments
- August 2026: Coway launched the Airmega Halo (USD 229.99), a cylindrical, ENERGY STAR Version 3.0-certified air purifier for medium-to-large rooms, featuring 360° air intake and quiet sleep-mode operation, targeting the mid-size gap between compact and high-capacity models.
- May 2026: Coway introduced the Airmega Mighty2 (AP-1512N), the next generation of its best-selling Airmega Mighty. The product received the iF Design Award 2026 and Red Dot Design Award 2026.
- April 2026: SharkNinja launched the Shark BreatheClear Max (USD 449), a HEPA-grade unit featuring air quality sensing at 3,600 scans per hour and a proprietary filter design that eliminates routine filter replacement for up to 6 years.
- October 2025: Pyure launched a fully integrated Indoor Environmental Quality as a Service subscription platform combining hydroxyl-generation purification systems, multi-parameter sensors, energy-optimization analytics, and annual IAQ certification.
United States Air Purifier Market Report Scope
An air purifier is a household device that improves indoor air quality by removing harmful dust, smoke, and germs. The air purifier market refers to the global industry encompassing the manufacturing, distribution, and sale of devices designed to improve indoor air quality by removing pollutants, allergens, and harmful contaminants.
The United States air purifier market is segmented into filtration technology, type, connectivity, and end-user. By filtration technology, the market is divided among High Efficiency Particulate Air (HEPA), activated carbon, ionic/electrostatic precipitators, UV-C and photocatalytic oxidation, hybrid, and multi-stage systems. By type, the market is segmented into stand-alone/portable and in-duct/central HVAC. By connectivity, the market is segmented into non-smart (manual/analog) and smart/IoT-enabled (app and voice controlled). By end-user, the market is segmented into residential, commercial, and industrial. For each segment, the market sizing and forecasts have been provided on the basis of value (USD).
| High Efficiency Particulate Air (HEPA) |
| Activated Carbon |
| Ionic/Electrostatic Precipitators |
| UV-Cand Photocatalytic Oxidation |
| Hybrid and Multi-stage Systems |
| Stand-alone/Portable |
| In-duct/Central HVAC |
| Non-Smart (Manual/Analog) |
| Smart/IoT-Enabled (App and Voice Controlled) |
| Residential |
| Commercial |
| Industrial |
| By Filtration Technology | High Efficiency Particulate Air (HEPA) |
| Activated Carbon | |
| Ionic/Electrostatic Precipitators | |
| UV-Cand Photocatalytic Oxidation | |
| Hybrid and Multi-stage Systems | |
| By Type | Stand-alone/Portable |
| In-duct/Central HVAC | |
| By Connectivity | Non-Smart (Manual/Analog) |
| Smart/IoT-Enabled (App and Voice Controlled) | |
| By End User | Residential |
| Commercial | |
| Industrial |
Key Questions Answered in the Report
What is the forecast growth rate for US air purifiers?
The category is forecast to grow at a 7.43% CAGR from 2026 to 2031, reaching USD 7.51 billion by 2031.
Why are air purifiers becoming more important in the United States?
Particle pollution, ozone exposure, wildfire smoke, and greater attention to indoor conditions are expanding household and commercial demand.
Which filtration technology has the largest position?
HEPA held 50.6% share in 2025, while activated carbon is the fastest-growing filtration type at an 8.1% CAGR through 2031.
Are smart air purifiers growing faster than manual models?
Yes. Smart and IoT-enabled devices are forecast to grow at an 11.2% CAGR through 2031, although non-smart units held 85.8% share in 2025.
Which end users are increasing purchases most quickly?
Commercial users are forecast to grow at a 9.7% CAGR through 2031 as offices, schools, healthcare facilities, and hospitality sites invest in indoor air quality.
What rules affect air cleaner product design?
California ozone limits, ENERGY STAR Version 3.0, Department of Energy standards, and ASHRAE 241 shape equipment efficiency, emissions, and commercial procurement requirements.