Market Overview
| Study Period | 2020 - 2031 |
|---|---|
| Forecast Data Period | 2026 - 2031 |
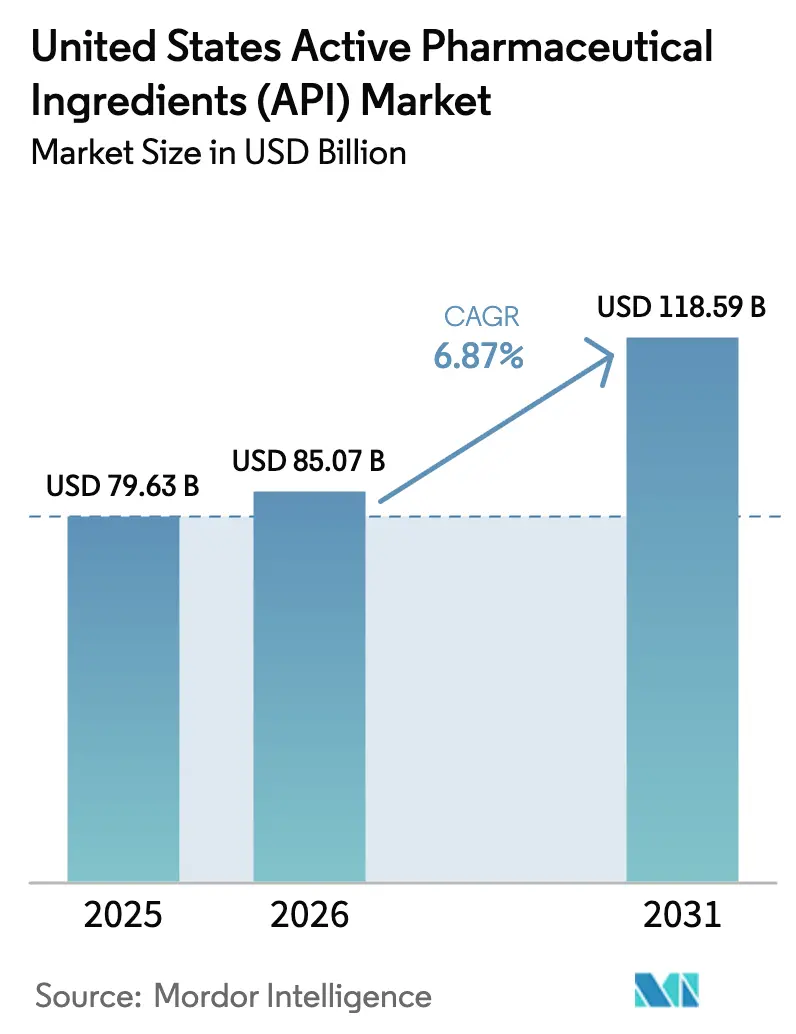
| Base Year Market Size (2025) | USD 79.63 Billion |
| Market Size (2026) | USD 85.07 Billion |
| Market Size (2031) | USD 118.59 Billion |
| Growth Rate (2026 - 2031) | 6.87% CAGR |
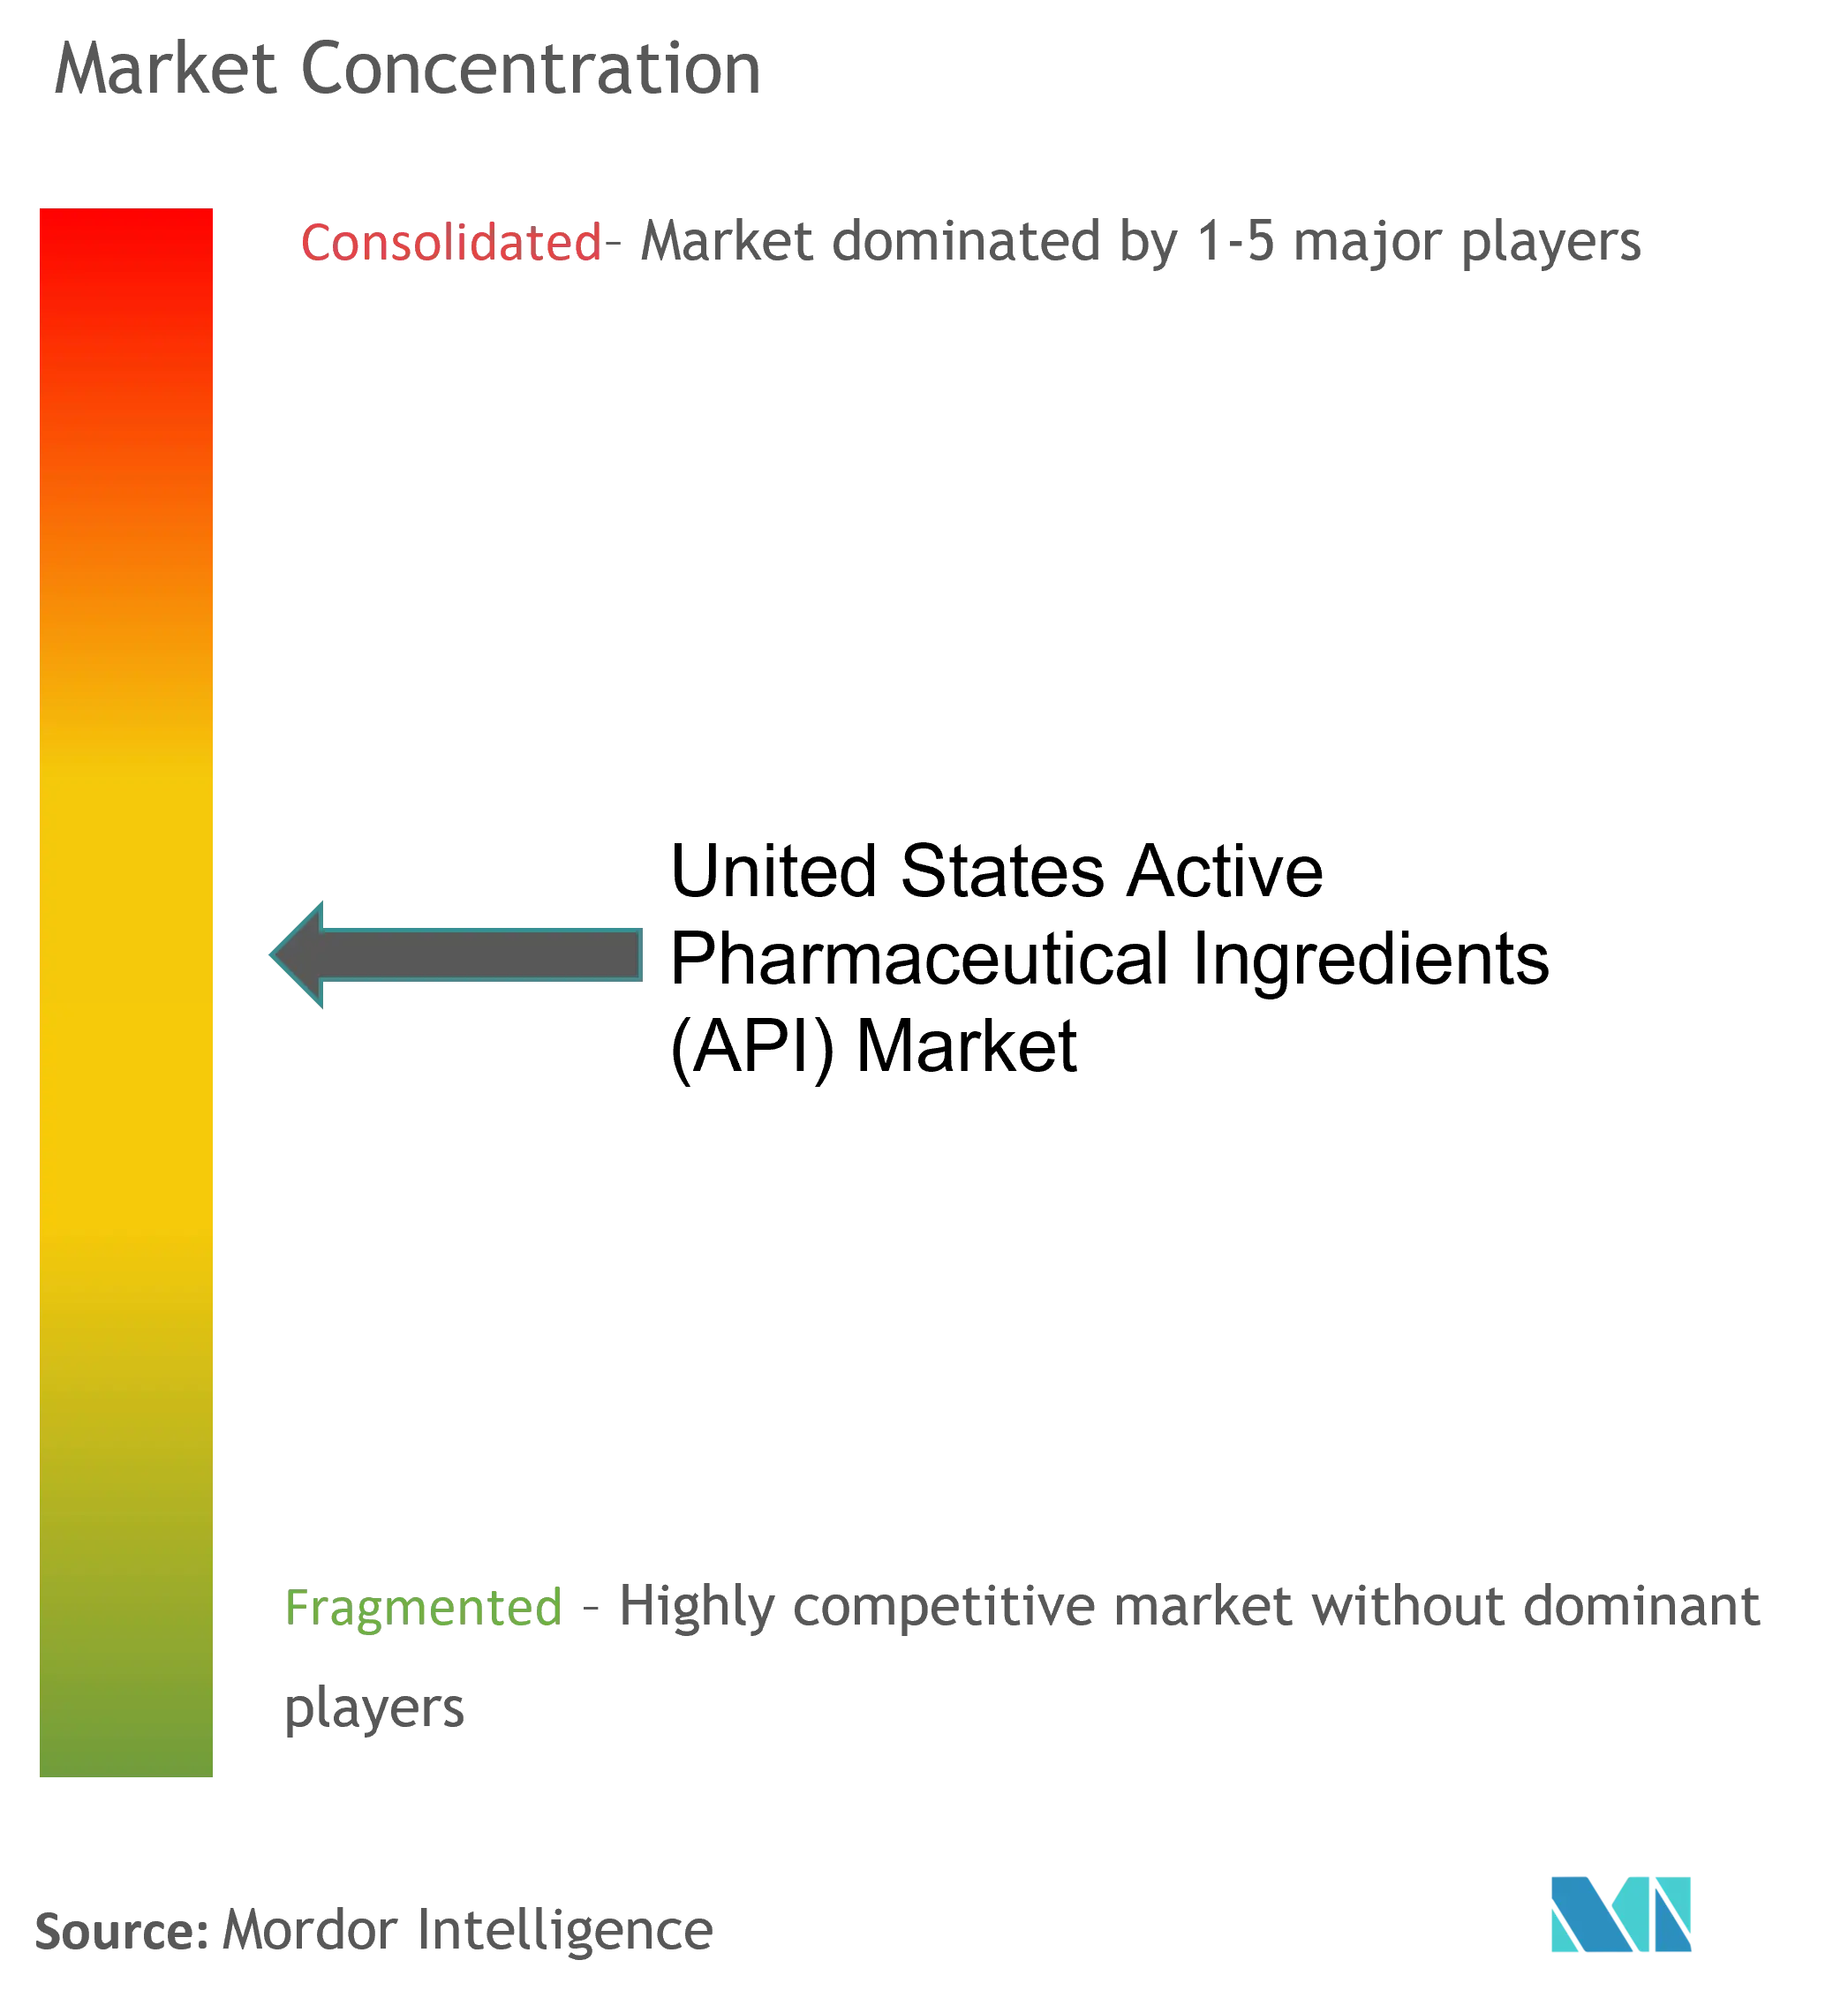
| Market Concentration | Medium |
Major Players *Disclaimer: Major Players sorted in no particular order Image © Mordor Intelligence. Reuse requires attribution under CC BY 4.0. | |
United States Active Pharmaceutical Ingredients (API) Market Analysis by Mordor Intelligence
The United States Active Pharmaceutical Ingredients Market size was valued at USD 79.63 billion in 2025 and is estimated to grow from USD 85.07 billion in 2026 to reach USD 118.59 billion by 2031, at a CAGR of 6.87% during the forecast period (2026-2031).
Federal incentives that lower the after-tax cost of advanced reactors, plus the BIOSECURE Act’s pending restrictions on Chinese suppliers, are reshaping plant-location economics and lifting domestic capacity announcements. Merchant CDMOs are benefiting most because virtual pharma companies prefer asset-light models that avoid large capital outlays. At the same time, the Inflation Reduction Act’s Medicare price negotiations are compressing margins for mature small-molecule APIs and redirecting investment toward high-potency oncology and GLP-1 metabolic lines. Supply-chain resilience is now a pricing lever, so U.S. sites that can certify uninterrupted operation and rapid regulatory engagement command premiums over lower-cost Asian alternatives.
Key Report Takeaways
- By business mode, merchant suppliers captured 64.58% of revenue in 2025 while captive operations trailed; merchant revenue is projected to expand at a 7.05% CAGR through 2031.
- By synthesis type, synthetic APIs retained 70.88% share in 2025, whereas biotech APIs are advancing at a 7.14% CAGR to 2031.
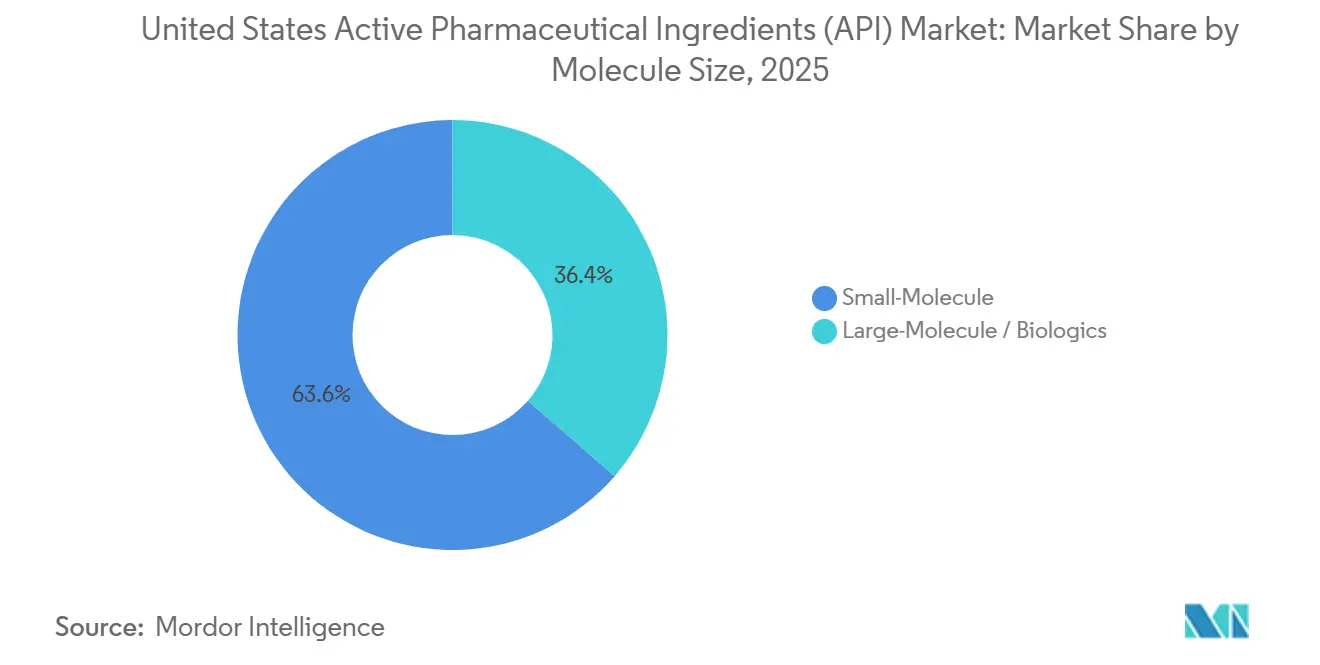
- By molecule size, small molecules held 63.65% share in 2025, yet large molecules are forecast to post the fastest 7.51% CAGR through 2031.
- By potency, low- and medium-potency APIs represented 80.11% of the United States Active Pharmaceutical Ingredients market size in 2025, while high-potency APIs are growing at 8.32% CAGR.
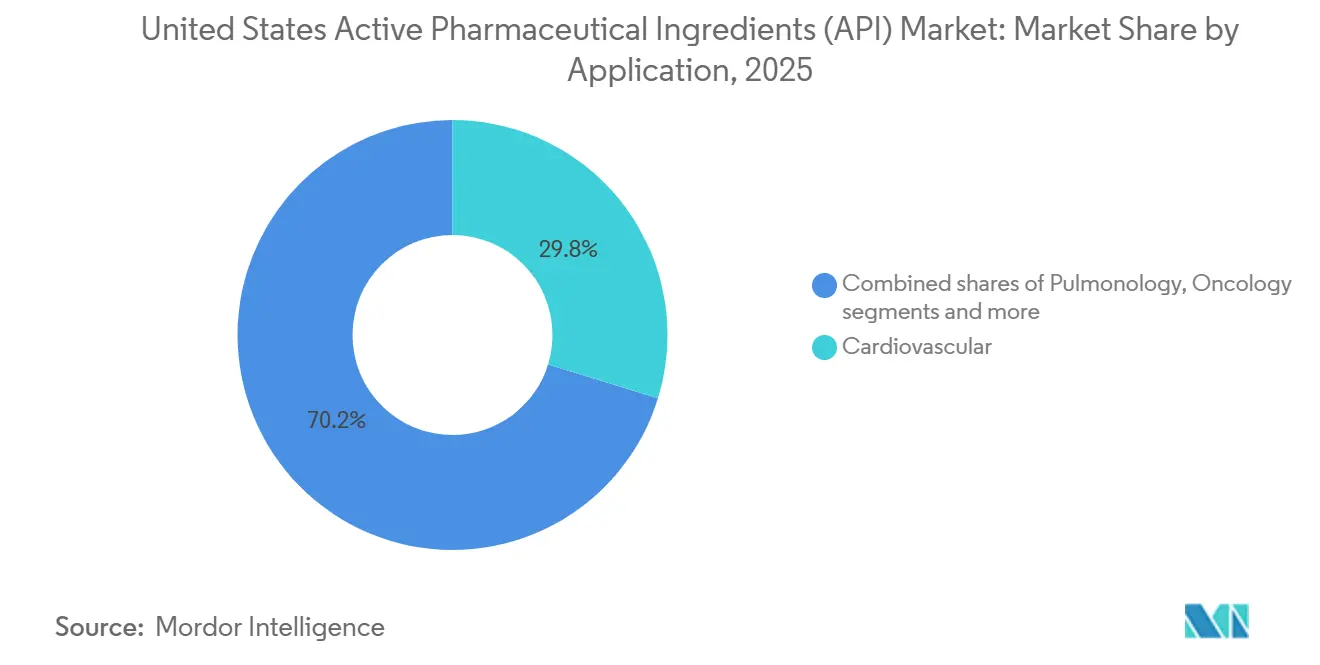
- By application, cardiovascular APIs led with 29.76% of the United States active pharmaceutical ingredients market share in 2025, yet oncology APIs are advancing at an 8.76% CAGR through 2031.
- By end-user, pharmaceutical companies held 49.23% share in 2025, yet CRO and CDMO are forecast to post the fastest 8.11% CAGR through 2031.
Note: Market size and forecast figures in this report are generated using Mordor Intelligence’s proprietary estimation framework, updated with the latest available data and insights as of 2026.
United States Active Pharmaceutical Ingredients (API) Market Trends and Insights
Driver Impact Analysis*
| Driver | (~) Impact on CAGR | Geographic Focus | Timeline |
|---|---|---|---|
| Federal and state incentives that favor U.S-based API lines | +1.2% | Boston-Cambridge, Research Triangle Park, San Francisco Bay Area, New Jersey | Medium term (2-4 years) |
| Expansion of biologic and mRNA pipelines | +1.5% | Massachusetts, North Carolina, California; spillover into South Carolina and Indiana | Long term (≥ 4 years) |
| BARDA and Strategic National Stockpile funding for surge capacity | +0.8% | Nationwide, with priority sites tied to federal contracts | Short term (≤ 2 years) |
| Growing oncology demand for high-potency APIs | +1.3% | New Jersey, Pennsylvania, New York; emerging builds in North Carolina | Long term (≥ 4 years) |
| Early adoption of continuous manufacturing technologies | +0.9% | Michigan, Indiana, Massachusetts; FDA Emerging Technology Program sites | Medium term (2-4 years) |
| Outsourcing wave among virtual pharma companies | +1.1% | Boston-Cambridge, Research Triangle Park, San Francisco Bay Area | Medium term (2-4 years) |
| Source: Mordor Intelligence | |||
Diversifying U.S. Supply-Chain Incentives for Domestic API Manufacturing
Congressional momentum behind the BIOSECURE Act is forcing pharmaceutical buyers to audit Chinese exposure and shift contracts to domestic plants. Curia, Cambrex, and Amgen have each committed more than USD 100 million to onshore capacity that was previously in Asia. The CHIPS and Science Act extends tax credits to pharmaceutical process equipment, cutting reactor capital costs significantly and narrowing the cost gap with offshore batch assets [1]U.S. Department of Commerce, “Advanced Manufacturing Tax Credits,” commerce.gov Restraints. States add further support; North Carolina co-financed Amgen’s USD 1 billion biologics campus, while Massachusetts fast-tracks GMP permits that meet ISO 14001 standards. All told, stacked incentives bring total-cost-of-ownership below offshore equivalents for molecules that exceed 500 kilograms of annual demand.
Surge in Advanced Biologics & mRNA Therapy Pipelines
Biologics and mRNA therapies accounted for 47% of FDA new molecular entity approvals in 2025, up from 38% in 2020 [2]U.S. Department of Commerce, “Advanced Manufacturing Tax Credits,” commerce.gov Restraints. Moderna’s USD 1.8 billion three-site U.S. build-out halves mRNA batch cycle time from 14 to seven days, giving the firm spare capacity for contract runs. Lonza, Fujifilm, and Thermo Fisher have installed 20,000-liter mammalian bioreactors that target oncology antibodies and autoimmune biologics. Bispecific antibodies and antibody-drug conjugates demand containment at OEB 4-5 levels, a niche where Catalent’s Somerset plant and Lonza’s Visp site hold leadership. These builds tighten domestic supply and shorten time-to-clinic for sponsors seeking rapid first-in-human studies.
Federal Funding for Pandemic-Preparedness Stockpiles
BARDA allocated USD 1.5 billion in 2024-2025 to distribute API nodes that can pivot from one molecule to the next in under six months. The program favors single-use bioreactors that eliminate campaign cleaning, an approach Emergent BioSolutions and Phlow are using to satisfy Strategic National Stockpile mandates for 12 critical molecules. Continuous-flow synthesis and real-time release testing lower unit cost by up to 40% while delivering full U.S. traceability. PREVENT Pandemics Act compliance is now a purchasing prerequisite for federal tenders, creating a protected revenue stream for qualified sites.
Growing Demand for High-Potency APIs From Oncology Boom
FDA cleared 18 novel cancer drugs in 2025, the highest annual total to date. High-potency APIs require glove-box isolators and negative-pressure rooms that can cost USD 50-100 million per 500-kilogram line. Curia added three OEB 5 reactors in 2025 to supply monomethyl auristatin E and duocarmycin analogs that sell for more than USD 100,000 per kilogram. Eli Lilly’s USD 3.2 billion Indiana complex will satisfy its Loxo Oncology portfolio and buffer supply risk for assets projected to exceed USD 1 billion in peak annual revenue. Catalent and Patheon have deployed controlled micro-dose platforms that micronize potent APIs to below 10 microns, ensuring dose uniformity in oral formulations.
Restraints Impact Analysis*
| Restraint | (~) Impact on CAGR | Geographic Focus | Timeline |
|---|---|---|---|
| Medicare drug-price negotiations squeezing mature small molecules | -0.9% | Nationwide, acute for generic API makers | Short term (≤ 2 years) |
| Rising environmental-compliance costs at aging plants | -0.6% | Gulf Coast, Mid-Atlantic, Midwest legacy corridors | Medium term (2-4 years) |
| Shortage of skilled process chemists and engineers | -0.5% | Most severe in high-cost coastal hubs (Boston, San Francisco, New Jersey) | Medium term (2-4 years) |
| Ongoing price pressure from low-cost Indian and Chinese suppliers | -0.7% | Nationwide, heaviest on commodity small-molecule and low-potency lines | Long term (≥ 4 years) |
| Source: Mordor Intelligence | |||
Price Erosion From Medicare Drug-Price Negotiations
Ten high-spend drugs saw list-price cuts of significant amounts in 2024, and 15 more entered the 2025 cycle, trimming contract prices for their small-molecule APIs. The Congressional Budget Office projects a USD 25 billion annual revenue hit by 2031, with generic API suppliers taking the brunt because they lack downstream pricing power. Teva reported a 12% drop in its U.S. API segment during 2025 and shuttered three low-margin lines. CDMOs have responded by raising minimum order quantities and adding raw-material surcharges indexed to solvent prices, shifting some risk back to drug sponsors. The result is a two-tier market where commodity molecules lose pricing power while novel modalities retain premium margins.
Environmental Compliance Costs for U.S. API Plants
EPA limits on PFAS discharges and tighter volatile-organic standards require advanced oxidation systems and continuous emission monitors that cost USD 5-20 million per outlet [3]U.S. Environmental Protection Agency, “PFAS Discharge Final Rule,” epa.gov Segment Analysis. Mallinckrodt closed its St. Louis API plant in 2025, citing compliance costs that were uneconomic at its scale. ISO 14001 certification now functions as a pharmaceutical buyer prerequisite, adding as much as USD 500,000 in annual audit expense. Smaller operators spend up to 12% of revenue on environmental capex versus 3-5% for larger peers, reinforcing economies of scale. States with faster permitting, such as North Carolina and Indiana, are winning greenfield projects while older Gulf Coast assets face costly retrofits.
*Our forecasts treat driver/restraint impacts as directional, not additive. The impact forecasts reflect baseline growth, mix effects, and variable interactions.
Segment Analysis
By Business Mode: Merchant Suppliers Outpace Captive Plants
Merchant CDMOs generated 64.58% of 2025 revenue and are forecast to grow at 7.05% through 2031, reflecting their ability to spread fixed costs across multiple sponsors. Continuous-manufacturing penetration reaches six lines at Thermo Fisher’s Greenville site versus an industry average of 1.2 lines, letting CDMOs cut cycle time and waste for diverse customers. Captive plants still dominate blockbuster franchises where originators demand supply assurance; Pfizer produces nirmatrelvir API internally to keep pace with emergency surges. However, an industry benchmark shows merchant plants run at 78% average utilization while captive sites languish at 62%, driving new investment toward CDMOs. Continuous upgrades, end-to-end offerings, and speed-to-clinic advantages keep the United States active pharmaceutical ingredients market tilted in favor of merchant players.
Generalist CDMOs co-invest in novel modalities that require capital beyond many biotechs’ reach, which further cements merchant leadership. Lonza’s USD 1 billion Portsmouth build was co-financed by clients that locked in long-term volume, a model spreading across the United States active pharmaceutical ingredients market. Captive operations remain viable when internal volume is stable and intellectual property is highly sensitive, yet even large originators are outsourcing development-scale lots to access specialized containment or biologics suites.


By Synthesis Type: Biotech Growth Accelerates
Synthetic routes still deliver 70.88% of 2025 revenue, but biotech-derived APIs are growing at 7.14% on the back of monoclonal antibody and mRNA approvals. Synthetic manufacturers defend share by focusing on chiral intermediates and controlled substances that carry regulatory moats. Cambrex invested USD 300 million in an Iowa site for DEA Schedule II APIs, shielding that revenue from low-cost Asian competition. Biotech APIs demand 10,000-liter reactors, multicolumn chromatography, and viral-clearance validation that extends tech-transfer timelines. Fujifilm’s North Carolina build added 80,000 liters of mammalian capacity to keep pace with oncology antibodies. These complex requirements sustain pricing and reinforce growth for biotech lines within the United States active pharmaceutical ingredients market.
Continuous manufacturing is more advanced on the synthetic side because flow chemistry adapts readily to small molecules. Vertex cut solvent use 30% when it moved ivacaftor and lumacaftor to continuous processing, a performance that synthetic peers now emulate. FDA’s ICH Q13 guideline harmonizes review pathways for continuous manufacturing across both chemistries, encouraging more hybrid facilities that host both batch biologics and flow-based small molecules. Synthetic incumbents retain volume leadership, yet biotech’s growth trajectory is reshaping capital allocation.
By Molecule Size: Biologics Lead Growth Curve
Small-molecule APIs provided 63.65% of 2025 revenue thanks to a vast installed base and chronic-disease prevalence. However, large-molecule biologics post a 7.51% CAGR as sponsors gravitate toward modalities with patent durability and premium pricing. Amgen’s USD 1 billion North Carolina campus houses more than 100,000 liters of bioreactor volume dedicated to monoclonal antibodies. Biologics require cold-chain handling that adds USD 200-500 per kilogram in logistics cost, yet their net margins remain superior to off-patent small molecules. The United States active pharmaceutical ingredients market size for biologics is therefore expanding faster than for synthetic compounds.
CDMOs are merging to gain both chemistries. Cambrex bought a biologics plant, while Fujifilm backward-integrated into plasmid DNA to control viral-vector inputs. Biosimilar competition will test biologic margins, but process complexity and regulatory hurdles still protect leading manufacturers. Small-molecule providers are moving upscale into complex kinase inhibitors that resist price erosion, keeping the United States active pharmaceutical ingredients market balanced but growth-weighted toward large molecules.
By Potency: HPAPIs Gain Share
High-potency lines represented 19.89% of the United States active pharmaceutical ingredients market volume in 2025 and are advancing at 8.32% through 2031. Oncology’s 8.76% application CAGR is the main driver because targeted therapies reach efficacy at sub-milligram doses. Curia’s new OEB 5 reactors deliver payloads such as monomethyl auristatin E, priced above USD 100,000 per kilogram.
Low- and medium-potency APIs face commodity dynamics, with atorvastatin API dropping below USD 40 per kilogram under Medicare price pressure. Continuous manufacturing is easier for low-potency products since containment requirements are modest, so Pfizer runs a flow line for nirmatrelvir at its Kalamazoo plant. HPAPI suppliers are experimenting with single-use gear to minimise cleaning downtime, reducing campaign changeover from four weeks to 10 days, a gain that further propels growth.
By Application: Oncology Overtakes Cardiovascular
Cardiovascular APIs retained 29.76% of 2025 revenue but are growing slowly because statins and anticoagulants face generic saturation. Oncology expands at 8.76%, fueled by 18 FDA approvals in 2025 and a 1,200-molecule late-stage pipeline. This shift reallocates capital toward HPAPI containment and biologics infrastructure. Bristol-Myers Squibb paid USD 4.1 billion for Mirati to secure adagrasib, then internalized its API at Summit, New Jersey to accelerate scale-up.
Cardiovascular manufacturers are exiting commodity lines and repositioning toward specialty areas such as PCSK9 inhibitors, which still command premium pricing. Oncology’s premium margins ensure it will remain the fastest-growing slice of the United States active pharmaceutical ingredients market.

By End-User: CRO and CDMO Surge Reshapes Procurement
CROs and CDMOs are becoming the dominant buyers of U.S. APIs, with their purchases rising at an 8.11% CAGR through 2031, as virtual pharma and venture-backed biotechs now 42% of clinical pipelines outsource everything they make. Pharmaceutical companies still held 49.23% of 2025 volume because firms such as Pfizer, Eli Lilly, and Merck keep internal plants for blockbuster products, yet even they now send early-stage or non-core projects outside to trim capital needs. Risk-sharing deals sweeten the shift: Lonza’s USD 1 billion Portsmouth build was partly funded by customers that locked in offtake commitments. Academic labs, government centers, and diagnostic firms form a smaller but steady “other” tier, supported by NIH grants and BARDA’s USD 1.5 billion pandemic-preparedness program. Pricing mirrors the split—big pharma secures cost-plus terms at 5-8% margins, while CDMO clients pay 15-20% premiums for faster timelines and regulatory agility.
Geography Analysis
New England and New Jersey host the densest cluster of biologics and HPAPI capacity, anchored by Lonza’s Portsmouth plant, Catalent’s Somerset facility, and BMS’s Summit campus. Proximity to academic centers supplies talent, and FDA field offices expedite inspections. Massachusetts clears GMP expansions in 120 days versus a national average of 180, a policy that speeds time-to-market.
The Southeast triangle, Research Triangle Park, South Carolina’s Upstate, and Georgia’s biotech corridor, offer the fastest build timelines. Fujifilm’s USD 2 billion Holly Springs project and Amgen’s USD 1 billion campus came online in 2025, benefitting from a 180-day environmental review cycle. Thermo Fisher added six continuous API lines in Greenville, South Carolina, lured by lower wage costs than in Boston.
The Midwest keeps relevance through integrated originators. Eli Lilly’s USD 3.2 billion Indiana complex and Pfizer’s Kalamazoo flow lines anchor the region, which enjoys lower construction costs than coastal zones. Yet many sites date to the 1950s and face multi-million-dollar retrofits to meet EPA standards, tilting new investment southward.
Competitive Landscape
The top ten companies hold significant revenue, so the United States active pharmaceutical ingredients market is moderately fragmented. Integrated originators such as Pfizer and Eli Lilly keep captive capacity for blockbuster drugs, while CDMOs like Catalent, Lonza, Thermo Fisher, and Fujifilm compete on speed and regulatory pedigree. Catalent’s USD 16.5 billion sale to Novo Nordisk shows the premium placed on end-to-end platforms. Economies of scale now hinge on continuous manufacturing. Fewer than 15 U.S. lines operate at a commercial scale, making early adopters attractive partners for virtual biotech firms.
Emerging enzymatic routes from Codexis illustrate the next frontier, promising solvent reductions and faster development. Competitive intensity is highest in commodity small-molecule APIs where Indian and Chinese firms enjoy 30-50% cost advantages; U.S. players, therefore, pivot toward biologics, HPAPIs, and continuous-flow processes that support premium pricing.
United States Active Pharmaceutical Ingredients (API) Industry Leaders
Pfizer Inc.
Novartis AG
Viatris Inc.
Teva Pharmaceutical Industries Ltd
Eli Lilly and Company
- *Disclaimer: Major Players sorted in no particular order

Recent Industry Developments
- August 2025: FDA launched the PreCheck program that streamlines facility planning and quality-control engagement to accelerate domestic drug manufacturing.
- March 2025: Fujifilm Diosynth completed its USD 2 billion Holly Springs build, adding four mammalian suites that total 80,000 liters.
- February 2025: Eli Lilly finished a USD 3.2 billion Indiana expansion that adds continuous-flow capacity for GLP-1 APIs


United States Active Pharmaceutical Ingredients (API) Market Report Scope
An Active Pharmaceutical Ingredient (API) is a part of any drug that produces its effects. Some drugs, such as combination therapies, have multiple active ingredients to treat different symptoms or act in different ways. They are produced using highly technological industrial processes during research and development and the commercial production phase.
The United States active pharmaceutical ingredients market is segmented by business mode, synthesis type, molecule size, potency, application, and end users. By business mode, the market is segmented into captive API and merchant API. By synthesis type, the market is segmented into synthetic and biotech. By molecule size, it is categorized into small-molecule and large-molecule / biologics. Regarding potency, the market is divided into high-potency APIs (HPAPI) and low/medium-potency APIs. By application, the market is segmented into cardiology, pulmonology, oncology, ophthalmology, neurology, orthopedic, and other applications. Finally, by end users, the market is segmented into pharmaceutical companies, CRO and CDMO, and others. For each segment, the market size and forecast are provided in terms of value (USD).
By Business Mode
| Captive API |
| Merchant API |
By Synthesis Type
| Synthetic |
| Biotech |
By Molecule Size
| Small-Molecule |
| Large-Molecule / Biologics |
By Potency
| High-Potency APIs (HPAPI) |
| Low/Medium-Potency APIs |
By Application
| Cardiology |
| Pulmonology |
| Oncology |
| Ophthalmology |
| Neurology |
| Orthopedic |
| Other Applications |
By End Users
| Pharmaceutical Companies |
| CRO and CDMO |
| Others |
| By Business Mode | Captive API |
| Merchant API | |
| By Synthesis Type | Synthetic |
| Biotech | |
| By Molecule Size | Small-Molecule |
| Large-Molecule / Biologics | |
| By Potency | High-Potency APIs (HPAPI) |
| Low/Medium-Potency APIs | |
| By Application | Cardiology |
| Pulmonology | |
| Oncology | |
| Ophthalmology | |
| Neurology | |
| Orthopedic | |
| Other Applications | |
| By End Users | Pharmaceutical Companies |
| CRO and CDMO | |
| Others |


Key Questions Answered in the Report
How fast is domestic API production growing in the United States?
Revenue is expected to expand at a 6.87% CAGR between 2026 and 2031 as reshoring incentives and biologics demand lift capacity.
Which segment leads revenue within U.S. API supply?
Merchant CDMOs hold 64.58% of revenue because virtual pharma companies favor outsourcing.
Why are high-potency APIs gaining share?
Oncology pipelines require sub-milligram doses, and specialized containment protects margins, driving an 8.32% growth rate through 2031.
What impact does Medicare price negotiation have on API suppliers?
Price cuts on branded drugs reduce small-molecule API contract prices by 15-25% and force generic makers to absorb cost inflation.
Which U.S. regions attract the most API investment?
New England and New Jersey dominate biologics and HPAPI builds, while the Southeast triangle wins greenfield projects due to faster permitting and lower labor costs
Page last updated on:


