High Potency APIs Market Size and Share
Market Overview
| Study Period | 2020 - 2031 |
|---|---|
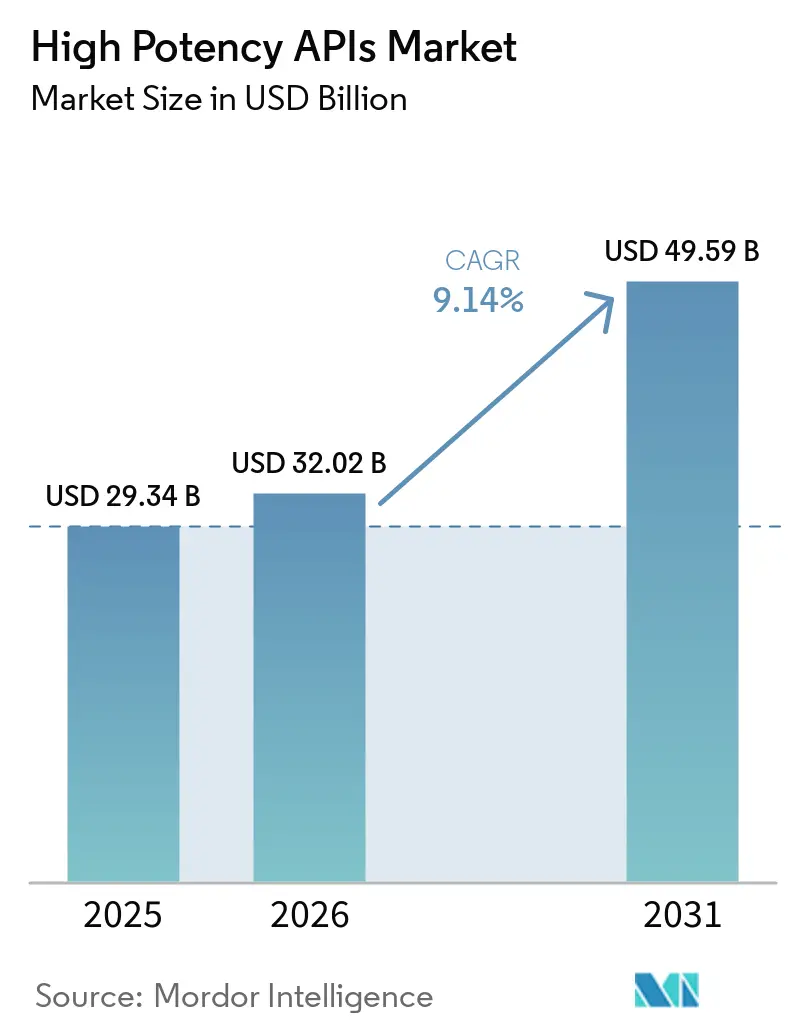
| Market Size (2026) | USD 32.02 Billion |
| Market Size (2031) | USD 49.59 Billion |
| Growth Rate (2026 - 2031) | 9.14% CAGR |
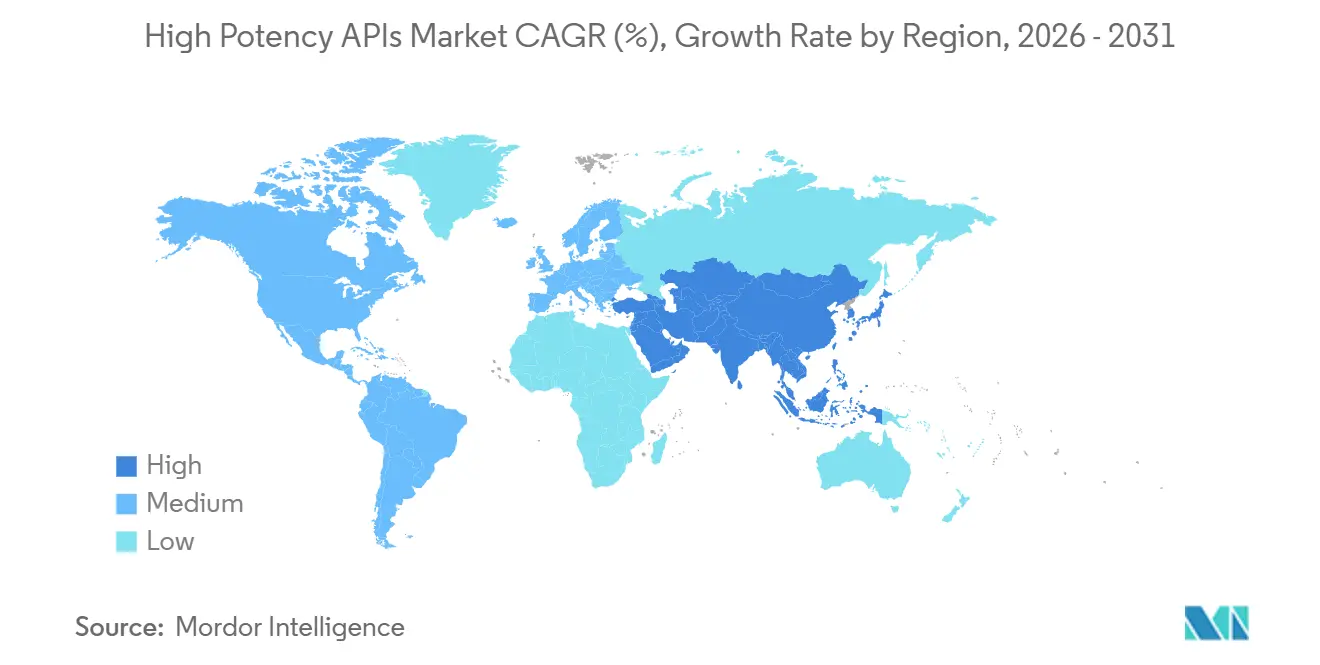
| Fastest Growing Market | Asia-Pacific |
| Largest Market | North America |
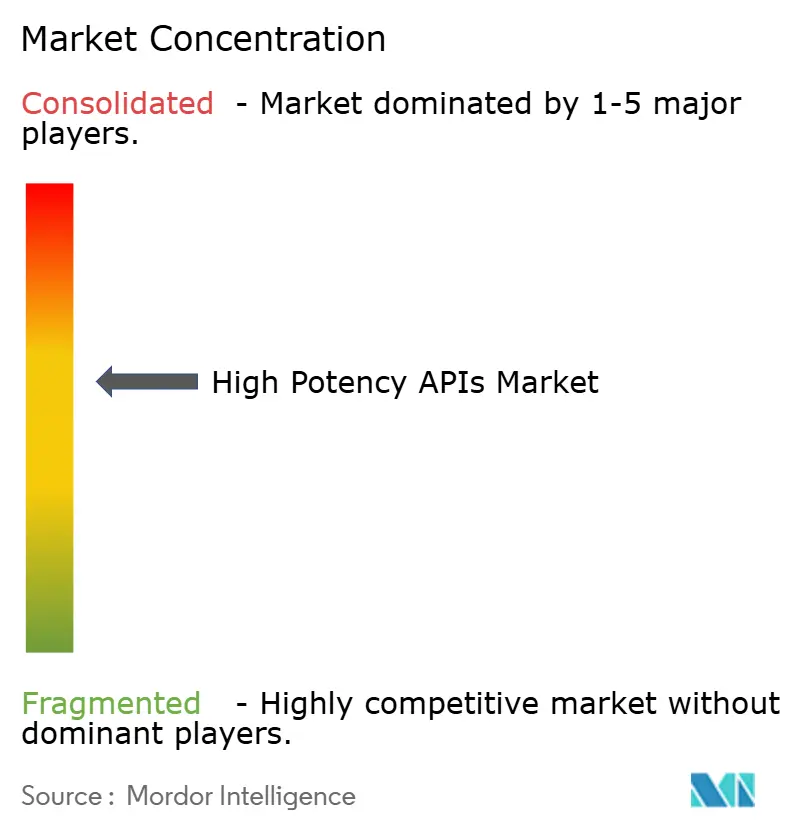
| Market Concentration | Medium |
Major Players *Disclaimer: Major Players sorted in no particular order Image © Mordor Intelligence. Reuse requires attribution under CC BY 4.0. | |
High Potency APIs Market Analysis by Mordor Intelligence
The High Potency APIs Market size is projected to be USD 29.34 billion in 2025, USD 32.02 billion in 2026, and reach USD 49.59 billion by 2031, growing at a CAGR of 9.14% from 2026 to 2031.
Ongoing therapeutic shifts toward precision medicine, the elevated proportion of highly potent compounds in development pipelines, and expanding CDMO capacity investments collectively underpin sustained demand. Supply-chain realignment prompted by the BIOSECURE Act accelerates reshoring projects in North America even as India and select Asia-Pacific hubs gain traction as alternative sourcing bases. Oncology continues to dominate applications, while ophthalmology and metabolic disorders add incremental growth avenues that diversify revenue streams away from a single therapeutic pillar. Across the value chain, sophisticated containment infrastructure, modular facility design, and digitized occupational-safety controls emerge as decisive competitive variables that raise the entry barrier for new participants.
Key Report Takeaways
- By application, oncology led with 72.53% of high potency APIs market share in 2025, whereas glaucoma treatments are projected to register the fastest 12.61% CAGR through 2031.
- By manufacturer type, captive operations controlled 54.83% of 2025 revenues, yet merchant manufacturers are forecast to climb at 12.28% CAGR as outsourcing intensifies.
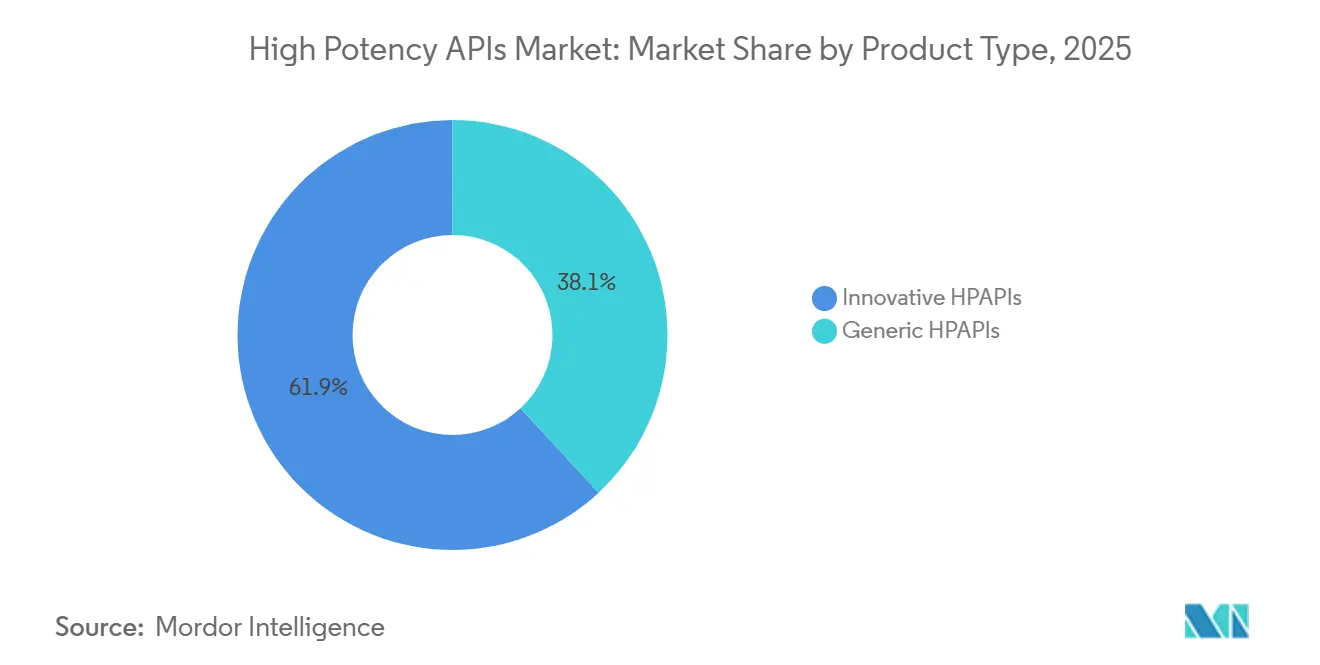
- By product type, innovative HPAPIs commanded 61.89% of 2025 revenue, while generic counterparts are projected to accelerate at 11.18% CAGR on the back of patent expirations.
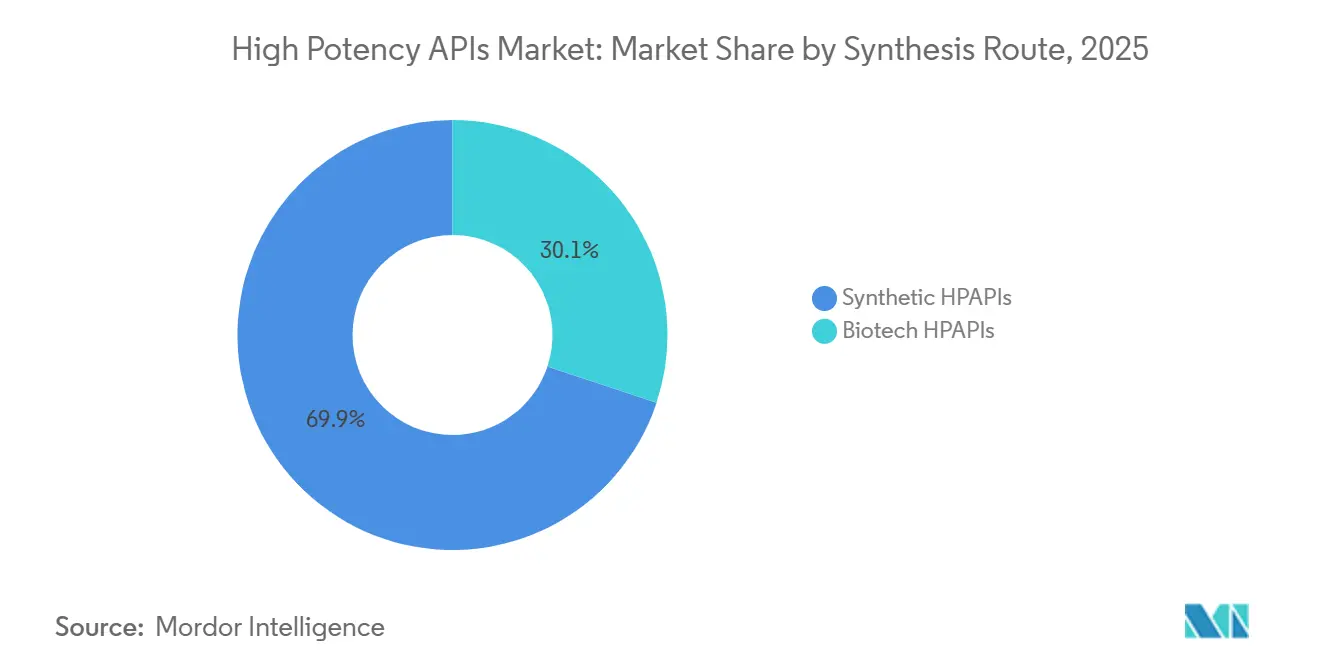
- By synthesis route, synthetic compounds retained 69.94% revenue share in 2025, whereas biotech HPAPIs are set to grow at 11.39% CAGR given peptide and ADC pipeline momentum.
- By geography, North America accounted for 39.62% revenue in 2025, while Asia-Pacific is poised to expand at a 10.32% CAGR through 2031, led by India’s CDMO investments.
Note: Market size and forecast figures in this report are generated using Mordor Intelligence’s proprietary estimation framework, updated with the latest available data and insights as of January 2026.
Global High Potency APIs Market Trends and Insights
Driver Impact Analysis*
| Driver | (~) % Impact on CAGR Forecast | Geographic Relevance | Impact Timeline |
|---|---|---|---|
| Increasing Prevalence Of Chronic And Oncologic Diseases | +2.8% | Global – North America & Europe concentration | Long term (≥ 4 years) |
| Growing Biopharmaceutical R&D Investments | +2.1% | North America & EU, expanding to APAC | Medium term (2-4 years) |
| Expansion Of Contract Development And Manufacturing Organizations | +1.9% | APAC core, spill-over to North America | Medium term (2-4 years) |
| Rising Demand For Targeted And Personalized Therapies | +1.7% | Global, led by developed markets | Long term (≥ 4 years) |
| Technological Advancements In High-Containment Manufacturing | +1.2% | North America & EU, technology transfer to APAC | Short term (≤ 2 years) |
| Government Incentives And Reshoring Initiatives For Domestic API Production | +0.8% | North America & EU, selective APAC markets | Medium term (2-4 years) |
| Source: Mordor Intelligence | |||
Increasing Prevalence of Chronic and Oncologic Diseases
Cancer-related APIs already constitute 73.23% of overall demand, and 28% of FDA new molecular entity approvals in 2024 fell into the highly potent category. Emerging metabolic-disorder blockbusters such as semaglutide generated USD 138.90 million in 2024 sales, demonstrating commercial traction beyond oncology.[1]Nature, “Semaglutide Commercial Performance,” nature.com Cytotoxic payloads within antibody-drug conjugates require occupational exposure limits below 10 µg/m³, thereby mandating high-containment installations that smaller plants cannot support. An aging global population further increases chronic-disease prevalence and extends therapy durations, lifting baseline API volumes. Accelerated-approval pathways compress development cycles, compelling sponsors to secure capable manufacturing slots early in clinical planning.
Expansion of Contract Development and Manufacturing Organizations
The global CDMO segment is projected to grow, propelled by sponsors’ preference to externalize high-risk processes. Smaller biotech firms lacking internal containment infrastructure now represent a majority of HPAPI outsourcing volume, deepening order books for service providers. The BIOSECURE Act obliges US firms to sever Chinese CDMO links by 2032, directing fresh mandates toward Indian and European vendors; Indian outfits such as Aurigene and Aragen Life Science reported double-digit inquiry spikes in 2024. Specialized CDMOs must therefore scale cytotoxic suites, continuous-flow units, and occupational-hygiene labs in parallel. Lonza has reorganized into three divisions, including a dedicated Specialized Modalities arm, to align resources with this trajectory.
Rising Demand for Targeted and Personalized Therapies
Precision-medicine models necessitate APIs active at nanogram dosages, intensifying the relevance of stringent exposure controls. Antibody-drug conjugates epitomize this shift, marrying synthetic cytotoxins with biologic antibodies for cell-specific action while curbing systemic toxicity. FDA approvals such as lifileucel for advanced melanoma validate personalized therapy pathways that require facility flexibility and rapid turnaround. Cell- and gene-therapy developers like Iovance operate dedicated plants engineered for single-patient batch flows, illustrating extreme end-point containment. Companion diagnostics bundled with high-potency treatments tighten manufacturing-diagnostic integration, incentivizing co-location of API and kit production for time-to-market gains.
Technological Advancements in High-Containment Manufacturing
North American and European plants increasingly adopt closed transfer systems, single-use isolators, and continuous-flow reactors that boost operator safety while trimming cycle time. Digital twins map airborne particulate dynamics, refining HVAC zoning and reducing validation re-work. Technology transfers to select APAC facilities are underway through licensed packages, facilitating multi-regional launch strategies without compromising containment integrity. Vendors such as Eli Lilly and CordenPharma have deployed advanced inline particle counters and automated charging systems in their 2024-2025 expansions, trimming cleanroom downtimes by 18%.
Restraints Impact Analysis*
| Restraints Impact Analysis | (~) % Impact on CAGR Forecast | Geographic Relevance |
|---|---|---|
| High Capital And Operational Expenditure Requirements | -1.8% | Global, particularly acute in emerging markets |
| Stringent Global Regulatory And Occupational Safety Standards | -1.2% | Global, with varying enforcement intensity |
| Dependence On Limited Suppliers For Specialized Raw Materials And Equipment | -0.9% | Global |
| Shortage Of Skilled Workforce In High-Potency Manufacturing Facilities | -0.7% | Global, sharper in emerging markets |
| Source: Mordor Intelligence | ||
Stringent Global Regulatory and Occupational Safety Standards
EMA’s updated Variations Regulation effective January 2025 demands deeper validation records for post-approval changes, lengthening documentation lead-times. OSHA’s hazardous-drug directives in the United States oblige multi-stage air-locking and specialized PPE, cutting production efficiency by up to 15% relative to conventional pharmaceuticals.[2]OSHA, “Hazardous Drugs: Containment Guidelines,” osha.gov PIC/S Annex 1, enforced from August 2024, embeds quality-risk management into sterile containment, compelling retrofit projects at legacy plants. China’s broadened Anti-Espionage Law has prompted some European inspectorates to halt on-site audits, risking delayed release for Chinese-sourced intermediates. Collectively, these layers inflate compliance budgets and favor incumbents with established regulatory affairs teams.
High Capital and Operational Expenditure Requirements
Greenfield facilities suited for occupational exposure limits below 1 µg/m³ can exceed USD 100 million in initial outlay, as illustrated by Cambrex’s five-year, USD 100 million program. Annual validation, filter-integrity tests, and operator-fitness surveillance consume 15-20% of HPAPI plants’ revenues. Talent shortages push salary premiums; senior containment engineers command 30% above industry median pay grades. Smaller sponsors therefore rely on CDMOs, yet rising capacity utilization rates tighten slot availability and elevate service pricing. Any major regulatory citation can trigger temporary shutdowns; Aspen Biopharma Labs lost multiple production months following a 2024 CGMP warning letter.
*Our forecasts treat driver/restraint impacts as directional, not additive. The impact forecasts reflect baseline growth, mix effects, and variable interactions.
Segment Analysis
By Product Type: Innovation Commands Premium Positioning
Innovative compounds generated the bulk of 2025 revenue, capturing 61.89% owing to patent-protected assets that deliver premium returns capable of offsetting high fixed costs. Continuous inflows of FDA approvals—50 NMEs in 2024, 91% of which were small molecules—maintain the innovation pipeline. CDMOs supporting first-in-class assets negotiate multi-year exclusivity packages, assuring capacity monetization.
Generic HPAPIs, though smaller, are set to grow at 11.18% CAGR through 2031 as blockbuster oncology agents face expirations. Specialized manufacturers such as Aarti Pharmalabs commercialized 54 APIs in FY 2023-24, signaling maturing capability in replicating complex processes without compromising containment.


By Application: Oncology Dominance Drives Therapeutic Focus
The oncology franchise accounted for 72.53% of 2025 spend, reflecting cytotoxic dosing requirements that inherently demand robust containment. Lonza’s Stein, Switzerland campus has seen repeated ADC capacity expansions to meet sponsor demand.
Glaucoma and broader ophthalmology segments, though comparatively small, exhibit the fastest momentum at 12.61% CAGR through 2031, aided by next-generation controlled-release implants such as Glaukos’s Epioxa, which secured FDA NDA acceptance with an October 2025 PDUFA date.
By Synthesis Route: Biotech Platforms Accelerate Growth
Synthetic chemistry retained a 69.94% revenue share in 2025, benefiting from entrenched infrastructure and well-defined process chemistries. Continuous-flow micro-reactors now handle many hazardous transformations, enhancing inherent safety.
Biotech HPAPIs are projected to expand at 11.39% CAGR as peptide therapeutics and oligonucleotides move through late-stage pipelines. WuXi STA’s build-out of 20,000 L peptide reactors and multiple oligo lines demonstrates supplier scaling. Integrated providers capable of linking synthetic payloads to biologic carriers occupy an attractive whitespace in the antibody-drug conjugate value chain.

By Manufacturer Type: Outsourcing Reshapes Industry Structure
Captive networks owned by Big Pharma still accounted for 54.83% of 2025 revenue, leveraging proprietary know-how and IP control. Novo Nordisk’s USD 4.1 billion fill-finish complex in North Carolina typifies ongoing in-house investment.
Merchant plants, however, are set to outpace with a 12.28% CAGR as sponsors seek flexible, asset-light business models. Agilent’s USD 925 million acquisition of BIOVECTRA expands merchant footprints into biologics, peptides, and high potency small molecules. The regulatory imperative to diversify supply away from geopolitically sensitive zones further strengthens the merchant proposition.
Geography Analysis
North America dominates gross revenue, absorbing 39.62% of 2025 demand on the back of a dense innovator ecosystem and an advanced regulatory environment. Pfizer’s USD 465 million Kalamazoo expansion underscores its entrenched commitment to domestic API capability. CARES-Act funding and state-level incentives offset a portion of the capital burden, while the BIOSECURE Act’s 2032 deadline expedites further reshoring. Canada’s alignment with FDA CGMP standards allows seamless cross-border distribution, and Piramal Pharma Solutions recently committed CAD 25 million to expand its Aurora HPAPI output. The high-potency APIs market continues to see additional brownfield retrofits that bring legacy North American sites into compliance with Annex 1 and OSHA revisions.
Asia-Pacific registers the highest regional CAGR at 10.32% through 2031. India’s CDMO sector is driven by Western sponsor diversification. Facility additions in Hyderabad and Visakhapatnam gear toward cytotoxic and peptide synthesis, supported by India’s Production Linked Incentive scheme. China retains a cost-lead position but faces compliance headwinds following the Anti-Espionage Law, leading some multinationals to dual-source. Singapore’s biologics initiative and South Korea’s regulatory harmonization further cement APAC’s stature as a multi-modality HPAPI hub.
Europe remains a pivotal manufacturing node, especially for complex biologics and conjugates. EMA’s Variations Regulation harmonizes procedural clarity, easing pan-EU lifecycle management. Switzerland, outside the EU but deeply integrated, hosts Lonza’s flagship sites that anchor European antibody-drug conjugate output. The European Commission’s Critical Medicines Act lists 270 APIs for strategic support, opening grant pathways for plant retrofits and capacity expansions. Attractive electricity-price hedging and experienced labor pools keep Western European facilities competitive despite higher operating costs.

Competitive Landscape
Industry structure tilts toward moderate consolidation as top CDMOs and vertically integrated pharma majors command multi-disciplinary containment assets. Lonza, WuXi AppTec, and CordenPharma occupy premium share by offering cradle-to-launch solutions spanning process development to fill-finish. Geopolitical realignment reshapes vendor shortlists; several US biotechs have already reassigned lead projects from Chinese to Indian or EU facilities, compressing WuXi’s intake ratio despite its broad capacity.
Technological leadership differentiates frontrunners. Continuous-flow reactors, advanced barrier isolators, and AI-assisted release testing cut batch times by up to 20% while safeguarding operator exposure. Strategic alliances proliferate: Eli Lilly inked multi-year reserved-capacity deals with CordenPharma for peptide APIs, while AstraZeneca co-developed humidity-tolerant cytotoxic isolators with Hovione for TROP2 ADC payloads.
Emerging disruptors explore unconventional manufacturing environments. Varda Space Industries achieved 98.5% ritonavir purity from microgravity crystallization, hinting at future off-planet API refining. M&A intensity remains elevated; Avid Bioservices’ USD 1.1 billion leveraged buyout exemplifies private-equity appetite for scale-ready biologics plants. Expect mid-sized European CDMOs with dual synthetic-biologic suites to become prime acquisition targets as sponsors chase integrated conjugation capabilities.
High Potency APIs Industry Leaders
Pfizer Inc.
Thermo Fisher Scientific Inc.
Sanofi (EUROAPI)
Teva Pharmaceutical Industries Ltd
Merck KGaA
- *Disclaimer: Major Players sorted in no particular order

Recent Industry Developments
- May 2026: Piramal Pharma Solutions (PPS) unveiled a state-of-the-art payload-linker development and manufacturing suite at its Riverview, Michigan drug substance facility. This launch is a central component of PPS’s broader USD 90 million U.S. investment plan, announced last year, aimed at expanding domestic manufacturing capabilities.
- April 2025: Penpulimab-kcqx received FDA nod for relapsed nasopharyngeal carcinoma after multiple fast-track designations.
- March 2025: Obecabtagene autoleucel secured FDA approval for R/R B-ALL; product manufactured at Autolus’ UK site.
- January 2025: FDA granted accelerated approval to sunvozertinib (Zegfrovy) in metastatic NSCLC with EGFR exon 20 insertions.


Global High Potency APIs Market Report Scope
A highly potent active pharmaceutical ingredient (HPAPI) is generally defined as a pharmacologically active ingredient or intermediate that shows biological activity at approximately 150 µg/kg of body weight or below in humans.
The high-potency APIs (HPAPI) market is segmented by product type (innovative high-potency active pharmaceutical ingredients and generic high-potency active pharmaceutical ingredients), application (oncology, hormonal imbalance, glaucoma, and other therapeutic applications), synthesis (synthetic high-potency active pharmaceutical ingredients and biotech high-potency active pharmaceutical ingredients), manufacturer (captive HPAPI manufacturers and merchant HPAPI manufacturers), and geography (North America, Europe, Asia-Pacific, Middle East and Africa, and South America). The report also covers the estimated market sizes and trends for 17 countries globally.
The report offers the value (in USD) for the above segments.
| Innovative HPAPIs |
| Generic HPAPIs |
| Oncology |
| Hormonal Disorders |
| Glaucoma |
| Other Applications |
| Synthetic HPAPIs |
| Biotech HPAPIs |
| Captive Manufacturers |
| Merchant Manufacturers |
| North America | United States |
| Canada | |
| Mexico | |
| Europe | Germany |
| United Kingdom | |
| France | |
| Italy | |
| Spain | |
| Rest of Europe | |
| Asia-Pacific | China |
| Japan | |
| India | |
| Australia | |
| South Korea | |
| Rest of Asia-Pacific | |
| Middle East & Africa | GCC |
| South Africa | |
| Rest of Middle East & Africa | |
| South America | Brazil |
| Argentina | |
| Rest of South America |
| By Product Type | Innovative HPAPIs | |
| Generic HPAPIs | ||
| By Application | Oncology | |
| Hormonal Disorders | ||
| Glaucoma | ||
| Other Applications | ||
| By Synthesis Route | Synthetic HPAPIs | |
| Biotech HPAPIs | ||
| By Manufacturer Type | Captive Manufacturers | |
| Merchant Manufacturers | ||
| Geography | North America | United States |
| Canada | ||
| Mexico | ||
| Europe | Germany | |
| United Kingdom | ||
| France | ||
| Italy | ||
| Spain | ||
| Rest of Europe | ||
| Asia-Pacific | China | |
| Japan | ||
| India | ||
| Australia | ||
| South Korea | ||
| Rest of Asia-Pacific | ||
| Middle East & Africa | GCC | |
| South Africa | ||
| Rest of Middle East & Africa | ||
| South America | Brazil | |
| Argentina | ||
| Rest of South America | ||


Key Questions Answered in the Report
What is driving the growth of the high potency APIs market toward 2031?
The high potency APIs market is forecast to reach USD 49.59 billion by 2031,growing at an 9.14% CAGR.
Which region is expanding the fastest in high potency APIs manufacturing?
Asia-Pacific is projected to post a 10.32% CAGR through 2031 due to India’s CDMO build-out and broader APAC regulatory harmonization.
How large is the oncology share within the high potency APIs market?
Oncology applications accounted for 72.53% of revenue in 2025, making it the single largest therapeutic driver.
Why are merchant CDMOs gaining share over captive facilities?
Outsourcing mitigates capital expenditure for sponsors and offers access to specialized containment, supporting a 12.28% CAGR for merchant manufacturers through 2031.
What regulatory changes most affect HPAPI manufacturers in 2025?
Key shifts include EMA’s new Variations Regulation, revised PIC/S Annex 1, and compliance pressures from the US BIOSECURE Act, all imposing stricter documentation and safety controls.
Page last updated on:


