Market Overview
| Study Period | 2020 - 2031 |
|---|---|
| Forecast Data Period | 2026 - 2031 |
| Historical Data Period | 2020 - 2024 |
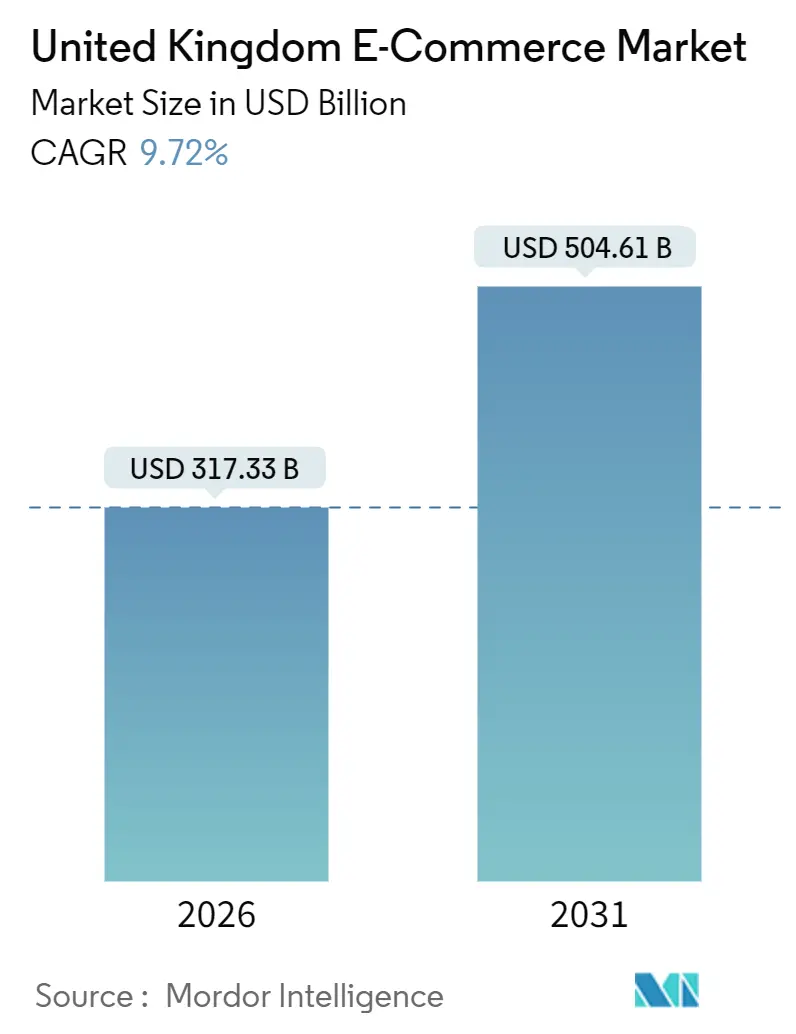
| Market Size (2026) | USD 317.33 Billion |
| Market Size (2031) | USD 504.61 Billion |
| Growth Rate (2026 - 2031) | 9.72% CAGR |
| Market Concentration | Medium |
Major Players *Disclaimer: Major Players sorted in no particular order Image © Mordor Intelligence. Reuse requires attribution under CC BY 4.0. | |
United Kingdom E-commerce Market Analysis by Mordor Intelligence
The United Kingdom E-commerce Market size is USD 317.33 billion in 2026 and is projected to reach USD 504.61 billion by 2031, expanding at a 9.72% CAGR. Building blocks such as national 5G coverage, mainstream digital-wallet habits, and same-day fulfillment networks are converging, moving new cohorts of shoppers and procurement managers online. Price-comparison culture keeps margins thin, yet embedded finance and artificial-intelligence merchandising are lifting average order values while trimming return rates. Platforms able to synchronize mobile discovery, frictionless checkout, and ultrafast delivery are widening their lead, though post-Brexit tax frictions and privacy compliance add operational drag. Structural demand remains resilient because digital purchasing has become routine for both households and businesses even as living-cost pressures rise.
Key Report Takeaways
- By business model, business-to-consumer channels held 87.23% of the United Kingdom E-commerce Market share in 2025, while business-to-business transactions are forecast to post a 12.47% CAGR to 2031.
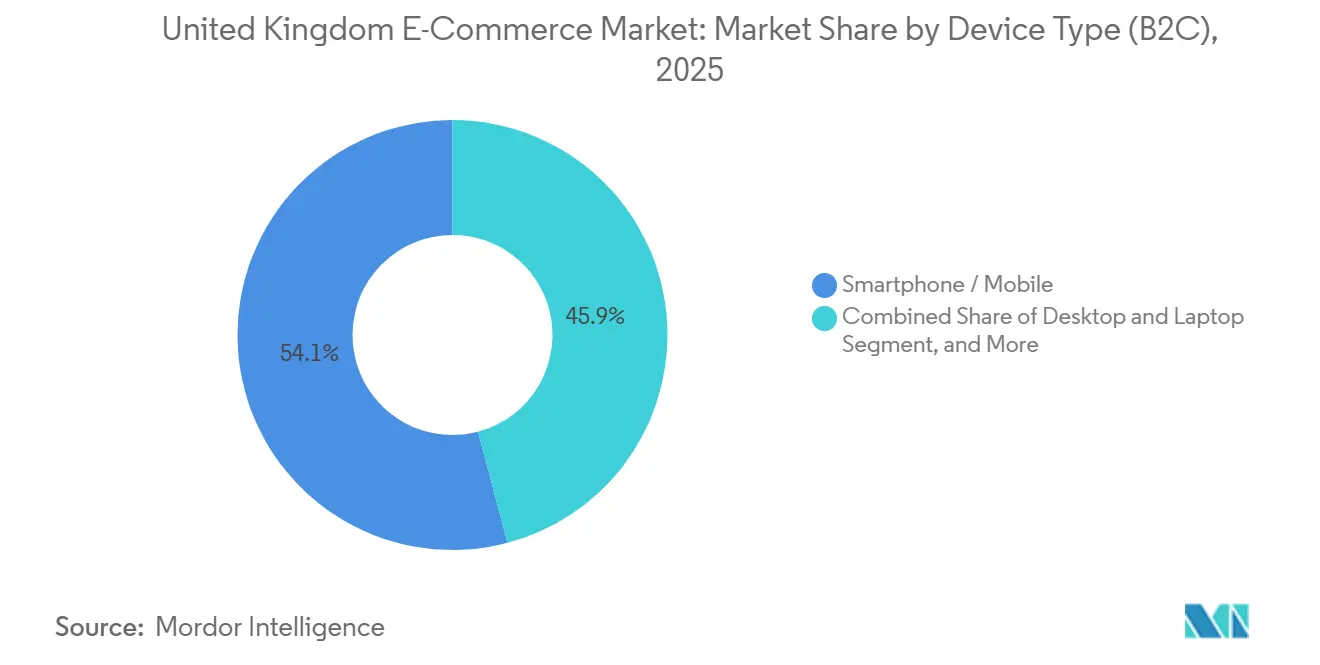
- By device type, smartphones commanded 54.12% of transaction value in 2025 and are projected to expand at a 10.19% CAGR to 2031.
- By payment method, credit and debit cards retained a 32.74% share in 2025, yet buy-now-pay-later services are set to rise at an 11.12% CAGR through 2031.
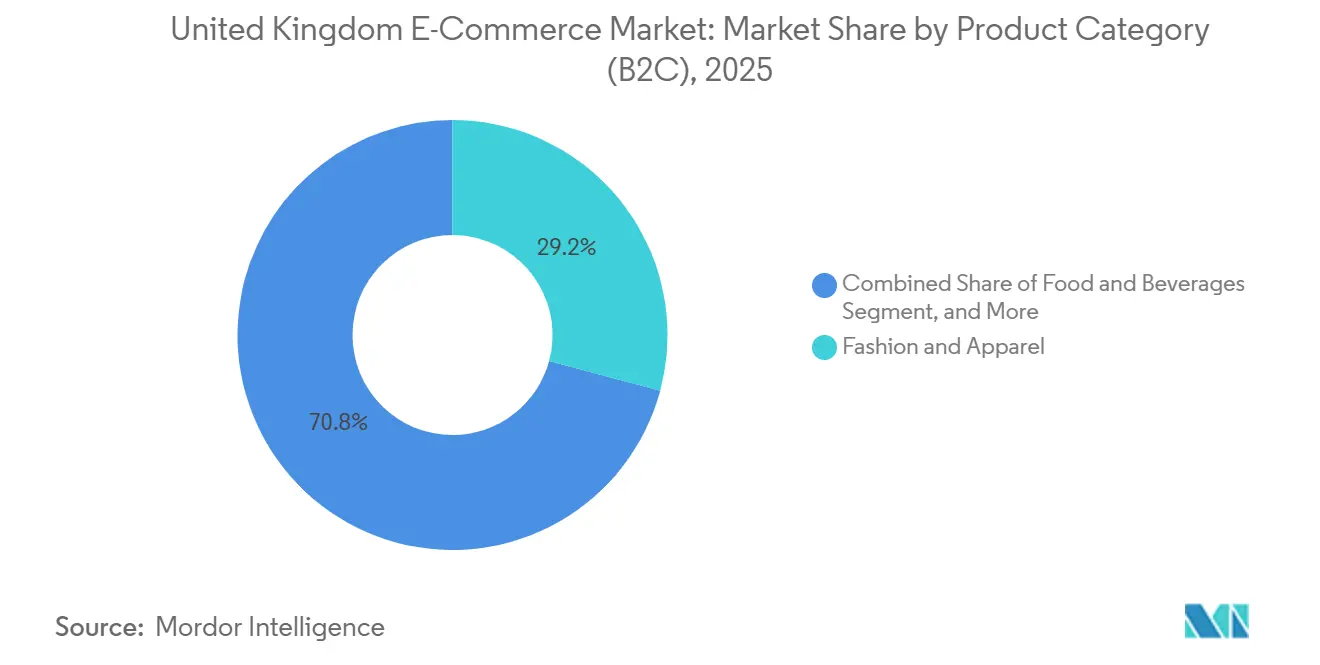
- By product category, fashion and apparel led with 29.17% revenue share in 2025; food and beverages are forecast to expand at a 10.32% CAGR to 2031.
Note: Market size and forecast figures in this report are generated using Mordor Intelligence’s proprietary estimation framework, updated with the latest available data and insights as of January 2026.
United Kingdom E-commerce Market Trends and Insights
Drivers Impact Analysis*
| Driver | (~) % Impact on CAGR Forecast | Geographic Relevance | Impact Timeline |
|---|---|---|---|
| Widespread 5G Roll-Out | +1.8% | National, urban centers lead | Medium term (2-4 years) |
| Proliferation of Secure Digital Payments | +2.1% | National, strongest in England and Scotland | Short term (≤2 years) |
| Rising Mobile-Commerce Share in Retail | +2.3% | National, higher penetration in urban areas | Medium term (2-4 years) |
| Same-Day and Next-Day Delivery Expectations | +1.5% | England Golden Triangle, expanding to Scotland and Wales | Short term (≤2 years) |
| Surging Adoption of Social-Commerce Live Shopping | +0.9% | National, led by Gen Z and Millennials | Long term (≥4 years) |
| Expansion of On-Graduation Student Marketplaces | +0.6% | University cities | Medium term (2-4 years) |
| Source: Mordor Intelligence | |||
Widespread 5G Roll-Out
UK mobile operators pushed 5G coverage beyond 40% of premises by late 2024, giving median urban download speeds above 150 Mbps.[1]Ofcom, “Connected Nations 2024 Report,” ofcom.org.uk Retailers now stream live product demos, push geofenced coupons, and run augmented-reality try-ons without latency complaints. Edge-computing nodes move payment fraud checks closer to the user, trimming 50-100 milliseconds from confirmation times. Furniture, beauty, and auto-parts sellers report lower return rates because shoppers visualize items in situ before ordering. Rural gaps persist, coverage in Wales and Northern Ireland lags by 20 percentage points, forcing hybrid 4G/5G site designs, yet incremental mast buildouts are already budgeted through 2027. Faster mobile networks therefore enlarge the addressable base for on-the-go transactions and enable immersive merchandising features that convert undecided browsers into buyers.
Proliferation of Secure Digital Payments
Digital-wallet usage jumped from 42% of adults in 2023 to 57% in 2024, and wallet share of e-commerce payments climbed from 8% in 2019 to 29% in 2023.[2]UK Finance, “UK Payment Markets 2024,” ukfinance.org.uk Tokenization hides card numbers, while biometric log-ins shrink checkout to a thumbprint. Buy-now-pay-later (BNPL) adoption soared after zero-interest installment plans entered grocery and beauty baskets, adding flexibility for cash-flow-strained households. The Financial Conduct Authority confirmed consumer-credit regulation for BNPL in 2024, a move that legitimizes the segment for cautious merchants and institutional investors. Meanwhile, open-banking account-to-account rails cut merchant discount rates to 0.3%, testing card-network dominance. Secure, low-friction payment choice therefore boosts conversion, supports higher ticket sizes, and lowers cost-to-serve.
Rising Mobile-Commerce Share in Retail
Smartphones captured 54.12% of B2C spend in 2025 and are compounding at 10.19% annually. Mobile-first checkout flows using biometric ID and token storage reduce cart abandonment by 15-20 points compared with desktop sessions. Progressive web apps (PWAs) sidestep app-store fees yet still deliver offline caching and push notifications. Social media now embeds native checkout so discovery, decision, and payment happen inside one scroll. Retailers optimizing thumb-zone navigation and single-page checkouts see disproportionate gains among Gen Z, but older cohorts are also shifting as familiarity and 5G reliability grow. Rising mobile share therefore acts as an umbrella driver, amplifying every other growth lever from live video to BNPL.
Same-Day and Next-Day Delivery Expectations
Prime-era convenience means consumers equate online shopping with near-immediate gratification. Warehouse footprints dedicated to online orders expanded from 8 million sq ft in 2015 to 69 million sq ft in 2024, an 813% leap.[3]Savills, “UK Logistics Market Research 2024,” savills.co.uk The Golden Triangle corridor offers overnight reach to 90% of the population, making it the nucleus of fulfillment investment. Parcel-locker grids exceed 10,000 sites, letting shoppers reroute parcels away from empty homes. Robots and automated sortation mitigate labor shortages yet require capital budgets only scale players can shoulder. Same-day service thus cements loyalty and lifts basket frequency, but it simultaneously raises barriers for smaller players, nudging the market toward consolidation.
Restraints Impact Analysis*
| Restraint | (~) % Impact on CAGR Forecast | Geographic Relevance | Impact Timeline |
|---|---|---|---|
| Heightened Data-Privacy Regulation (DPDI Bill) | -1.2% | National, stricter in England | Medium term (2-4 years) |
| Intense Price Competition Compressing Margins | -1.5% | National, acute in fashion and electronics | Short term (≤2 years) |
| Volatile Cross-Border VAT Reverse-Charge Rules | -0.7% | National, affecting EU and non-EU imports | Medium term (2-4 years) |
| Warehousing Labor Shortages outside Golden Triangle | -0.9% | Scotland, Wales, Northern Ireland | Long term (≥4 years) |
| Source: Mordor Intelligence | |||
Heightened Data-Privacy Regulation (DPDI Bill)
The Data (Use and Access) Act 2025 imposes smart-data schemes and tighter consent regimes, exposing violators to fines up to 4% of global turnover. Merchants must prove lawful basis for every data field, answer consumer access requests within 30 days, and respect stricter cookie rules overseen by the Information Commissioner’s Office. Compliance tooling, consent logs, permission APIs, and encryption at rest raise fixed costs, especially for SMEs that lack in-house counsel. Early adopters of account-to-account payments also shoulder new liability frameworks. Larger platforms can amortize the cost, while subscale peers weigh merger options or exit. Tighter privacy obligations thus temper marketing precision and raise operating expenses.
Intense Price Competition Compressing Margins
Shein, Temu, and other factory-direct portals introduced ultra-low pricing, forcing incumbents to match markdown cadence or cede share. Shein’s 2024 UK distribution center slashed last-mile times and priced styles 30-50% under high-street norms. ASOS closed its Lichfield warehouse, Boohoo debated a Frasers acquisition, and many electronics sellers use dynamic algorithms that revise prices multiple times daily. Loyalty schemes like Amazon Prime insulate some operators, yet scaling similar benefits demands hefty cross-category breadth. Persistent price wars therefore compress margins, delay break-even for new entrants, and lower reinvestment capacity, offsetting some top-line gains in the United Kingdom E-commerce Market.
*Our forecasts treat driver/restraint impacts as directional, not additive. The impact forecasts reflect baseline growth, mix effects, and variable interactions.
Segment Analysis
By Business Model: Digital Procurement Gains Pace
The United Kingdom E-commerce Market recorded business-to-consumer transactions at 87.23% in 2025, yet business-to-business order flows are growing faster at a 12.47% CAGR. This inflection widens the United Kingdom E-commerce Market size for industrial distributors that add real-time stock visibility and one-click reordering. Generational turnover puts digital-native buyers in control; they prefer transparent catalogs over telephone quotes. Enterprise resource planning suites now plug directly into RS Components and Alibaba.com APIs, automating purchase requisitions and reconciling invoices. Cross-border supply diversification after pandemic disruptions also favors multi-vendor marketplaces with escrow and trade-assurance features. Although B2C volumes remain larger, B2B gains are poised to close the gap as procurement digitization matures.
Scale advantages distinguish winners in each model. Consumer sites leverage loyalty bundles, influencer collaborations, and in-house logistics to monetize vast user pools. B2B players prioritize punchout catalogs and negotiated tier pricing that integrates with buyers’ backend systems. Both rely on mobile-optimized storefronts, but B2B overlays account-based credit lines and workflow approvals. As the United Kingdom E-commerce Market evolves, operators with hybrid portfolios stand to cross-sell between retail and wholesale, maximizing fulfillment density and data insight.
By Device Type (B2C): Mobile Grabs the Steering Wheel
Smartphones captured more than half of United Kingdom E-commerce Market transactions in 2025 and continue to outpace desktop traffic. Faster 5G, progressive web apps, and biometric authentication now mirror the speed of native apps without the friction of downloads. Retailers report measurable lifts in conversion when they shrink checkout to two input fields and integrate one-tap wallets. Desktop remains essential for multivariate comparisons, high-priced equipment, and B2B multi-line orders, but its share is gradually sliding. Tablets serve couch commerce and shared household carts, whereas connected TVs embed QR codes that translate inspiration into checkout.
Mobile’s dominance reshapes content formats: vertical video, shoppable stories, and augmented reality need minimal bandwidth yet deliver tactile product context. Real-time push alerts synchronize with flash sales and location-based coupons, boosting impulse buys. For the United Kingdom e-commerce industry, optimizing thumb-zone layouts, load speed, and edge caching has moved from nice-to-have to baseline competence.


By Payment Method (B2C): Instalments Take the Spotlight
Cards still anchor 32.74% of B2C payments, but BNPL is the fastest climber, unlocking new budget flexibility without revolving interest. The United Kingdom E-commerce Market size for BNPL transactions is set to compound at 11.12%, punctuated by Klarna and Clearpay scaling credit checks under fresh FCA supervision. Wallets such as Apple Pay and PayPal ride the tokenization wave, shrinking fraud risk and dispute-resolution cycles. Open-banking transfers, while sub-5% of checkout today, promise fee relief for merchants and instant settlement for cash-flow management.
Regulatory clarity raised sector credibility, channeling institutional finance toward leading BNPL brands and fostering merchant integration beyond fashion into travel and high-ticket home goods. Meanwhile, merchants monitor basket inflation and consumer debt levels to balance conversion lifts with responsible-lending duty. Diversified payment stacks are now a competitive requirement for any platform seeking to widen addressable cohorts within the United Kingdom E-commerce Market.
By Product Category (B2C): Groceries Lead the Growth Curve
Fashion retains the largest category share at 29.17%, yet grocery is the fastest climber with a 10.32% CAGR as dark stores and micro-fulfillment hubs shave delivery to under 15 minutes. Quick-commerce operators curate 1,500-2,000 SKUs, monetizing urgent top-up missions, while established grocers double down on same-day slots and subscription bundles. Electronics remains lucrative thanks to high order values, though return logistics require robust triage.
Beauty benefits from live-stream demos, with TikTok Shop collapsing discovery and purchase. Furniture and DIY use 3D visualization and scheduled delivery windows to convert larger baskets. Each category’s unit economics and return dynamics influence supply-chain design, but all share the gravity toward speed, transparency, and mobile discovery that defines the United Kingdom E-commerce Market.
Geography Analysis
England dominates volumes on the strength of 83% population share and a warehouse lattice concentrated in the Midlands-Yorkshire axis that reaches 90% of addresses overnight. London outspends all regions thanks to higher incomes and 5G coverage exceeding 60%. The South East mirrors capital trends, attracting premium grocery pilots and same-day luxury fashion drops. The North West and West Midlands leverage lower land costs for mega-sheds serving Amazon UK, ASOS, and THG, drawing seasonal labor from university towns.
Scotland, Wales, and Northern Ireland together form a strategic secondary theater. Edinburgh and Glasgow match national digital spending averages, yet Highlands areas lag due to sub-20% 5G penetration. Wales benefits from Amazon’s Swansea hub, though warehousing labor shortages force wage premiums that dent margins. Northern Ireland’s dual-regulatory VAT requirements under the Protocol demand granular customs workflows, nudging Chinese and EU merchants to create local entities. Connectivity disparities and taxation complexity explain why the United Kingdom E-commerce Market accrues disproportionate incremental value in England, but targeted fulfillment nodes in underserved regions could unlock pent-up demand willing to pay reliability premiums.
Competitive Landscape
Market concentration is moderate. Amazon UK, Tesco, and ASOS headline sector share but a long tail of category specialists and emerging disruptors preserve rivalry. Amazon’s pledged USD 12.8 billion (converted from GBP 10 billion at 2025 average rate) investment, funneled into robotics, cloud capacity, and parcel lockers, underscores its hybrid retail-cloud model.[4]Amazon UK, “Amazon Announces Plan to Invest £8 Billion in the UK,” aboutamazon.co.uk Tesco’s Clubcard Plus widens membership moats, while Next licenses its Total Platform logistics stack to third parties, transforming a cost center into revenue. Ultra-fast-fashion insurgents compress design-to-launch cycles under two weeks, pressuring high-street stalwarts. THG upgrades its Ingenuity SaaS to monetize AI merchandising for brands lacking in-house tech.
B2B white space invites RS Components, Alibaba.com UK, and mid-market wholesalers to digitize procurement for maintenance and electrical supplies. Social commerce opens another front: TikTok Shop’s live-shopping captures Gen Z attention spans, prompting legacy retailers to embed shoppable video. Compliance overhead from the Data (Use and Access) Act favors scale players that can absorb legal and engineering spend, nudging fragile independents toward marketplaces or M&A. Thus, technology prowess, logistics reach, and compliance capacity define competitive leverage in the United Kingdom E-commerce Market.
United Kingdom E-commerce Industry Leaders
Amazon UK Services Ltd.
eBay (UK) Ltd.
ASOS plc
Tesco plc (Tesco.com)
Sainsbury’s Argos Ltd.
- *Disclaimer: Major Players sorted in no particular order

Recent Industry Developments
- December 2025: Amazon UK opened a 1 million sq ft robotics fulfillment center in Peterborough equipped with Sequoia and Sparrow systems, cutting order-to-ship intervals to 12 hours for Prime members.
- November 2025: Tesco expanded Clubcard Plus, adding unlimited free grocery delivery on baskets over GBP 25.
- October 2025: Marks and Spencer partnered with Ocado to pilot four-hour delivery in London, using the Erith automated site.
- September 2025: Boohoo entered advanced takeover talks with Frasers Group in a potential GBP 400 million deal.


Research Methodology Framework and Report Scope
Market Definitions and Key Coverage
Our study defines the United Kingdom e-commerce market as the gross merchandise value generated when domestic consumers or enterprises purchase physical goods or services online through websites, mobile apps, or social storefronts, with payment processed digitally and fulfillment handled by mail, courier, or click-and-collect.
Scope exclusion: Sales where the merchant of record is registered outside the United Kingdom and pure digital-only media subscriptions are not counted within this scope.
Segmentation Overview
- By Business Model
- B2C
- B2B
- By Device Type (B2C)
- Smartphone / Mobile
- Desktop and Laptop
- Other Device Types
- By Payment Method (B2C)
- Credit and Debit Cards
- Digital Wallets
- Buy Now Pay Later (BNPL)
- Other Payment Methods
- By Product Category (B2C)
- Beauty and Personal Care
- Consumer Electronics
- Fashion and Apparel
- Food and Beverages
- Furniture and Home
- Toys, DIY and Media
- Other Product Categories
Detailed Research Methodology and Data Validation
Primary Research
Interviews with marketplace category heads, parcel integrators, payment-service executives, and small web-store owners across England, Scotland, Wales, and Northern Ireland confirmed basket sizes, return ratios, and segment growth expectations, letting us fine-tune assumptions drawn from desk work.
Desk Research
We began with the Office for National Statistics monthly internet retail turnover, HMRC customs declarations, and UK Finance card-payment dashboards, which anchor overall spending. Insights from the Interactive Media in Retail Group, Royal Mail parcel statistics, and open-access academic studies enriched our understanding of buyer behavior and delivery trends. Company 10-Ks and investor decks accessed via D&B Hoovers, together with news archives on Dow Jones Factiva, supplied channel-level revenue clues and pricing context. The sources cited are illustrative; many other credible records guided data collection, validation, and clarification.
Market-Sizing & Forecasting
A top-down build started from ONS internet sales, expanded with trade data to capture B2B flows, and was cross-checked against a selective bottom-up roll-up of leading merchant revenues and sampled ASP × volume calculations. Key variables modeled include smartphone share of checkouts, parcel density per capita, digital-wallet penetration, average return percentage, promotional intensity, and real disposable income. Forecasts employ multivariate regression blended with ARIMA to capture structural drivers and seasonality. Data gaps were bridged using analog sub-segment benchmarks before final triangulation.
Data Validation & Update Cycle
Outputs undergo variance tests against independent parcel volumes and network-payment totals, followed by peer review of anomalies. Models refresh annually, with interim updates triggered by material regulatory or technology events, ensuring clients receive the latest view.
Why Mordor's UK Ecommerce Baseline Commands Reliability
Published estimates often vary because firms apply different scopes, price series, and refresh cadences.
By grounding values in current ONS data, corroborating them through targeted field interviews, and updating every year, Mordor Intelligence delivers a balanced, dependable starting point for decision-makers.
Benchmark comparison
| Market Size | Anonymized source | Primary gap driver |
|---|---|---|
| USD 265.14 B (2025) | Mordor Intelligence | - |
| USD 285.60 B (2025) | Regional Consultancy A | Adds travel and event tickets; refreshes biennially |
| USD 129.71 B (2024) | Global Consultancy B | Counts only physical goods B2C; excludes B2B; conservative ASPs |
| USD 829.16 B (2024) | Industry Journal C | Bundles digital content and peer payments; optimistic scenario |
Differences stem mainly from scope stretch and dated inputs; our disciplined blend of public statistics and primary checks keeps Mordor's baseline transparent, reproducible, and trustworthy.


Key Questions Answered in the Report
How large is United Kingdom e-commerce spending in 2026?
The United Kingdom E-commerce Market size is USD 317.33 billion in 2026.
What is the expected growth rate through 2031?
Aggregate online spending is forecast to post a 9.72% CAGR, reaching USD 504.61 billion in 2031.
Which business model is expanding fastest?
B2B transactions show the highest momentum, advancing at a 12.47% CAGR as companies digitize procurement workflows.
Which device drives most consumer orders?
Smartphones already capture 54.12% of B2C value and are still expanding the fastest.
Why is BNPL important for merchants?
BNPL boosts conversion by splitting payments into zero-interest installments and is projected to grow at 11.12% annually under new FCA regulation.
Where should logistics investors focus beyond England?
Targeted fulfillment hubs in Scotland, Wales, and Northern Ireland can unlock underserved demand where same-day delivery remains scarce.
Page last updated on:


