United Kingdom E-commerce Logistics Market Size and Share
Market Overview
| Study Period | 2021 - 2031 |
|---|---|
| Forecast Data Period | 2026 - 2031 |
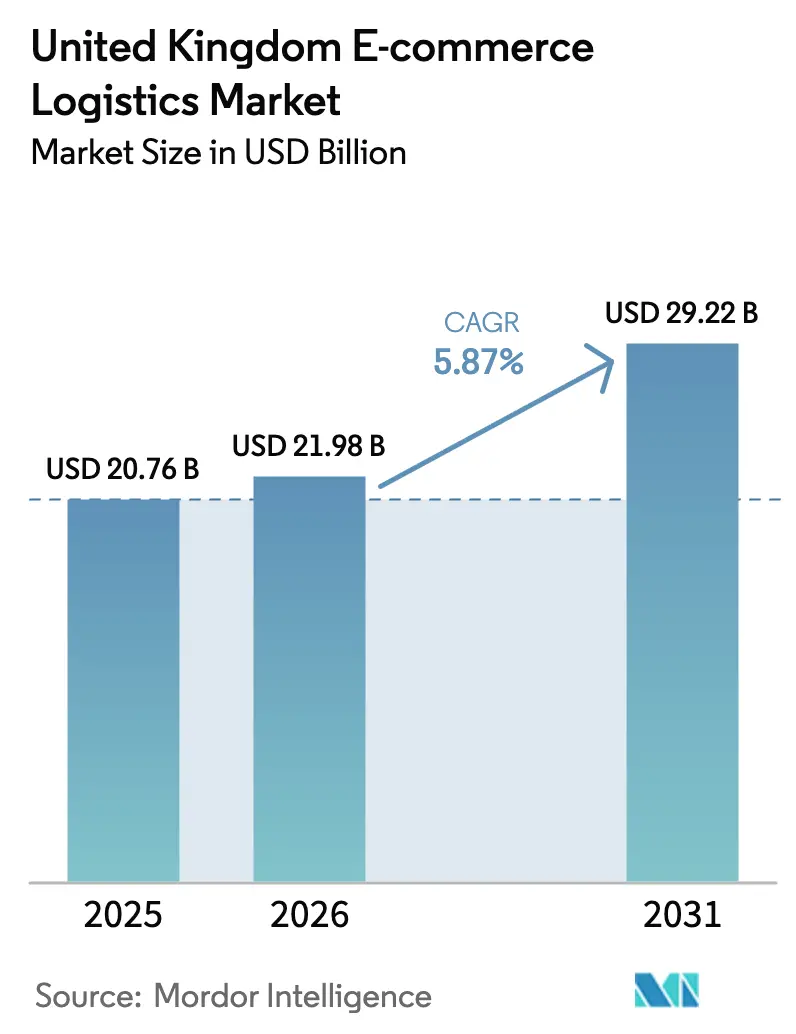
| Base Year Market Size (2025) | USD 20.76 Billion |
| Market Size (2026) | USD 21.98 Billion |
| Market Size (2031) | USD 29.22 Billion |
| Growth Rate (2026 - 2031) | 5.87% CAGR |
| Market Concentration | Medium |
Major Players *Disclaimer: Major Players sorted in no particular order Image © Mordor Intelligence. Reuse requires attribution under CC BY 4.0. | |
United Kingdom E-commerce Logistics Market Analysis by Mordor Intelligence
The United Kingdom E-commerce Logistics Market size in 2026 is estimated at USD 21.98 billion, growing from 2025 value of USD 20.76 billion with 2031 projections showing USD 29.22 billion, growing at 5.87% CAGR over 2026-2031. Growth now derives less from pandemic-era volume spikes and more from efficiency initiatives such as route optimization, warehouse automation, and post-Brexit network realignment. Cross-border flows remain pivotal because Dutch haulers still lose more than 4 hours at customs, which has triggered new EU-to-UK fulfilment hubs to cut transit friction. Labor shortages, with 49,000 fewer HGV drivers than in 2019, push wage inflation toward 12% and accelerate the roll-out of robotics in large facilities. The recent DHL–Evri merger, announced in May 2025, adds unprecedented parcel scale, while private-equity interest, evidenced by Apollo’s GBP 2.7 billion purchase of Evri, confirms long-term confidence in the UK e-commerce logistics market. Supply-side constraints, especially planning limits in South-East England, keep warehouse rents high yet spur mixed-use logistics projects in land-scarce Tier-1 cities.
Key Report Takeaways
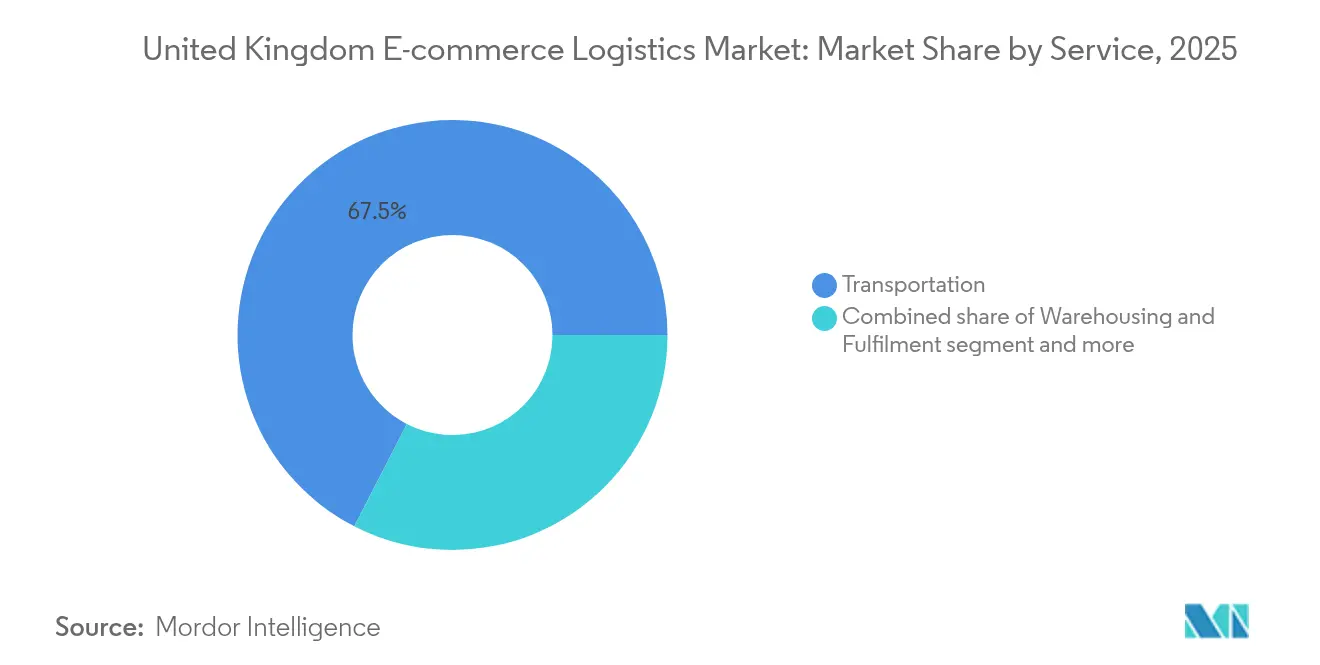
- By service, transportation commanded 67.45% of the UK e-commerce logistics market share in 2025. The UK e-commerce logistics market for value-added services is poised to advance at a 7.18% CAGR between 2026-2031.
- By business model, the B2C segment held 71.85% of the UK e-commerce logistics market revenue share in 2025. The UK e-commerce logistics market for C2C is projected to grow at 7.36% CAGR between 2026-2031.
- By destination, domestic logistics accounted for 84.25% of the UK e-commerce logistics market share in 2025. The UK e-commerce logistics market for cross-border outbound is forecast to rise to an 7.78% CAGR between 2026-2031.
- By delivery speed, standard services led with 51.85% of the UK e-commerce logistics market share in 2025. The UK e-commerce logistics market for same-day delivery is expanding to a 9.1% CAGR between 2026-2031.
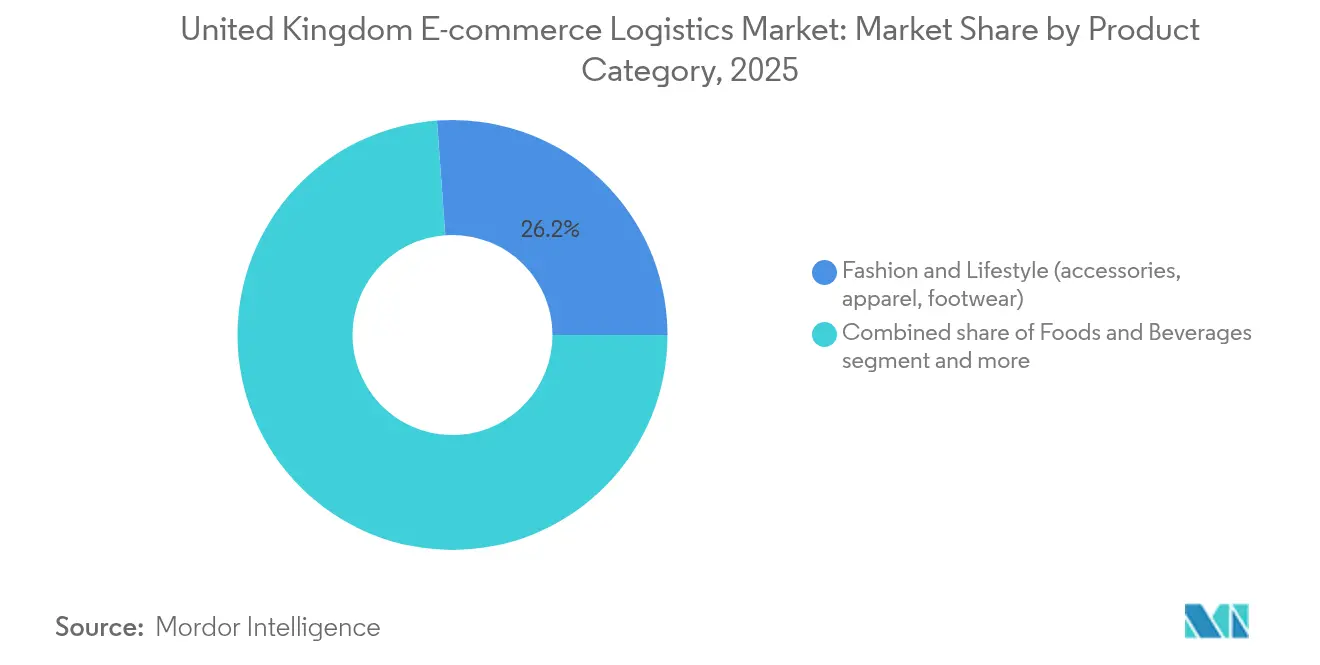
- By product category, fashion & lifestyle captured 26.15% of the UK e-commerce logistics market share in 2025. The UK e-commerce logistics market for foods & beverages is on course for a 9.58% CAGR between 2026-2031.
- By city-tier, tier-1 cities held 62.35% of the UK e-commerce logistics market revenue share in 2025. The UK e-commerce logistics market for tier-2 cities is poised to expand at a 6.05% CAGR through 2031.
- By geography, England contributed 87.05% of the UK e-commerce logistics market revenue in 2025. The UK e-commerce logistics market for Northern Ireland is set to register the fastest 7.55% CAGR between 2026-2031.
Note: Market size and forecast figures in this report are generated using Mordor Intelligence’s proprietary estimation framework, updated with the latest available data and insights as of 2026.
United Kingdom E-commerce Logistics Market Trends and Insights
Drivers Impact Analysis*
| Driver | (~) % Impact on CAGR Forecast | Geographic Relevance | Impact Timeline |
|---|---|---|---|
| Expanding same-day & next-day delivery expectations among UK consumers | +1.2% | England core; spill-over to Scotland & Wales | Medium term (2-4 years) |
| Post-Brexit boom in cross-border EU-to-UK fulfilment hubs | +0.8% | South-East England; Northern Ireland gateway | Long term (≥4 years) |
| Rapid growth of SME D2C brands leveraging online marketplaces | +0.9% | Nationwide; concentration in London & Manchester | Short term (≤2 years) |
| Accelerated warehouse automation adoption to offset UK labor shortage | +0.7% | Midlands and Scotland central belt | Medium term (2-4 years) |
| Rise of urban micro-fulfilment centers in Tier-1 cities | +0.6% | London, Manchester, Birmingham | Short term (≤2 years) |
| Retailers’ shift toward omnichannel click-and-collect models | +0.5% | National; suburban concentration | Medium term (2-4 years) |
| Source: Mordor Intelligence | |||
Expanding Same-Day and Next-Day Delivery Expectations Among UK Consumers
Same-day parcels are growing at a 9.6% CAGR through 2030, even though they involve higher route complexity and elevated cost. Tier-1 cities, which host 63% of overall parcels, provide the density needed for viable rapid services. Royal Mail has enlarged its parcel locker estate by 1,000 units since January 2025 in partnership with YEEP!, making lockers available at over 21,000 sites. The network upgrade has cut failed first-time deliveries and preserved margins. Smaller couriers struggle to match these service levels, an imbalance highlighted by the DHL–Evri tie-up that joins courier scale with premium van capacity. Vehicle innovation continues as ELM Mobility deploys GBP 25,000 (USD 33,604.8) electric quadricycles engineered for narrow city streets while still carrying full euro-pallets. Foods & beverages receive a direct boost because sub-30-minute grocery missions depend on dense, rapid fulfilment rings close to shoppers.
Post-Brexit Boom in Cross-Border EU-to-UK Fulfilment Hubs
Brexit introduced new customs checks but also incentivized EU retailers to hold local inventory in Britain. Cross-border outbound logistics now records an 8.1% CAGR, driven by UK sellers eyeing the EU’s online non-food market. The New Computerized Transit System Phase 5 went live in January 2025, allowing Movement Reference Numbers to replace paper documents, a change that saves time, yet border queues for Dutch carriers still average 4 hours[1]HM Revenue & Customs, “New Computerised Transit System Phase 5 Guidance,” GOV.UK, gov.uk. Providers that erected bonded hubs near the Channel Tunnel and in Northern Ireland gain a timing edge over rivals that rely on in-line clearance. Automation suppliers report surging enquiries because complex cross-border compliance drives demand for high-throughput sortation equipment.
Rapid Growth of SME D2C Brands Leveraging Online Marketplaces
Marketplace participation lets smaller companies bypass traditional wholesale channels and connect directly with overseas buyers. This shift pushes C2C parcel volumes to a 7.7% CAGR. However, 35,000 UK sellers filed a GBP 1 billion (USD 1.34 billion) collective claim alleging marketplace bias in the “buy box,” prompting the Competition & Markets Authority oversight. DHL eCommerce’s European B2C volumes have climbed 45% since 2019, underscoring how carrier networks have scaled capacity for variable, low-SKU orders. Value-added services, from branded packaging to returns handling, grow in tandem because SME brands outsource fulfilment needs to stay asset-light.
Accelerated Warehouse Automation Adoption to Offset UK Labor Shortage
Warehousing companies face a persistent driver shortfall and a median driver age of 51 years, conditions that raise annual wages by 12%. Ocado’s Luton site illustrates the response: hundreds of autonomous vehicles already pick 15% of items, and management targets 70% automation within three years. The UK ranks first globally for robotics research, giving domestic integrators a quality edge, yet scale economics still favor turnkey imports. AutoStore’s compact Pio platform has won contracts among mid-sized 3PLs looking to share capex risk. The automation wave chiefly benefits warehousing & fulfilment lines, which need to maintain cut-off discipline despite staffing gaps.
Restraints Impact Analysis*
| Restraint | (~) % Impact on CAGR Forecast | Geographic Relevance | Impact Timeline |
|---|---|---|---|
| Chronic driver shortage & high wage inflation in UK logistics | -0.9% | Nationwide; acute in South-East England | Long term (≥4 years) |
| Congested urban road networks raising last-mile costs | -0.6% | London, Manchester, Birmingham | Medium term (2-4 years) |
| Heightened ESG regulations on delivery emissions | -0.4% | Nationwide; stricter enforcement in England | Long term (≥4 years) |
| Restrictions on warehouse planning permissions in South-East England | -0.3% | South-East England | Medium term (2-4 years) |
| Source: Mordor Intelligence | |||
Chronic Driver Shortage and High Wage Inflation in UK Logistics
Carrier payrolls now compete directly with construction and utilities for scarce vocational drivers. Advertised pay has risen 21% since 2024, eroding the cost competitiveness of long-haul lanes[2]David Wells, “2025 UK Driver Shortage Report,” Logistics UK, logistics.org.uk. Some operators cut service frequency or cap distance radii to preserve margin, indirectly limiting the achievable scale of the UK e-commerce logistics market. Cross-border specialists feel the pinch most because customs paperwork requires experienced operators. Driver academies funded by large 3PLs signal a long-term solution, but near-term capacity still relies on overtime and agency labor, depressing on-time performance metrics.
Congested Urban Road Networks Raising Last-mile Costs
Average van speeds in central London hover near 10 mph during peak hours, compelling couriers to schedule multiple route waves per day, driving up per-stop costs. Logistics UK campaigns for enhanced freight access to bus lanes to stabilize productivity. Micro-mobility trials such as electric quadricycles show promise yet require new curbside loading rules. Small delivery firms without route optimization software remain disproportionately exposed to congestion fees, nudging the market toward consolidation. Retailers respond by adding locker networks, shifting some urban handovers to customer pick-up, and reducing dwell time at the kerb.
*Our forecasts treat driver/restraint impacts as directional, not additive. The impact forecasts reflect baseline growth, mix effects, and variable interactions.
Segment Analysis
By Service: Transportation Dominance Drives Automation Investment
Transportation services contributed 67.45% of 2025 revenue, underscoring their central role in the UK e-commerce logistics market. Road haulage remains the workhorse because it offers door-to-door reach within tight delivery windows. Rail has begun to shave costs on routes linking London St Pancras with the Channel Tunnel, encouraged by recently proposed freight rebates. Air cargo volumes eased after Royal Mail cut flights to 18 per day, yet lane rationalization improved asset utilization and cut CO₂.
Value-added lines, covering labelling, kitting, and custom packaging, are pacing ahead with a 7.18% CAGR to 2031. The segment thrives on rising SME D2C orders that need branded unboxing and SKU personalization. As automation spreads, mid-cap 3PLs deploy scalable sortation systems to support these specialized flows. Those dynamic supports price premiums above general haulage and diversifies earnings profiles for carriers that once relied solely on thin-margin transport.


By Business Model: B2C Leadership Faces C2C Disruption
B2C shipping dominated with a 71.85% stake in 2025, reflecting entrenched retail platforms and omnichannel store networks that stabilize volume. Predictability allows route balancing across urban and rural drops, an essential lever for profitability.
C2C parcels, spurred by recommerce and peer-to-peer apps, are advancing at 7.36% CAGR as consumers prioritize sustainability and budget values. Logistics providers commercialize pick-up-drop-off (PUDO) solutions tailored to single-item flows, offsetting the cost of doorstep collection. B2B demand remains steady, yet digital procurement portals blur traditional boundaries, folding some B2B traffic into blended network lanes.
By Destination: Domestic Strength Meets Cross-Border Innovation
Domestic consignments retained an 84.25% share of the UK e-commerce logistics market size in 2025, supported by dense population clusters that deliver repeatable last-mile density. The domestic network profits from omnichannel retailers that use stores as mini depots and slash failed-delivery percentages.
Cross-border outbound shipments show the liveliest trajectory at 7.78% CAGR, motivated by UK sellers targeting EU buyers despite customs hurdles. The NCTS Phase 5 rollout reduces paper processing, yet carriers with bonded hubs still enjoy lead-time advantages. Inbound cross-border flows gain from EU brands placing stock inside Britain to cushion post-Brexit duties and to get next-day reach to UK shoppers.
By Delivery Speed: Standard Services, Balance Growth, Acceleration
Standard 3-5-day options controlled 51.85% sales in 2025, reflecting continued consumer willingness to trade speed for free shipping. Consolidated trucking keeps kilometer costs low and preserves margins amid fuel volatility.
Same-day parcels headline at 9.1% CAGR as fast fashion and grocery players promise near-instant service. Network planners lean on micro-fulfilment centers and expanded locker grids to avoid traffic bottlenecks. Next-day continues to anchor mid-range propositions, whereas economy 5-day+ tiers cater to price-sensitive rural addresses.
By Product Category: Fashion Leadership Yields to Food Innovation
Fashion & lifestyle commanded a 26.15% share, buoyed by high average basket values and ingrained online buying habits. Returns processing has become integral because apparel generates double-digit return ratios, leading carriers to refine reverse-logistics paths to protect margins.
Foods & beverages outpace with a 9.58% CAGR thanks to dark-store and quick-commerce models that guarantee chilled delivery within 30 minutes. These flows demand cold-chain vans and temperature-stable packaging that adds complexity yet yields premium fees. Electronics, furniture, and personal-care parcels each present bespoke handling rules, widening the scope for specialized 3PL services.
By City-Tier: Tier-1 Concentration Enables Tier-2 Expansion
Tier-1 cities, led by London, Manchester, and Birmingham, captured 62.35% of revenue as of 2025 because population density underpins route density. Land scarcity prompts multi-level warehousing and the co-location of pick stations within mixed-use blocks that also house offices or flats.
Tier-2 centers grow at 6.05% CAGR as improved fiber connectivity spurs e-commerce adoption. Lower rents allow large-format fulfilment hubs that feed regional spokes, thereby alleviating congestion inside Tier-1 cores. Tier-3 areas remain niche, often handling specialist goods like outdoor equipment that align with local demographics.
Geography Analysis
England generated 87.05% of 2025 turnover, fueled by London’s economic heft and the M1/M6 corridor’s distribution spine. Yet restrictive planning near the M25 keeps vacancy tight and rents elevated, pushing new capacity toward Northamptonshire and the East Midlands mega-parks. Authorities tolerate mixed-use logistics to preserve city vibrancy while meeting consumer demand for rapid delivery.
Scotland, though smaller, leverages the Glasgow-Edinburgh axis to service the Central Belt and functions as a springboard for Northern European links. Renewable-energy availability opens prospects for low-carbon warehousing, aligning with the nation’s Net Zero path. Remote Highlands still need bespoke milk-run schedules, retaining a role for niche rural operators.
Wales and Northern Ireland round out the map. Wales benefits from Irish Sea crossings and offers overflow capacity for Western England. Northern Ireland outperforms with a 7.55% CAGR because its Protocol status provides privileged, frictionless trade with both Great Britain and the EU. Carriers deploy hybrid fleets to shuttle freight across the Irish Sea, while new cross-docking near Belfast streamlines onward distribution to mainland islands.
Competitive Landscape
The sector now tilts toward moderate concentration after the May 2025 DHL–Evri merger created an enterprise capable of clearing 1 billion parcels yearly. Apollo’s earlier Evri buyout confirms institutional confidence, irrespective of cost headwinds.
Technology-centered strategies dominate. Ocado’s in-house robotics handles 15% of picks today and aims for 70% within three years, shrinking per-order labor minutes. Start-ups exploit white spaces: ELM Mobility scales electric quadricycles for tight city lanes, while InPost’s purchase of Yodel raises its out-of-home locker footprint, making it the UK’s third-largest courier.
Cross-border specialism offers another edge. Providers that invested early in bonded terminals at Folkestone and Larne convert customs pain points into service premiums. Urban micro-fulfilment unlocks last-mile agility yet demands digital twins and AI-based slotting to justify city-center rents. Fragmentation persists beneath the top tier, with 54,000 mostly micro-operators offering acquisition targets to integrators seeking regional capillaries.
United Kingdom E-commerce Logistics Industry Leaders
Royal Mail
Evri (Hermes UK)
DPD UK
DHL Parcel UK
FedEx/TNT
- *Disclaimer: Major Players sorted in no particular order

Recent Industry Developments
- May 2025: DHL eCommerce UK agreed to merge with Evri, creating a combined entity capable of handling over 1 billion parcels annually, subject to CMA review.
- April 2025: InPost acquired Yodel, elevating InPost to roughly 8% domestic share and integrating door-to-door with locker services.
- March 2025: Royal Mail partnered with NewRiver to roll out a new parcel-locker network, expanding click-and-collect reach.
- January 2025: Amazon placed the UK’s largest single electric HGV order, adding over 150 battery trucks to support 300 million package moves each year.


Research Methodology Framework and Report Scope
Market Definitions and Key Coverage
Mordor Intelligence defines the United Kingdom e-commerce logistics market as the revenue generated inside the UK from third-party transportation, warehousing, fulfillment, and value-added services that support the movement of online retail orders from seller to end customer, whether domestic or cross-border.
Parcel letter mail, postal stamp revenues, and pure software platforms without physical flow are excluded, ensuring apples-to-apples comparison.
Segmentation Overview
- By Service
- Transportation
- Road
- Air
- Rail
- Maritime
- Warehousing & Fulfilment
- Value-Added (Labelling, Packaging, Kitting)
- Transportation
- By Business Model
- B2C
- B2B
- C2C
- By Destination
- Domestic
- Cross-Border – Inbound
- Cross-Border – Outbound
- By Delivery Speed
- Same-day (less than 24 h)
- Next-day (24–48 h)
- Standard (3-5 days)
- Economy (more than 5 days)
- Others
- By Product Category
- Foods & Beverages
- Personal & Household Care
- Fashion & Lifestyle (accessories, apparel, footwear)
- Furniture
- Electronics & Household Appliances
- Other Products
- By City-Tier
- Tier 1
- Tier 2
- Tier 3 & Below
- By Geography
- England
- Scotland
- Wales
- Northern Ireland
Detailed Research Methodology and Data Validation
Primary Research
Mordor analysts conduct structured calls and surveys with parcel integrators, same-day specialists, 3PLs, e-tailers, equipment suppliers, and regional associations across England, Scotland, Wales, and Northern Ireland. These conversations validate volume splits, average spend per shipment, warehouse automation spend, and emerging pain points, letting us refine ratios that secondary data alone cannot surface.
Desk Research
Our analysts begin with structured desk work that mines publicly available, high-credibility sources such as the Office for National Statistics retail e-commerce index, HMRC customs trade tables, Department for Transport traffic counts, British Retail Consortium parcel barometer, OECD structural business statistics, and parliamentary briefing papers. Company filings, investor decks, reputable press releases, and paid intelligence from D&B Hoovers and Dow Jones Factiva enrich firm-level insight. These sources ground the baseline yet remain illustrative; many others are consulted for corroboration.
A second desk pass cross-checks parcel density, warehouse take-up, and labor cost indices against data from the UK Warehousing Association and Transport for the North to tighten service-mix assumptions and spot outliers before we proceed to interviews.
Market-Sizing & Forecasting
A top-down model converts national e-retail sales and parcel-throughput figures into logistics spend using service-specific cost elasticity curves, which are then pressure-tested against sampled bottom-up checks such as carrier revenue roll-ups and fulfillment center capacity audits. Key variables like parcel volume per capita, average revenue per parcel, cross-border share, vacancy-adjusted warehouse rents, diesel and electricity price indices, and labor-hour productivity drive annual estimates. Forecasts to 2030 apply multivariate regression blended with ARIMA seasonality to capture holiday peaks, with scenario overlays from primary experts on automation uptake and sustainability surcharge adoption. Gaps in carrier reporting are bridged through three-year moving averages and proxy ratios from comparable operators.
Data Validation & Update Cycle
Outputs face a multi-layer review: automated anomaly flags, senior analyst variance checks, and monthly news sweeps. We refresh the model every twelve months, re-contacting key sources whenever material events, large M&A, abrupt fuel shifts, and regulatory changes surface, so clients receive the most current view.
Why Mordor's United Kingdom E-Commerce Logistics Baseline Commands Reliability
Published figures often differ because firms choose unique service baskets, conversion factors, and update cadences. By aligning scope tightly with end-to-end paid logistics spend and revisiting assumptions yearly, Mordor delivers a balanced, replicable baseline.
Benchmark comparison
| Market Size | Anonymized source | Primary gap driver |
|---|---|---|
| USD 20.76 B (2025) | Mordor Intelligence | - |
| USD 16.27 B (2024) | Regional Consultancy A | Excludes value-added warehousing and applies conservative parcel revenue per unit |
| USD 28.04 B (2024) | Global Research Group B | Uses mixed currency conversions and counts in-house retailer fleets, inflating totals |
In short, the disciplined scope, dual-source validation, and annual refresh cadence adopted by Mordor Intelligence yield numbers decision-makers can trust, while alternative estimates swing wider because critical variables or definitions shift.


Key Questions Answered in the Report
What is the current value of the UK e-commerce logistics market?
The UK e-commerce logistics market stands at USD 21.98 billion in 2026 and is forecast to reach USD 29.22 billion by 2031.
Which service segment is growing fastest?
Value-added services, such as labelling and kitting, are advancing at a 7.18% CAGR, outpacing core transportation lines.
How will same-day delivery evolve by 2031?
Same-day volume is projected to expand at a 9.1% CAGR as micro-fulfilment centers and locker networks widen urban reach.
Why is Northern Ireland a growth hotspot?
Its Protocol status enables low-friction trade with both the EU and Great Britain, supporting a leading 7.55% regional CAGR.
How are carriers addressing labor shortages?
Companies invest heavily in robotics, driver academies and wage incentives, with leading warehouses targeting 70% automation within three years.
What impact will recent mergers have on competition?
The DHL-Evri combination creates a parcel powerhouse handling 1 billion items yearly, increasing scale advantages yet still leaving space for niche specialists.
Page last updated on:


