
United Kingdom Berries Market Size and Share
United Kingdom Berries Market Analysis by Mordor Intelligence
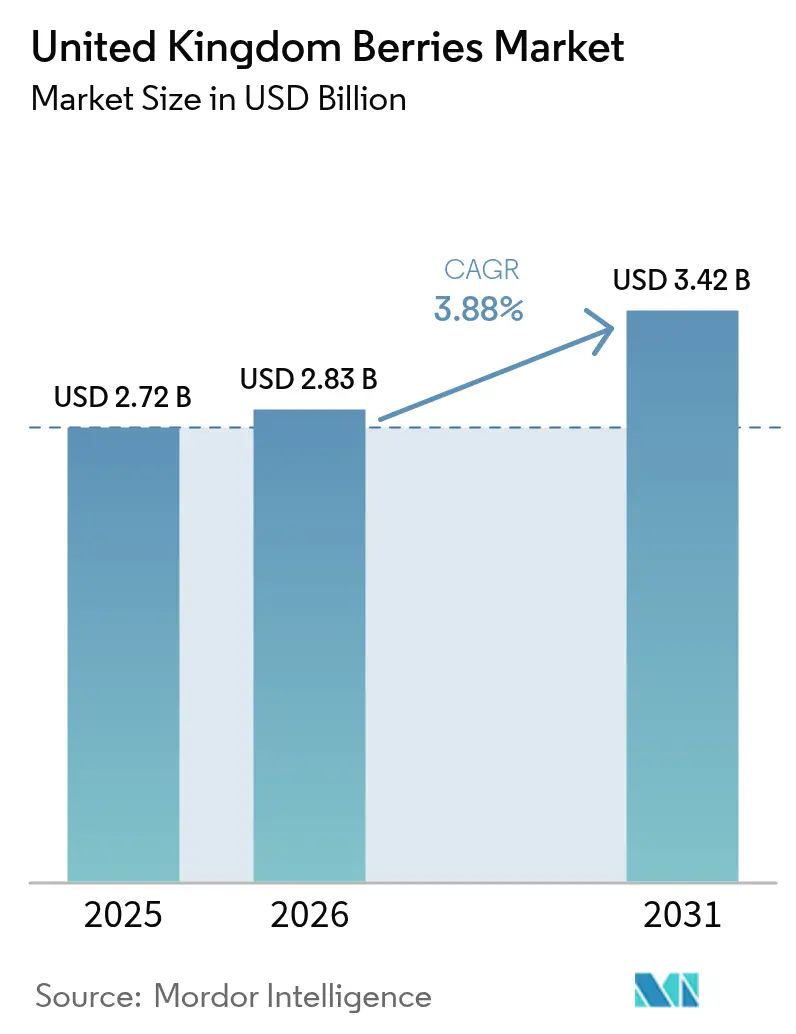
The United Kingdom berries market size in 2026 is estimated at USD 2.83 billion, growing from 2025 value of USD 2.72 billion with 2031 projections showing USD 3.42 billion, growing at 3.88% CAGR over 2026-2031. The market demonstrates resilience despite increased input costs and labor shortages through the adoption of protected-cropping and automation. The industry is shifting toward polytunnels, glasshouses, and vertical systems, which extend harvest periods and increase yields. According to the United Kingdom Horticulture Statistics, raspberry yields in 2024 increased by 2.7% compared to 2023, reaching 11.9 metric tons/ha. The average market price increased by 13% to Euro 10.51 per kg (USD 12.35 per kg), resulting in a 5.5% increase in total crop value[1]Source: Government United Kingdom, "Horticulture statistics 2024", gov.uk. Energy price fluctuations impact margins, strong consumer demand for healthy products, retail premium pricing strategies, and carbon-credit programs support market growth. Competition focuses on vertical integration and automation, with major producers using economies of scale to secure private-label contracts and strengthen the domestic market position.
Key Report Takeaways
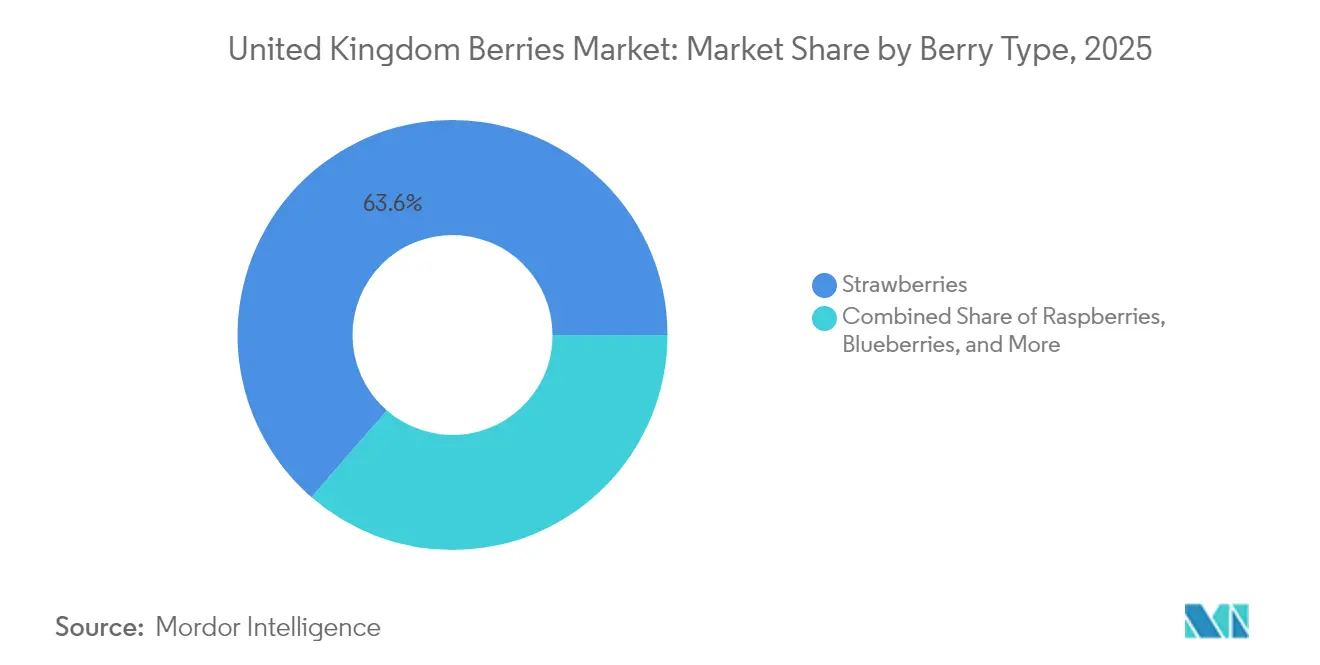
- By berry type, strawberries led with a 63.62% of the United Kingdom berries market share in 2025, while blueberries recorded the fastest 4.03% CAGR to 2031.
Note: Market size and forecast figures in this report are generated using Mordor Intelligence’s proprietary estimation framework, updated with the latest available data and insights as of 2026.
United Kingdom Berries Market Trends and Insights
Drivers Impact Analysis*
| Driver | (~) % Impact on CAGR Forecast | Geographic Relevance | Impact Timeline |
|---|---|---|---|
| Dominance of protected-cropping infrastructure | +1.0% | England, Scotland, and Wales | Medium term (2-4 years) |
| Rising consumer demand for fresh local produce | +0.6% | United Kingdom-wide urban centers | Short term (≤ 2 years) |
| Expansion of super-high-density berry systems | +0.5% | England, and Scotland | Long term (≥ 4 years) |
| Retailer private-label premiumization | +0.3% | Nationwide | Medium term (2-4 years) |
| Emerging carbon-credit revenue streams for berry growers | +0.2% | England, and Wales | Long term (≥ 4 years) |
| Deployment of harvest robotics for peak-season labor shortages | +0.4% | England, and Scotland | Medium term (2-4 years) |
| Source: Mordor Intelligence | |||
Dominance of Protected-Cropping Infrastructure
Polytunnels and greenhouses dominate berry cultivation in the United Kingdom, delivering up to 30% higher yields compared to open fields[2]Source: AHDB, “GrowSave Energy Management in Protected Cropping,” AHDB.ORG.UK. Growers are increasing investments to achieve weather resilience and extended picking seasons. Heating costs constitute 30% of variable expenses, driving the focus toward energy-efficient technologies. Humidity control trials require an additional 0.7 kWh per square meter; they improve fruit quality, demonstrating the balance between performance and costs. The Sustainable Farming Incentive provides subsidies for soil and pest management practices in protected growing systems, reducing capital expenses and supporting year-round berry supply in the United Kingdom market.
Rising Consumer Demand for Fresh Local Produce
Rising health awareness and preference for local produce have driven retail berry sales to new heights, with strawberry revenue reaching GBP 847.5 million (USD 1.06 billion) in 2024[3]Source: Evening Standard, “Future of British Berry Growing Sector Hangs in Balance,” STANDARD.CO.UK. Urban consumers willingly pay higher prices for British berries during the peak season, encouraging growers to align their protected crop harvests with promotional periods. The United Kingdom's blueberry consumption of 1 kilogram per person provides a stable demand foundation and supports growth in domestic production. Retailers have expanded their premium berry selections to meet consumer demand for higher-quality produce. British-grown berries command premium prices during peak growing seasons, as consumers prioritize local sourcing. This domestic market strength helps balance challenges from imported berries, particularly with new border regulations in effect.
Expansion of Super-High-Density (SHD) Berry Systems
Super-high-density growing systems maximize yield per square meter through substrate growing and vertical farming techniques. BerryWorld's 2023 partnership with Smartkas demonstrates the adoption of substrate-based production systems, which provide higher yields and improved fruit quality compared to traditional soil-based cultivation. The industry's shift toward tabletop growing systems optimizes plant spacing and enables mechanized harvesting. This technology benefits strawberry production by extending growing seasons and improving fruit consistency. The main implementation challenges include the need for technical expertise and increased energy costs for climate control, though the improved yields and quality premiums often offset these investments.
Retailer Private-Label Premiumization
United Kingdom retailers are expanding their premium private-label berry programs to increase profit margins and strengthen customer loyalty through exclusive offerings. This trend creates opportunities for growers who can maintain a consistent supply and meet high-quality standards, while increasing operational demands and market competition. Premium strawberry sales in the United Kingdom have increased by 64%, with retailers such as M&S introducing exclusive varieties such as Red Diamond strawberries that achieve higher pricing through enhanced taste qualities. The premium strategy encompasses blueberries, raspberries, and specialty berries, with retailers focusing on innovative packaging and sustainability features to differentiate their products.
Restraints Impact Analysis*
| Restraint | (~) % Impact on CAGR Forecast | Geographic Relevance | Impact Timeline |
|---|---|---|---|
| High capital costs of substrate and tabletop systems | -0.8% | England, and Scotland | Medium term (2-4 years) |
| Post-Brexit supply-chain friction for inputs | -0.6% | United Kingdom-wide | Short term (≤ 2 years) |
| Phytosanitary risks from pest infestation | -0.5% | England, and Wales | Short term (≤ 2 years) |
| Volatile energy prices affecting protected cropping | -0.9% | United Kingdom-wide | Short term (≤ 2 years) |
| Source: Mordor Intelligence | |||
High Capital Costs of Substrate and Table-Top Systems
The transition to advanced growing systems creates significant financial barriers that limit adoption rates and strain grower cash flows during a period of compressed margins. Substrate growing and table-top systems require substantial upfront investments in infrastructure, climate control equipment, and specialized growing media, with installations costing significantly more than traditional soil-based operations. The capital intensity poses challenges, as the majority of berry growers operate at a loss, limiting their ability to secure financing for system upgrades. Smaller growers face greater difficulties accessing capital markets for these investments, potentially accelerating industry consolidation as larger operators gain advantages through advanced systems.
Post-Brexit Supply-Chain Friction for Inputs
Brexit has increased operational complexities and costs for berry growers in the United Kingdom through additional administrative requirements and border controls. Growers face higher expenses and potential delays due to new customs procedures for essential inputs, including plant materials, growing media, and crop protection products. The six-month restriction of the Seasonal Worker Scheme affects growers with extended growing seasons, requiring them to manage workforce transitions or operate with reduced harvesting capacity[4]Source: USDA Economic Research Service, “Brexit and U.S. Agricultural Trade,” ERS.USDA.GOV. These administrative requirements particularly impact small and medium-sized enterprises, reducing their operational flexibility in the United Kingdom berries market.
*Our forecasts treat driver/restraint impacts as directional, not additive. The impact forecasts reflect baseline growth, mix effects, and variable interactions.
Segment Analysis
By Berry Type: Strawberries Lead While Blueberries Accelerate
Strawberries hold 63.62% of the United Kingdom berries market share in 2025, while facing margin pressure from increased labor and input costs despite record retail promotions. The category maintains price leadership through consumer loyalty and peak summer demand, supported by exclusive varieties and protected-cropping methods that deliver consistent quality. In 2024, production costs have increased by GBP 836 per metric ton (USD 1,045 per metric ton) since 2020, though protected systems and automation help manage production risks. The United Kingdom berries market for strawberries continues to grow through improved yields from high-density planting, with excess production directed to processing and exports to maintain price stability.
Blueberries demonstrate a 4.03% projected CAGR, driven by their health benefits and diverse consumption occasions. Controlled-environment production reduces weather-related risks and extends harvest periods to match retail demands, reducing import dependency and expanding the United Kingdom berries market through premium offerings, including snack packs and organic products. Raspberries and blackberries face the highest per-tonne cost increases, leading producers to shift toward more profitable alternatives or integrate frozen processing operations to utilize lower-grade fruit and stabilize revenue across the United Kingdom berries market.



Geography Analysis
England remains the center of the United Kingdom's berry production, with key growing regions in Kent, Herefordshire, and the Lea Valley. The established infrastructure, London's proximity, and suitable microclimates enable efficient supply to retailers, influencing the United Kingdom berries market. The Lea Valley's glasshouse operations benefit from efficient logistics but face higher land costs, leading growers to adopt vertical farming systems and implement energy-efficient upgrades. Kent maintains its position as "the garden of England," utilizing agritourism and farm shops to enhance product value. Herefordshire's investments in frozen berry processing provide revenue diversification and protection against fresh market fluctuations.
Scotland leads in raspberry and blackcurrant production, with cooler summer temperatures improving fruit quality and longevity. The June 2024 Agricultural Census shows reduced strawberry cultivation area but increased protected raspberry production targeting premium markets. Organic production rates exceed the national average, meeting consumer demand for clean-label products. Despite additional transportation costs to southern distribution centers, Scottish origin branding and sustainable practices support higher pricing in the United Kingdom berries market.
Wales features developing berry production clusters that utilize Sustainable Farming Incentive grants for soil management and pest control improvements. Farms combine pick-your-own operations with direct sales, maintaining value in rural areas and building customer loyalty among tourists. Geographic factors limit production scale, local branding and focus on regenerative agriculture enable Welsh producers to serve premium market segments and strengthen their position in the United Kingdom berries market.
Regulatory Landscape
Berries traded and grown in the United Kingdom are subject to plant health and official control regimes led by Defra and implemented by the Animal and Plant Health Agency (APHA) in England and Wales, SASA in Scotland, and DAERA in Northern Ireland. For fresh fruit and vegetables, imports and exports are governed through phytosanitary requirements and border procedures. Marketing standards enforcement is handled by HMI (England and Wales), SASA (Scotland), and DAERA (Northern Ireland), which affects grading, labelling, and lot compliance across retail supply.
From 2026, Great Britain sets out its official controls via the Multi-Annual National Control Plan (MANCP) for 2026 to 2030, covering food and feed safety, animal health and welfare, and plant health controls. Chemical and pesticide-residue oversight is reinforced through the Co-ordinated multi-annual Great Britain Control Plan for Pesticide Residues (2026 to 2028), which defines commodity sampling expectations and testing priorities. This increases the value of traceability and residue-management discipline for both domestic growers and importers.
Value Chain Analysis
The United Kingdom berries value chain starts with breeding and propagation (certified planting material and varieties) and input supply (substrates, fertigation, crop protection, packaging, and energy). Primary production is concentrated in protected systems such as polytunnels and glasshouses, while harvesting remains labour-intensive. After harvest, berries move through rapid cooling, grading, and packing in packhouses, which increasingly use automation to manage throughput and meet quality requirements.
Downstream, berries flow through grower-marketer groups, wholesalers, and distribution centres into major retail channels. Premium private-label programs and strict specification management guide variety selection, appearance requirements, residue limits, and delivery cadence. Retail sourcing and contract structures are a key value-chain lever, and multi-year agreements are used to improve stability for growers facing rising input and labour costs. Sainsbury's, for instance, announced five-year contracts with 62 British berry farms (including partners such as Angus Soft Fruit, Chambers, Soft Fruits Direct, J.O. Sims, and Dyson Farming), supporting protected cropping investment, quality systems, and packhouse capability. Bottlenecks remain concentrated around seasonal labour availability, energy costs for protected cropping, and post-Brexit friction for imported inputs and plant material, raising working-capital needs and making scale and vertical coordination more important.
Market Opportunities and Future Outlook
Automation and digitisation across production and post-harvest operations are a clear opportunity area as growers and retailers manage structural labour constraints and tighter specifications. Defra's blueprint to grow the UK fruit and vegetable sector (published May 2024) points to this direction, with commitments to increase horticulture funding to GBP 80 million from 2026 and GBP 50 million for packhouse automation. This aligns with the market's shift toward protected-cropping and higher-throughput packing for consistent domestic supply. At the retailer level, longer-term sourcing also creates a more investable demand signal, including Sainsbury's five-year contracts with 62 British berry farms and Lidl GB's announced investment tied to increasing British berry volumes, supporting packhouse upgrades, cold-chain resilience, and extended-season production.
On-farm technology is being tested through applied trials and Innovate UK-backed programs that fit soft-fruit operations, including pollination monitoring and robotics for field logistics. In June 2026, AgriSound and UK Berry Growers launched the 18-month ADOPT Smart Pollination Project to trial bioacoustic sensors and AI analytics on strawberry farms (with Tasker Partnership and P J Stirling Ltd), aiming to improve yield consistency and reduce production risk in protected systems. The UK Government also announced additional funding for the Farming Innovation Programme in 2026 (taking it to GBP 123 million for the year), including areas relevant to berries such as robotics and water management. Separately, the Precision Breeding Act (2025) creates a pathway for new varieties, supporting the availability of domestically adapted genetics alongside protected-cropping expansion.
Recent Industry Developments
- June 2026: Lidl GB announced a GBP 500 million investment to increase British berry volumes, including new five-year sourcing agreements with UK-based berry suppliers. The initiative supports longer-horizon investment in protected cropping and packhouse capability, while improving demand visibility for growers working to retailer specifications and extend the domestic season.
- May 2026: Aldi stated it will sell 100% British-grown blackberries across all stores from May 21, 2026, sourced through Driscoll's. This shifts early-season shelf space toward domestic supply and reinforces the need for coordinated grower programs and variety planning to reach national retail scale requirements.
- April 2026: Sainsbury's announced long-term five-year contracts with 62 British berry farms, including suppliers such as Angus Soft Fruit, Chambers, Soft Fruits Direct, J.O. Sims, and Dyson Farming. Multi-year commitments help growers manage de-risking around automation and protected systems, while improving supply continuity and quality consistency for the retailer.


Research Methodology Framework and Report Scope
Market Definition and Coverage
For this study, the market is defined as the total value of berries consumed in the United Kingdom across key berry types, with the size built using demand, supply, and trade signals, and then expressed in USD.
Scope exclusions: This sizing does not intentionally add adjacent fresh fruit categories, and it avoids counting downstream retail service margins that are not part of the berry product value.
Segmentation Overview
-
By Berry Type (Production Analysis (Volume), Consumption Analysis (Volume and Value), Import Analysis (Volume and Value), Export Analysis (Volume and Value), and Price Trend Analysis)
- Strawberries
- Raspberries
- Blueberries
- Blackberries and Currants
- Other Berries (Gooseberries, Cranberries, etc.)
Data Sources, Market Sizing, and Validation
Desk Research
Desk research was used to set the factual base for the model, especially for volumes, trade flows, and price direction across the UK berry supply chain. We relied on public references such as DEFRA and other UK agriculture statistics, HM Revenue and Customs trade releases, FAOSTAT series for cross-checks, and Office for National Statistics datasets where relevant.
To tighten assumptions that public sources do not always explain clearly, we also reviewed grower and trade association updates, peer-reviewed horticulture publications, and company annual reports and investor presentations for operational context. In parallel, paid subscriptions for company financials and intelligence, and shipment-level import and export databases were used selectively to validate trade mixes and sanity check supplier footprints. These examples are not exhaustive, and many other public and paid sources were also used for data collection, validation, and research clarification.
Primary Interviews and Surveys
Primary work focused on growers, packers, importers, distributors, and retail-facing intermediaries, so the volume-to-value bridge could be confirmed in plain commercial terms. Our conversations covered the UK as a single country market, but they still reflected different sourcing seasons, protected cropping adoption, and the practical price formation seen across the year.
Distribution of primary research fieldwork respondents
| Company type | Respondent position |
|---|---|
| Top tier: 30% | CXOs: 17% |
| Mid tier: 48% | Functional/Unit leaders: 39% |
| Smaller Players: 22% | Managers: 44% |
Market-Sizing & Forecasting
Sizing starts from a top down rebuild of the UK demand pool using consumption volume signals, domestic production, and net trade flows, which are then converted into value using observed price bands. That total is corroborated with selective bottom-up approximations, such as sampled average selling prices by berry type multiplied by channel volumes gathered from interviews, and then adjusted when the two views do not line up.
Key inputs in this market include annual production volumes by berry type, import and export quantities, seasonal price movement, yield trends under protected cultivation, and labor and energy cost pressure that can shift supply and pricing. Where a data series is missing for a smaller berry type, we fill the gap using proxy relationships from similar berries and then test it with expert feedback so the assumption stays realistic.
For forecasting, scenario analysis was used around domestic supply expansion, import reliance, and price normalization, and then the final path was chosen based on what industry participants considered achievable under typical weather and cost conditions. Growth rates were not applied as a single blanket factor, since volume and price drivers can move differently in berries.
Data Validation & Update Cycle
Validation is done by checking whether the final value line is consistent with independent signals, such as trade totals, production volumes, and the implied average price per metric ton. Variance flags are reviewed by another analyst, and if a large mismatch remains, follow-up questions are triggered with respondents to recheck the assumption that created the gap.
Each report is refreshed annually, and interim updates are made when there is a material change like a sharp trade shift, a supply disruption, or a major pricing swing. Before delivery, we run a final pass to ensure the latest public datasets and the most recent interview learnings are reflected in the numbers.
Mordor Intelligence's United Kingdom Berries Market Size Compared With Other Published Estimates
Published market values for UK berries can look far apart because the underlying scope is not always the same, and because price and volume assumptions get refreshed at different times. Some estimates mix fresh and frozen in one line, others stay closer to fresh consumption value, and currency timing can also shift the USD figure.
Import and export value patterns, together with production volumes and the implied USD per metric ton checks, are the evidence that keeps Mordor Intelligence's estimate tied to a realistic UK consumption pool instead of a broader retail priced basket. The spread also comes from how quickly price progression is updated when supply conditions change, and from whether adjacent fruit categories or extra channel markups are quietly added.
Benchmark comparison
| Source | Market Size | Gaps in Research Methodology |
|---|---|---|
| Mordor Intelligence | USD 2.72 B (2025) | |
| Industry Publisher A | USD 1.80 B (2024) | Often presented as a combined fresh and frozen value with a different base year, which can reduce comparability when the UK price level and currency timing shift between years. |
| Consultancy B | USD 1.62 B (2023) | Uses an earlier base year and a broader category framing that may rely more on stated growth rates, with less visibility on how trade and production volumes are used to anchor the demand pool. |
The table shows that most of the difference is explained by year selection and scope choices, especially around fresh versus frozen and the price basis used for value conversion. By keeping the steps traceable to production, net trade, and price signals, the model stays easy to audit and practical to update when conditions change.


Key Questions Answered in the Report
How large is the United Kingdom berries market in 2026?
The United Kingdom berries market size is USD 2.83 billion in 2026 and is projected to grow to USD 3.42 billion by 2031.
Which berry leads the United Kingdom sales?
Strawberries lead with 63.62% United Kingdom berries market share in 2025, supported by strong consumer preference and summer seasonality.
What is driving blueberry growth?
A 4.03% CAGR is fueled by health positioning, targeted retailer promotions, and investments that expand domestic capacity.
How are growers tackling labor shortages?
Leading farms adopt harvest robotics, protected-cropping, and super-high-density systems to reduce reliance on seasonal labor.
Why are energy prices a concern?
Electricity and gas account for up to 30% of greenhouse costs, making profitability sensitive to price spikes.
Can berry farms earn carbon credits?
Yes, regenerative practices eligible under the Sustainable Farming Incentive allow growers to access emerging agricultural carbon-credit markets.
Page last updated on:


 Your data is secure and never sold or shared.



