UK Virtual Cards Market Size and Share
Market Overview
| Study Period | 2020 - 2031 |
|---|---|
| Forecast Data Period | 2026 - 2031 |
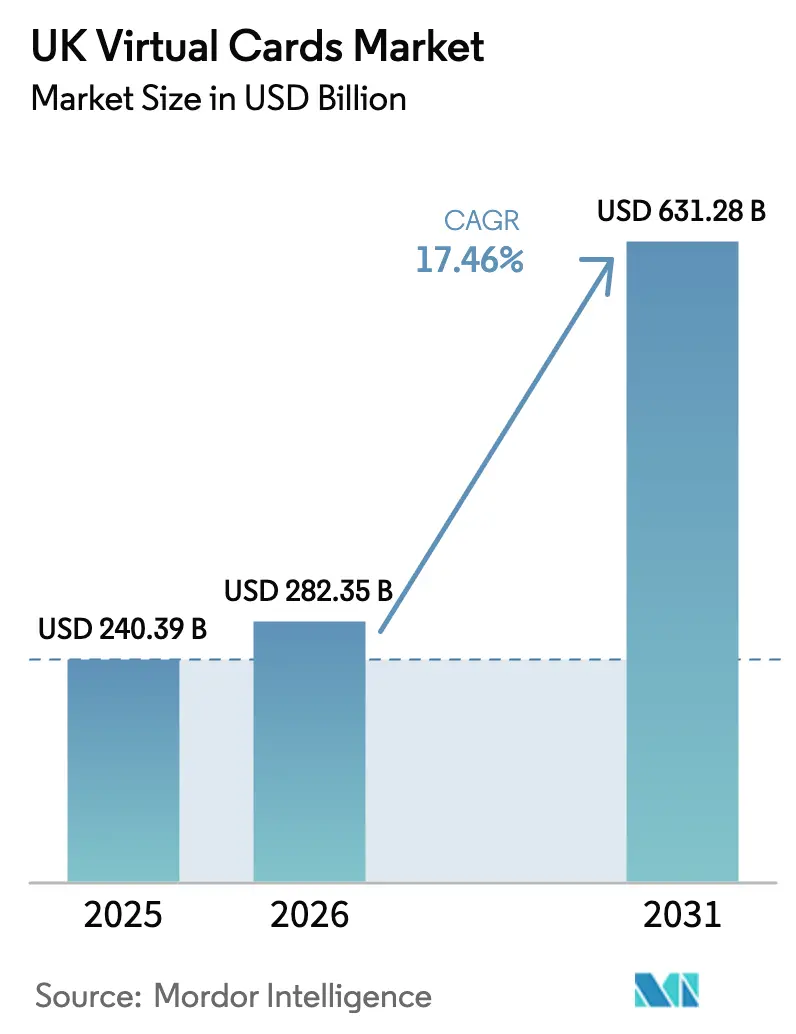
| Base Year Market Size (2025) | USD 240.39 Billion |
| Market Size (2026) | USD 282.35 Billion |
| Market Size (2031) | USD 631.28 Billion |
| Growth Rate (2026 - 2031) | 17.46% CAGR |
| Market Concentration | Medium |
Major Players *Disclaimer: Major Players sorted in no particular order Image © Mordor Intelligence. Reuse requires attribution under CC BY 4.0. | |
UK Virtual Cards Market Analysis by Mordor Intelligence
The UK virtual cards market size is expected to grow from USD 240.39 billion in 2025 to USD 282.35 billion in 2026 and is forecast to reach USD 631.28 billion by 2031 at 17.46% CAGR over 2026-2031. Growth is anchored in mandatory digital-tax reporting under HMRC’s Making Tax Digital (MTD) rules, ISO 20022 messaging upgrades that enrich reconciliation data, and rapid open-banking API uptake that slashes onboarding times for new issuers. Business users gravitate to single-use virtual cards for fraud mitigation, while SMEs embrace prepaid versions to impose strict budget ceilings. Tokenization programs now embedded at tier-1 banks further sharpen security and drive mainstream acceptance, and remote-payment functionality—useful for cross-border trade after Brexit—cements virtual cards as a strategic spend-control tool across corporate finance departments.
Key Report Takeaways
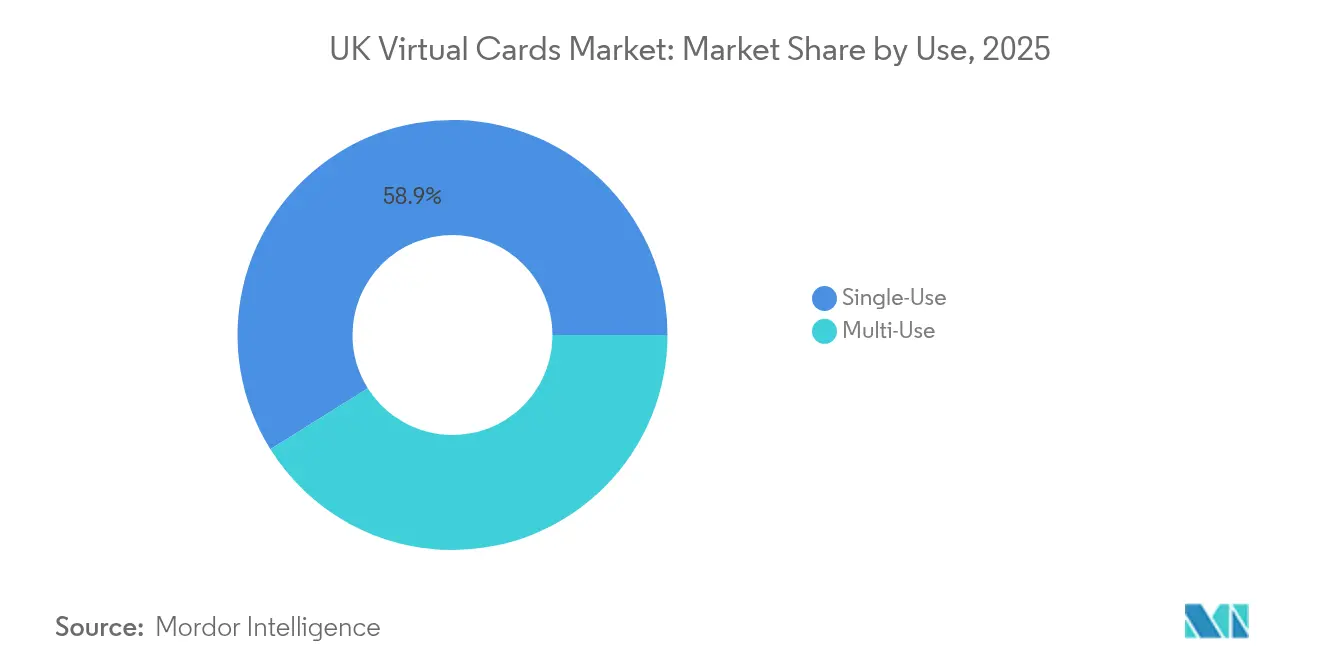
- By use, single-use cards captured 58.92% of the UK virtual cards market share in 2025 and are forecasted to expand at a 18.98% CAGR through 2031.
- By payment type, remote payments held 70.56% of the UK virtual cards market size in 2025 and are expected to advance at an 18.54% CAGR to 2031.
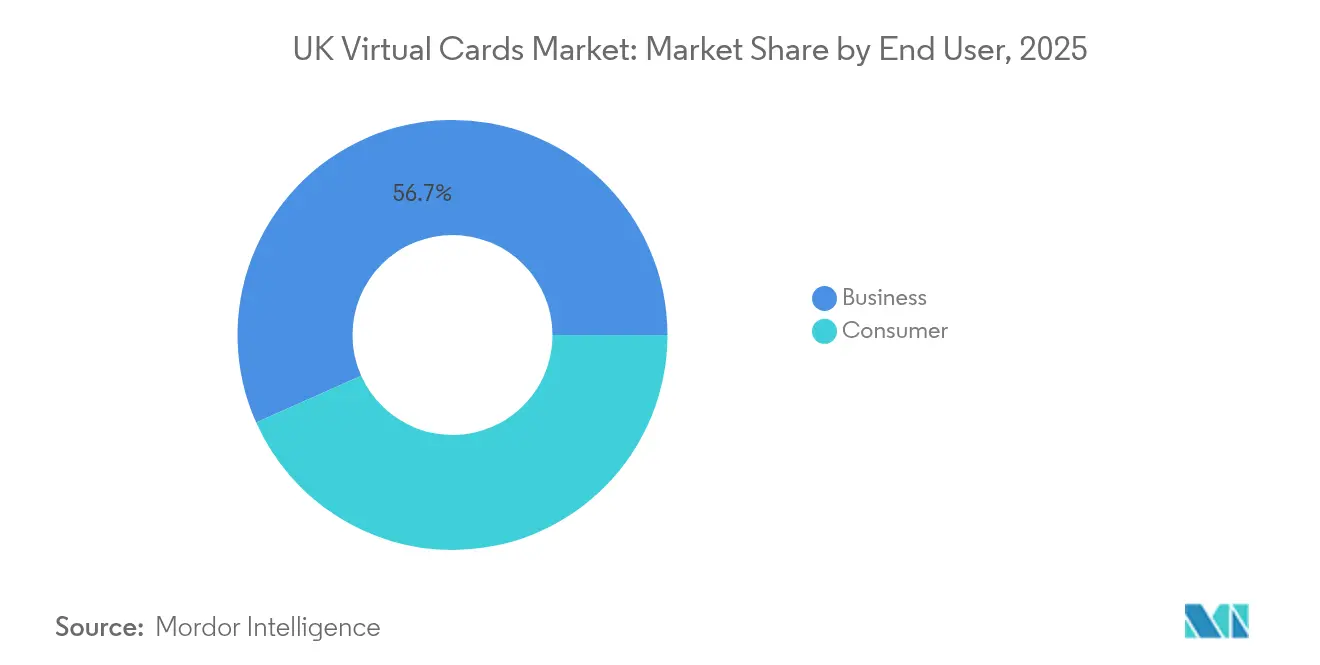
- By end user, the business segment commanded 56.68% of the UK virtual cards market share in 2025, with a projected 19.62% CAGR to 2031.
- By card type, virtual prepaid cards are set to post the fastest growth at an 18.24% CAGR, even though virtual credit cards retained a 47.35% share of the UK virtual cards market size in 2025.
Note: Market size and forecast figures in this report are generated using Mordor Intelligence’s proprietary estimation framework, updated with the latest available data and insights as of 2026.
UK Virtual Cards Market Trends and Insights
Drivers Impact Analysis*
| Driver | (~) % Impact on CAGR Forecast | Geographic Relevance | Impact Timeline |
|---|---|---|---|
| Rising SME demand for flexible B2B spend controls | +3.2% | UK-wide, strongest in London and Manchester | Medium term (2-4 years) |
| Mainstream push by tier-1 UK banks for tokenized issuance | +2.8% | National, led by London financial centers | Short term (≤ 2 years) |
| Open-banking APIs enabling instant KYC/BIN sponsorship | +2.1% | UK-wide, concentrated in fintech hubs | Short term (≤ 2 years) |
| Mandatory HMRC Making-Tax-Digital rules | +1.9% | National compliance requirement | Medium term (2-4 years) |
| ISO 20022 migration enriching data fields | +1.4% | Financial institutions and corporates | Long term (≥ 4 years) |
| Employee SaaS subscriptions needing single-use cards | +1.8% | Business centers, remote work settings | Short term (≤ 2 years) |
| Source: Mordor Intelligence | |||
Rising SME demand for flexible B2B spend controls
Small and mid-sized enterprises are prioritising granular spend limits, merchant-category blocking, and time-bound authorisations to keep tighter reins on cash flow as economic conditions remain volatile. The Crown Commercial Service confirmed GBP 3.52 billion in direct SME public-sector spend during 2024, underscoring the scale of transactions now moving to highly configurable payment rails[1]HM Revenue & Customs, “Making Tax Digital for VAT,” gov.uk. Finance teams also favour instant issuance because many employees work remotely and need digital-first tools to settle ad-hoc supplier invoices without waiting for plastic cards. Single-use virtual tokens are attractive because they lapse automatically, preventing forgotten subscriptions from draining budgets. Together, these control features position virtual cards as essential working-capital instruments for the UK’s 5.5 million SMEs.
Mainstream push by tier-1 UK banks for tokenized issuance
Lloyds Banking Group’s decision to migrate 10 million cards onto Visa’s token platform by 2026 signalled a systemic shift away from static PANs. Tokenisation reduces fraud exposure by replacing each card number with dynamic credentials that lose value immediately after use, a security upgrade now marketed aggressively to large corporate clients. Mastercard’s pledge to remove manual card entry from online checkouts by 2030 further accelerates issuer adoption, because banks need to meet merchant expectations for effortless payments. Early adopters benefit from easier ERP integration, allowing automated limit resets and richer data capture. As more banks deploy token frameworks, resistance among late movers is likely to erode quickly.
Open-banking APIs enabling instant KYC/BIN sponsorship
UK Finance recorded 8 million active open-banking users in 2024, with payment volumes growing 78.5% year on year, providing a ready infrastructure for real-time issuer connectivity[2]UK Finance, “Open Banking—Latest Adoption Statistics,” ukfinance.org.uk. Open APIs let fintechs perform identity checks and funding-source verifications in minutes, slashing onboarding time from the weeks previously required for manual processes. Because issuers can now plug directly into sponsor banks for BIN ranges, even small providers can launch virtual cards without a full banking license. Instant provisioning helps corporates spin up project-based cards as soon as a budget is approved. The streamlined model intensifies competition and broadens market access for niche virtual-card products.
Mandatory HMRC Making-Tax-Digital rules are increasing real-time receipt capture
Businesses over the GBP 85,000 VAT threshold must keep digital records and submit returns via MTD-compatible software, creating urgency for payments that automatically tag tax data at the point of sale. Virtual cards embed transaction metadata directly into accounting platforms, eliminating manual receipt uploads and reducing audit risk. From April 2024, the mandate will be extended to all VAT-registered firms, forcing more than 1 million companies to upgrade payment workflows. Integration with expense-management tools shields finance teams from penalties linked to late or inaccurate filings. As HMRC plans to bring Income Tax Self Assessment into MTD, demand for compliant virtual-card rails is set to deepen.
Restraints Impact Analysis*
| Restraint | (~) % Impact on CAGR Forecast | Geographic Relevance | Impact Timeline |
|---|---|---|---|
| Interchange-fee caps compressing issuer economics | -2.4% | UK-wide | Medium term (2-4 years) |
| Merchant mistrust around “card-not-present” fraud liability | -1.8% | Traditional retail sectors | Long term (≥ 4 years) |
| Patchy acceptance at legacy government suppliers | -1.1% | Procurement channels | Short term (≤ 2 years) |
| Consumer privacy pushback on token-level data sharing | -0.9% | Consumer-facing markets | Medium term (2-4 years) |
| Source: Mordor Intelligence | |||
Interchange-fee caps compressing issuer economics
The Payment Systems Regulator estimates UK merchants pay more than GBP 250 million annually in unexplained card-scheme fee increases, signalling likely caps that will erode issuer margins[3]Payment Systems Regulator, “Card Scheme Fees Market Review,” psr.org.uk. Mastercard has already raised cross-border acquiring fees, amplifying the concern that revenue per transaction will fall further. Smaller virtual-card providers, lacking volume discounts, may need to pivot towards subscription pricing or premium analytics to stay profitable. Investor appetite could wane if margin pressure intensifies, spurring consolidation among sub-scale issuers. Conversely, large banks see an opportunity to leverage economies of scale and absorb volume from struggling fintechs.
Persistent merchant mistrust around card-not-present fraud liability
Remote-purchase fraud climbed 22% in 2024, feeding scepticism among bricks-and-mortar retailers asked to accept virtual cards for distance sales. Even with Strong Customer Authentication in place, merchants fear costly chargebacks and delayed settlements. Some suppliers, therefore, mandate bank transfers, undermining the universality of virtual-card programmes. Issuers are countering with fraud-scoring APIs and insurance products, but uptake remains slow outside digitally savvy sectors. Until education narrows this trust gap, acceptance constraints will cap growth potential.
*Our forecasts treat driver/restraint impacts as directional, not additive. The impact forecasts reflect baseline growth, mix effects, and variable interactions.
Segment Analysis
By Use: Single-use cards drive security-first adoption
Single-use virtual cards captured 58.92% of the UK virtual cards market share in 2025, expanding at a projected 18.98% CAGR to 2031 as finance teams prioritize one-time credentials that shut after settlement, eliminating the risk of stored-card compromise. Subscription SaaS growth amplifies this need because single-use tokens expire before unauthorized rebills can occur.
Multi-use tokens remain relevant for trusted suppliers on recurring contracts, yet adoption lags as companies weigh higher fraud exposure. Mastercard’s April 2024 wallet integration that pairs biometric authentication with real-time limit updates further propels single-use popularity. Across travel and ad-hoc spend, employees welcome the convenience of instant numbers delivered to mobile wallets, reinforcing robust demand in the UK virtual cards market.


By Payment Type: Remote dominance reflects a digital-first economy
Remote payments held 70.56% of the UK virtual cards market size in 2025 and will grow at an 18.54% CAGR to 2031, illustrating the preference for online procurement and cross-border supplier settlement after Brexit-driven fee complexities. The Office for National Statistics logged a rebound in foreign card spend during peak travel months, proving that businesses remain comfortable executing remote transactions that virtual cards facilitate.
Physical point-of-sale (POS) utilization lingers behind because many small merchants operate terminals lacking token acceptance. Revolut’s 2024 iPad POS application begins to close this gap, yet corporate buyers still lean on contact-free channels where virtual-card rails thrive. For importers paying EU vendors, remote virtual card numbers bypass bank-transfer delays, solidifying remote supremacy in the UK virtual cards market.
By End User: Business segment leads through compliance automation
Business users controlled 56.68% of the UK virtual cards market share in 2025 and are forecasted to grow 19.62% annually to 2031, energized by MTD’s compulsory digital record-keeping. Automated VAT coding embedded in transaction strings makes virtual cards attractive to finance teams seeking audit-ready data. Consumers adopt at a slower clip, deterred by established wallet preferences and limited education on virtual-card benefits.
Enterprise platforms now deliver approval workflows, budget dashboards, and ERP integrations unseen in consumer products, locking in corporate loyalty. Recent venture funding into CleverCards underscores investor belief in the enterprise-expense niche, sustaining momentum in this key slice of the UK virtual cards industry.
By Card Type: Credit cards lead while prepaid gains momentum
Virtual credit cards held a 47.35% stake in the UK virtual cards market in 2025, thanks to existing corporate credit lines and familiar underwriting, yet virtual prepaid instruments will outpace all others with an 18.24% CAGR to 2031. Tightening risk policies prompt finance leaders to ring-fence spend in prepaid wallets, trading float benefits for certainty and limiting exposure as missed credit-card payments rise, per FICO analytics.
Debit-based virtual cards fill niche scenarios where instant clearing is paramount, but market preference tilts towards prepaid for discretionary team budgets and towards credit for larger, strategically timed outlays. Government cancellation of traditional procurement cards is expected to nudge departments toward prepaid virtual variants offering granular privilege controls.
Geography Analysis
London anchors the largest share of the UK virtual cards market activity, supported by the city’s dense banking ecosystem and regulatory sandboxes nurturing payments innovation. Manchester’s fintech corridor follows, buoyed by open-banking pioneers that embed instant KYC and same-day issuing. Edinburgh’s historical banking base supplies tech talent and compliance expertise, rounding out the urban triad where adoption sits highest. Rural regions lag in merchant readiness and digital-transformation pace, yet government broadband upgrades promise to narrow this divide over the forecast horizon.
Northern Ireland shows early-stage virtual-card deployment among export-oriented SMEs seeking sterling-euro spend flexibility amid post-Brexit currency considerations. Scotland’s devolved public-sector digitization initiatives further open procurement channels as agencies pivot from physical cards to tokenized counterparts offering audit trails aligned with MTD. Wales, leveraging support programs for start-ups, records rising issuance from challenger banks operating branch-light models. Cross-border trade friction since Brexit sustains elevated demand for card-based settlement because SEPA-linked transfers incur new fees. Virtual cards streamline tax reclaim workflows and supply line-item clarity that simplifies customs declarations. The Bank of England’s exploration of a digital pound could later dovetail with token frameworks, giving regional issuers a head start in integrating central-bank digital currency rails. Overall, geographic adoption patterns underscore that digital infrastructure maturity and proximity to fintech hubs dictate penetration speed within the UK virtual cards market.
Competitive Landscape
The UK virtual cards market remains moderately fragmented. High-street banks—Lloyds, NatWest, HSBC, Barclays—wield established corporate relationships and balance-sheet scale to bundle virtual cards with cash-management suites. Challenger banks such as Revolut, Monzo, and Starling differentiate through instant onboarding, fee transparency, and user-experience design that resonates with digital-native SMEs. Payment-network partners Visa and Mastercard catalyze convergence through tokenization mandates, forcing both incumbents and newcomers onto convergent security architectures.
Strategic themes concentrate on open-banking data leverage, with providers layering spend analytics atop transaction streams to create value-added dashboards. Partnerships proliferate: Worldpay and Mastercard rolled out a travel-sector virtual-card program in November 2024, tackling multi-currency settlement pain points for agencies. Fintechs target public-sector renewal opportunities after the Cabinet Office curtailed physical procurement-card issuance, pitching virtual solutions that promise spend ceilings and auto-reconciliation.
Patent-filing trends reveal intensifying R&D on digital identity proofing and blockchain-anchored credential storage from companies including Microsoft and Bank of America. Consolidation pressure may rise as interchange-fee scrutiny renders sub-scale issuers less profitable. Yet open-API access keeps market-entry barriers low, ensuring a dynamic mix of providers contends for share inside the UK virtual cards market through 2030.
UK Virtual Cards Industry Leaders
Revolut
Monzo
Starling Bank
Barclaycard Payments
HSBC UK
- *Disclaimer: Major Players sorted in no particular order


Recent Industry Developments
- March 2025: UK government issues GBP 49 million tender to enhance GOV.UK Pay with open-banking rails, broadening digital payment options for 1,000+ public services.
- November 2024: Worldpay partners with Mastercard on a virtual-card solution for travel agencies, easing supplier payouts across multiple currencies.
- November 2024: Revolut unveils 2025 roadmap featuring an AI financial assistant, digital mortgages, and European ATM roll-outs.
- June 2024: Lloyds extends a 40-year Visa partnership, planning to migrate 10 million credit cards to Visa rails by 2026.


Research Methodology Framework and Report Scope
Market Definitions and Key Coverage
Our study defines the United Kingdom virtual cards market as all token-based debit, credit, and prepaid card credentials issued on U.K. BINs that exist only in a digital form and are provisioned to mobile wallets or delivered as single-use card numbers for remote or B2B spend. Substitute payment tokens tied to crypto wallets or buy-now-pay-later vouchers are excluded.
Scope Exclusion: gift e-vouchers and closed-loop store charge cards sit outside this assessment.
Segmentation Overview
- By Use
- Single-Use
- Multi-Use
- By Payment Type
- Remote Payments
- POS Payments
- By End User
- Consumer
- Business
- By Card Type
- Virtual Debit Card
- Virtual Credit Card
- Virtual Prepaid Card
Detailed Research Methodology and Data Validation
Primary Research
Mordor analysts interviewed U.K. card processors, challenger-bank product leads, large retailers, and payment-gateway integrators across London, Manchester, and Belfast. These discussions clarified average interchange yields, SME adoption pain points, and likely open-banking substitution rates, letting us test secondary numbers and fine-tune scenario drivers.
Desk Research
We gathered macro indicators and usage statistics from tier-one public sources such as the Bank of England payment statistics, UK Finance's annual "UK Payment Markets" series, HM Treasury open-banking dashboards, and the FCA's card-issuer register, supported by scholarly articles from journals like Electronic Commerce Research. Company 10-Ks, IPO filings, and fintech investor decks filled recent revenue and issuance data, while D&B Hoovers and Dow Jones Factiva supplied cross-checks on issuer financials. The sources cited are illustrative; many other public records underpinned data validation.
Market-Sizing & Forecasting
We applied a top-down build that starts with BoE card transaction values, removes cross-border and physical-card portions, and then layers virtual-card penetration ratios by use case before being further filtered through issuer fee economics. Bottom-up roll-ups of sampled fintech issuance volumes and blended ASPs helped sanity check the totals. Key variables include: - share of e-commerce in total retail sales, - SME accounts payable volume, - active open-banking users, - contactless payment limits, - U.K. interchange fee caps.
A multivariate regression links these drivers to historical virtual-card uptake, and the resulting equation feeds an ARIMA overlay to capture near-term shocks. Gaps in issuer disclosures were bridged through weighted averages from primary interviews.
Data Validation & Update Cycle
Outputs pass three-layer peer review, anomaly flags trigger re-contact of sources, and currency bases are locked to quarterly average GBP-USD rates. Reports refresh each year, with interim updates when material regulatory or macro events occur. Before release, an analyst reruns the model so clients receive the freshest baseline.
Why Mordor's UK Virtual Cards Baseline Commands Reliance
Published estimates vary because firms pick different card types, fee assumptions, and refresh cadences.
Our disciplined scope, transparent driver set, and annual model reruns keep Mordor's figure dependable, whereas others may snapshot older data or omit single-use corporate volumes.
Benchmark comparison
| Market Size | Anonymized source | Primary gap driver |
|---|---|---|
| USD 240.39 bn (2025) | Mordor Intelligence | - |
| USD 1.45 bn (2024) | Global Consultancy A | narrower scope limits to consumer credit credentials |
| USD 3.20 bn (2024) | Regional Consultancy B | excludes multi-use B2B cards and applies conservative ASP |
Estimates differ chiefly on whether business virtual debit flows and tokenized one-time cards are counted. By anchoring on verified payment system totals and reconciling both issuer and merchant lenses, Mordor delivers a balanced, traceable baseline that decision makers can trust.


Key Questions Answered in the Report
What is driving the rapid growth of the UK virtual cards market?
Regulatory digitization under HMRC’s Making Tax Digital rules, widespread tokenization by major banks, and strong SME demand for tight spend controls collectively push the market toward a 17.46% CAGR over the forecast period.
Which virtual-card segment is expanding the fastest?
Single-use tokens lead with a 18.98% CAGR because they eliminate stored-card fraud risk and curb unauthorized SaaS renewals.
How large is the remote-payment opportunity?
Remote payments already account for 70.56% of the UK virtual cards market size and will grow nearly 18.54% annually through 2031 as online procurement and cross-border trade accelerate.
Why are prepaid virtual cards gaining momentum with businesses?
Prepaid instruments cap potential losses, support budget certainty, and sidestep rising credit-risk concerns, fueling an 18.24% CAGR in the prepaid segment.
What regulatory changes could affect issuer profitability?
The Payment Systems Regulator’s review of scheme and interchange fees may cap revenue per transaction, urging issuers to develop subscription models or analytics upsells.
How fragmented is the competitive field?
High-street banks and challenger fintechs share the stage, signifying moderate concentration that still leaves room for niche specialists.
Page last updated on:


