
United Kingdom Mutual Fund Market Size and Share
Market Overview
| Study Period | 2020 - 2031 |
|---|---|
| Forecast Data Period | 2026 - 2031 |
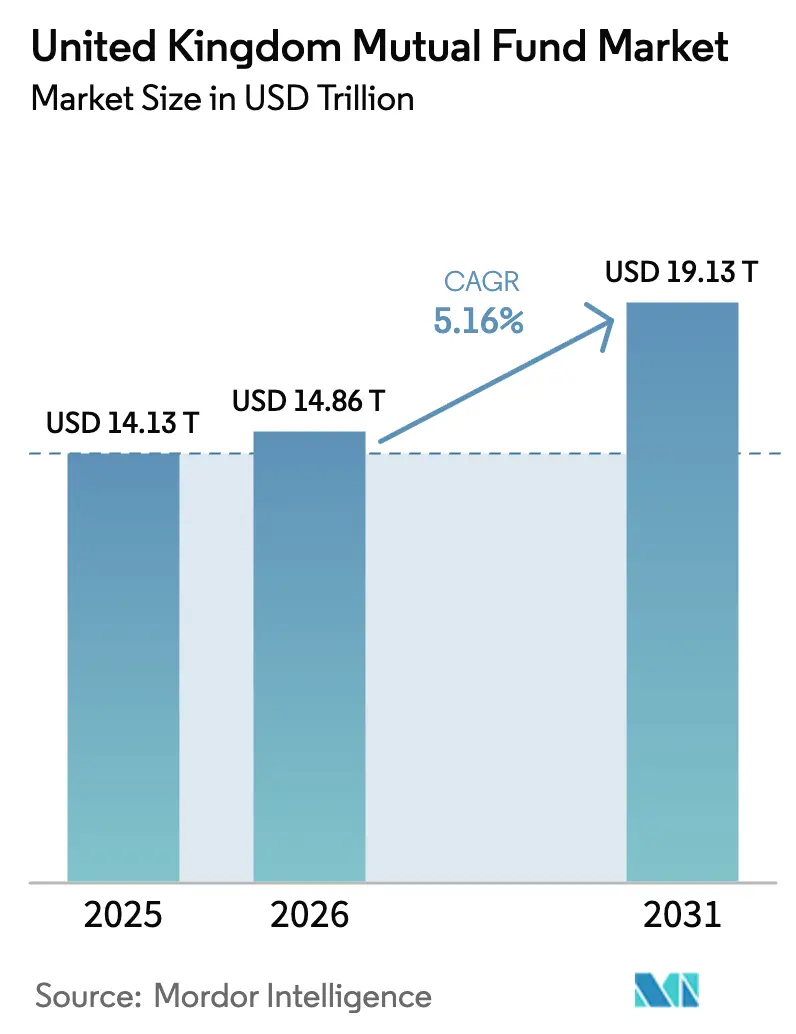
| Base Year Market Size (2025) | USD 14.13 Trillion |
| Market Size (2026) | USD 14.86 Trillion |
| Market Size (2031) | USD 19.13 Trillion |
| Growth Rate (2026 - 2031) | 5.16 % |
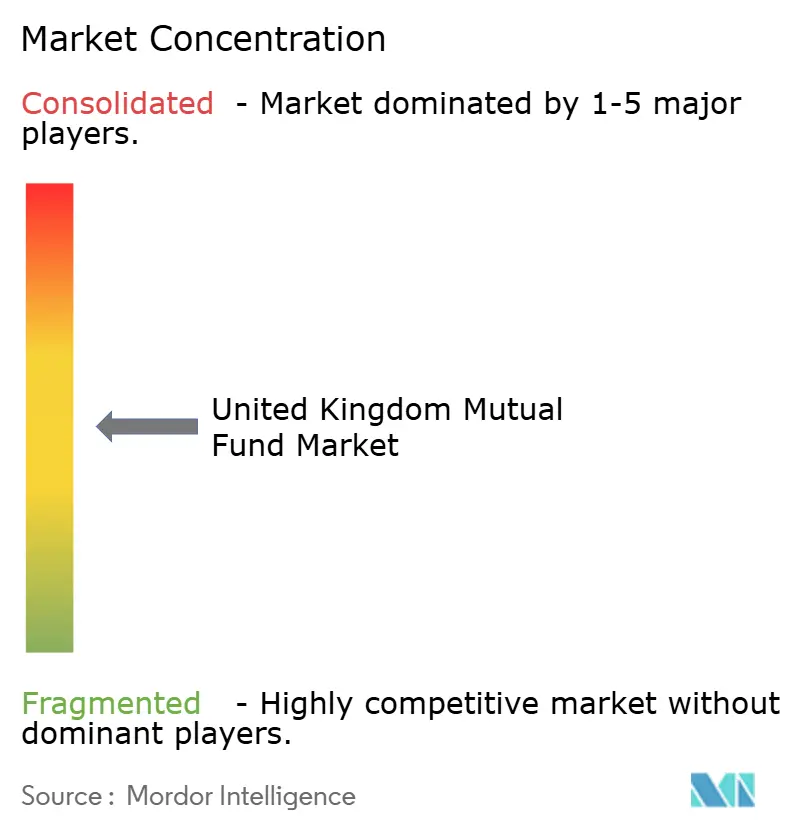
| Market Concentration | Medium |
Major Players *Disclaimer: Major Players sorted in no particular order Image © Mordor Intelligence. Reuse requires attribution under CC BY 4.0. | |
United Kingdom Mutual Fund Market Analysis by Mordor Intelligence
The United Kingdom mutual fund market size is expected to grow from USD 14.13 trillion in 2025 to USD 14.86 trillion in 2026 and is forecast to reach USD 19.13 trillion by 2031 at 5.16% CAGR over 2026-2031. Robust pension reform, technology-driven distribution, and regulatory modernization are converging to sustain this growth trajectory. The Financial Conduct Authority’s Consumer Duty framework is reshaping fee structures, while the Mansion House Compact channels long-term capital into growth equity [1]Investment Association, “Fund outflows slashed 2024; cautious optimism prevails among investors,” theia.org. . Fee compression is strengthening the appeal of tracker funds, yet product innovation in private-market access vehicles is widening the menu for risk-aware investors. Rising adoption of fund tokenization and AI-enabled portfolio construction improves operational resilience and personalizes retail offerings. Steady policy support for sustainability disclosures further underpins confidence in environmental, social, and governance products.
Key Report Takeaways
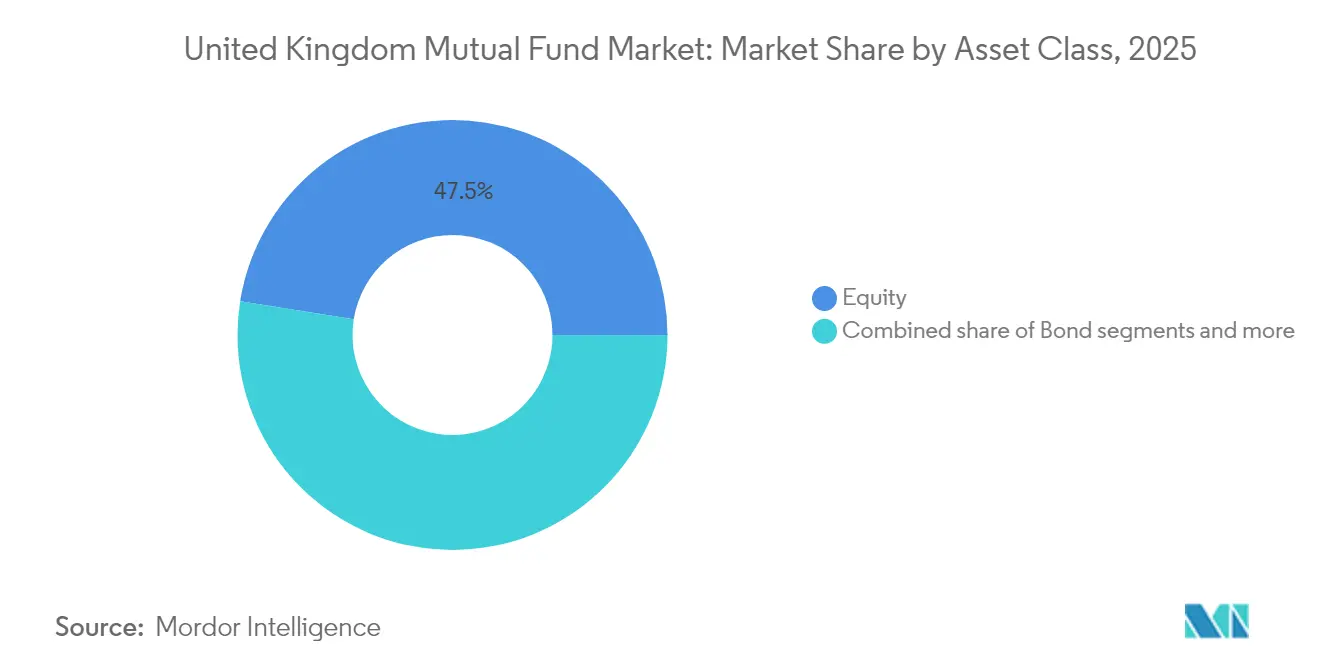
- By asset class, equity funds led with 47.50% of the United Kingdom mutual fund market share in 2025; Long-Term Asset Funds are forecast to grow at a 12.19% CAGR through 2031.
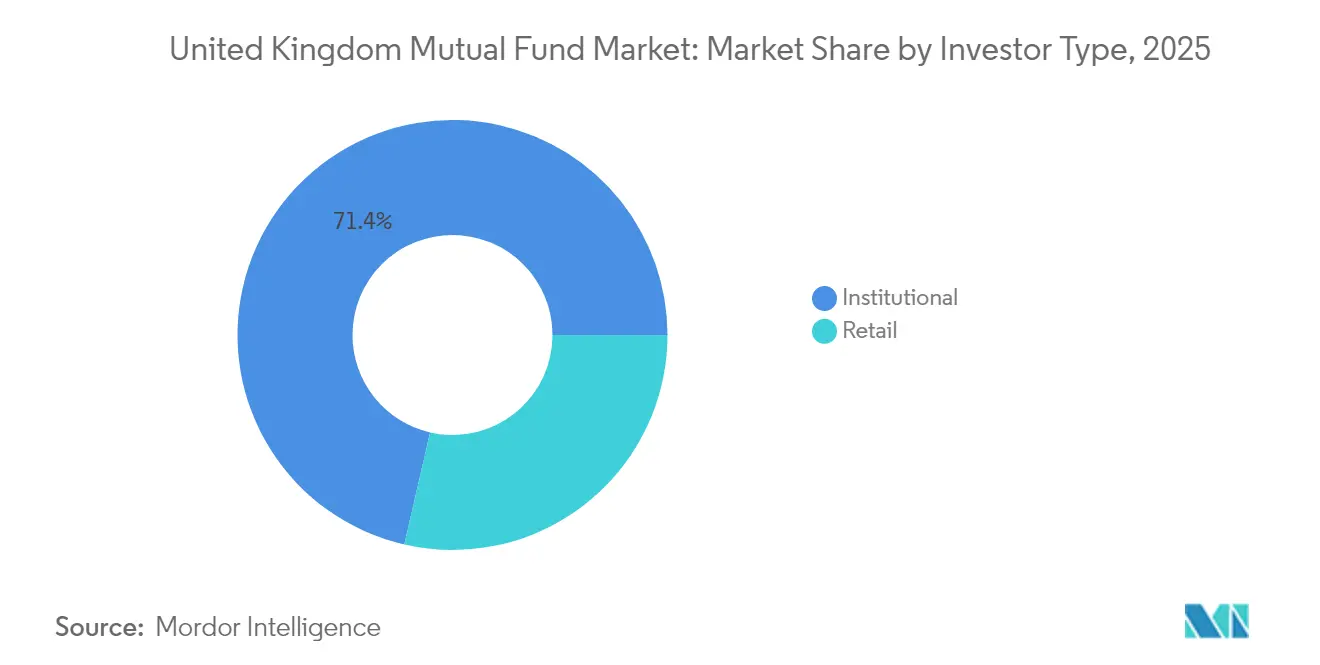
- By investor type, institutional mandates accounted for 71.40% of the United Kingdom mutual fund market size in 2025, while retail flows are projected to expand at a 7.06% CAGR through 2031.
- By distribution channel, online platforms captured 53.60% of the United Kingdom mutual fund market share in 2025, and they are advancing at a 9.62% CAGR to 2031.
Note: Market size and forecast figures in this report are generated using Mordor Intelligence’s proprietary estimation framework, updated with the latest available data and insights as of 2026.
United Kingdom Mutual Fund Market Trends and Insights
Drivers Impact Analysis*
| Driver | (~) % Impact on CAGR Forecast | Geographic Relevance | Impact Timeline |
|---|---|---|---|
| Shrinking retail cash hoards redirected into funds by FCA “excess-cash” initiative | +1.2% | England & Wales core, spillover to Scotland | Medium term (2-4 years) |
| Defined-contribution auto-enrolment glide-path upgrades favor multi-asset defaults | +1.8% | National | Long term (≥ 4 years) |
| Record tracker-fund inflows driven by fee compression and Consumer Duty disclosures | +1.5% | England & Scotland primary | Short term (≤ 2 years) |
| Pension fund Mansion House Compact to shift 5% of assets into UK growth equity | +2.1% | England core, Northern Ireland emerging | Medium term (2-4 years) |
| AI-enabled hyper-personalized portfolio construction on direct-to-consumer platforms | +0.8% | England & Wales | Long term (≥ 4 years) |
| Emerging Long-Term Asset Fund structure opening private-market access | +1.3% | England primary, Scotland secondary | Medium term (2-4 years) |
| Source: Mordor Intelligence | |||
Shrinking retail cash hoards redirected into funds
Households accumulated sizeable cash positions during the pandemic, but rising inflation eroded deposit returns and spurred a hunt for yield. The FCA’s 2025 guidance on “excess-cash” nudges platforms to flag idle balances and suggest suitable investment options, unlocking fresh inflows to the United Kingdom mutual fund market. Digital prompts and risk-profiling tools simplify fund selection, while Consumer Duty rules ensure transparency around value for money. Banks are collaborating with asset managers to curate low-cost fund baskets, reinforcing the shift from deposits to investments. These behavioral changes are most visible in England and Wales, yet Scotland’s retail base is beginning to mirror the trend[2]Department for Work and Pensions, “Pension fund investment and the UK economy,” gov.uk.
Defined-contribution auto-enrolment glide-path upgrades favor multi-asset defaults
Automatic enrollment now covers more than 10 million workers and is pushing plan sponsors to upgrade default funds. Providers are embedding multi-asset building blocks that blend public and private investments, benefiting from scale purchasing power. The Mansion House Accord further pushes fiduciaries toward private-market allocations, enhancing diversification and return potential for long-term savers. Employers welcome the simplified lifecycle structure, while trustees appreciate the transparent fee mechanics stipulated by Consumer Duty. Over time, these strategies are expected to reduce retirement-outcome dispersion and anchor stickier institutional flows into the United Kingdom mutual fund market.
Record tracker-fund inflows driven by fee compression and Consumer Duty disclosures
Cost comparisons are now front-and-center on platform dashboards, spurring investors to favor low-expense index products. Vanguard’s direct-to-consumer channel exemplifies this trend by pairing zero-commission dealing with straightforward guidance. Active managers are responding by rationalizing share classes and introducing performance-linked pricing. The resulting fee war accelerates the adoption of transparent passive funds, reinforcing the price anchor across the industry. While margin pressure intensifies, scale players still benefit from operating-cost leverage and global replication of successful passive franchises.
Pension fund Mansion House Compact to shift 5% of assets into UK growth equity
The 2025 Mansion House Compact rallied leading schemes to channel at least 5% of portfolios toward domestically listed growth companies. This initiative aims to revitalize local capital markets and stave off delistings prompted by foreign listings. Asset managers are launching engagement-focused UK equity funds aligned with stewardship codes that emphasize sustainable earnings quality and governance. Index providers are also exploring bespoke UK growth composites to benchmark performance. As allocation deadlines loom, demand for small- and mid-cap research coverage is rising, encouraging brokers to expand equity-research capacity.
Restraints Impact Analysis*
| Restraint | (~) % Impact on CAGR Forecast | Geographic Relevance | Impact Timeline |
|---|---|---|---|
| Persistent retail outflows from UK-equity funds despite valuation discounts | −1.4% | England & Scotland primary | Short term (≤ 2 years) |
| High concentration of platform distribution fees squeezing active-manager margins | −0.9% | England core, Wales secondary | Medium term (2-4 years) |
| Rising operational costs from Consumer Duty & Sustainability Disclosure Requirements | −1.1% | National | Short term (≤ 2 years) |
| Regulatory capital strain on small boutiques under IFPR harms product innovation | −0.7% | England & Scotland boutique managers | Long term (≥ 4 years) |
| Source: Mordor Intelligence | |||
Persistent retail outflows from UK-equity funds despite valuation discounts
Domestic equities trade at notable discounts to U.S. peers, yet sentiment remains subdued. Brexit aftershocks and macro sluggishness deter retail allocations, while global ETFs offer diversified exposure at lower cost. Headline underperformance perpetuates a negative feedback loop, with press coverage reinforcing outflow momentum. Although the Mansion House Compact aims to reverse this, retail behaviors respond slowly to policy signaling. Re-engaging investors will require tangible evidence of earnings resilience among UK-listed firms.
High concentration of platform distribution fees squeezing active-manager margins
Three dominant supermarkets negotiate rebate structures that erode headline fees, particularly for boutique stock-pickers. Active managers struggle to pass through research costs post-MiFID II unbundling, widening the gap between list and realized margins. Some respond by launching lower-cost quant products, while others pivot to institutional segregated mandates. The FCA’s scrutiny of platform-pricing spreads may encourage fairer economics, but near-term pressure on profitability persists. Larger houses with multi-channel reach wield stronger bargaining power, intensifying competitive imbalance[3]Office for National Statistics, “Regional gross disposable household income,” ons.gov.uk.
*Our forecasts treat driver/restraint impacts as directional, not additive. The impact forecasts reflect baseline growth, mix effects, and variable interactions.
Segment Analysis
By Asset Class: Equities dominate but private-market vehicles accelerate
By Investor Type: Institutional weight remains decisive while retail acceleratesEquity funds captured 47.50% of the United Kingdom mutual fund market in 2025, supported by widespread index adoption and institutional allocations. Bond funds accounted for 24.20%, buoyed by liability-driven investments and gilt issuance. Hybrid strategies held 18.10% as target-date solutions became the default for auto-enrolled savers. Money-market products remained at 7.10% amid persistent low policy rates. The “others” bucket—primarily Long-Term Asset Funds—claimed just 3.10% yet is projected to post a 12.19% CAGR through 2031. This pace suggests private-asset vehicles will eat into traditional equity shares, but diversification benefits should empower investors to blend both. Active equity teams are therefore emphasizing stewardship initiatives to retain relevance and defend fee levels.
Historically, equity funds weathered 2019-2024 shocks thanks to broad-based recovery rallies and consistent pension-scheme inflows. Fixed-income allocations grew after the 2022 gilt crisis, when schemes retooled risk budgets. Momentum behind LTAFs stems from the search for yield, retail appetite for real-asset exposure, and regulatory safeguards that calm liquidity worries. Technology also matters; tokenized share classes promise near-instant settlement, lowering administration costs for illiquid holdings. Overall, diversification across asset classes underpins the resilience of the United Kingdom mutual fund market.



By Investor Type: Institutional weight remains decisive while retail accelerates
Institutional mandates represented 71.40% of the United Kingdom mutual fund market size in 2025, reflecting the scale of corporate pensions and insurance general accounts. Retail channels claimed 28.60% but are expanding faster as digital platforms democratize access. Consumer Duty-driven transparency supports this shift by empowering self-directed investors to compare outcomes. Auto-enrolled employees increasingly top up contributions via mobile dashboards, blurring lines between workplace and retail flows. Meanwhile, professional investors are reshaping portfolios toward private markets, boosting the United Kingdom mutual fund market share of alternative strategies.
Institutional flows continue to grow steadily, bolstered by longevity risk management and incremental contribution rates. However, fee renegotiations remain intense, particularly for active mandates facing performance dispersion. Retail growth is forecast at 7.06% CAGR through 2031, amplified by the inclusion of LTAFs in Stocks & Shares ISAs. Cross-selling of ESG funds also widens appeal, with marketing tailored to younger demographics. The interplay between institutional stability and retail momentum adds depth to liquidity profiles across fund structures.
By Distribution Channel: Digital dominance reshapes economics
Online supermarkets occupied 53.60% of the 2025 distribution pie, setting the benchmark for speed, transparency, and pricing discipline. Financial advisers captured 27.80%, providing holistic planning for complex needs such as pension transfers. Banks held 12.00%, constrained by capital rules that incentivize fee-based advisory over balance-sheet product manufacturing. Direct sales from fund houses accounted for 6.60%, largely institutional segregated accounts and niche thematic launches. From 2026-2031, online channels are poised for a 9.62% CAGR, reinforcing their central role in the United Kingdom mutual fund market.
Platform fee wars compress margins yet expand overall volumes as cost savings attract new investors. Consolidation is inevitable because smaller portals lack technology budgets to comply with Consumer Duty evidence requirements. Adviser models are evolving toward hybrid delivery, mixing digital onboarding with periodic human touchpoints. Banks leverage household brands to cross-sell investment accounts alongside mortgages and savings products. Direct channels now experiment with community-led education hubs to differentiate from price-only competition.
Geography Analysis
England commanded 81.10% of assets under management in 2025, sustained by London’s financial hub, robust household wealth, and dense corporate pension funding. Scotland followed with 8.20%, leveraging Edinburgh’s asset-management heritage and energy transition themes that attract sustainable-investment capital. Wales recorded 5.70% share, buoyed by Cardiff’s fintech ecosystem and cross-border advice networks that cater to affluent retirees. Northern Ireland held 5.00% yet delivered the fastest 6.38% CAGR outlook through 2031, aided by digital-skills programs and post-Brexit protocol stability, encouraging services trade.
Regional policy frameworks shape these dynamics. The City of London Corporation champions fintech sandboxes that feed England’s innovation pipeline, while the Scottish Government promotes green-finance incubators aligned with offshore-wind build-outs. Welsh authorities expand financial-literacy curricula to nurture home-grown investor participation. Northern Ireland’s Invest NI agency markets Belfast as a cost-effective operations base for global asset-servicing centers. As infrastructure improves, regional penetration of digital platforms should rise, spreading mutual-fund ownership beyond historic strongholds.
Economic indicators also differ: disposable household income per capita tops USD 37,000 in London versus USD 25,000 in Northern Ireland, influencing ticket sizes and product mix. Nevertheless, tax-advantaged wrappers such as ISAs standardize scopes for entry-level investing. Pension policy uniformity further harmonizes demand for target-date funds across regions. While England’s dominance will persist, growth hotspots in outlying nations amplify resilience and diversify the revenue base of the United Kingdom mutual fund market.
Regulatory Landscape
The United Kingdom mutual fund market runs on an FCA-led framework covering fund authorization, distribution, conduct, and disclosure, with HM Treasury setting the legislative perimeter for key regimes affecting asset managers and fund structures. In July 2026, HM Treasury and the FCA advanced a reform package for the UK Alternative Investment Fund Managers (AIFM) regime, including FCA consultation CP26/28, to modernize the post-Brexit rule set for managers and alternative funds that increasingly sit alongside traditional mutual fund offerings in multi-asset solutions.
At the same time, the FCA published CP26/26 in July 2026 proposing the Fund Reporting for Asset Management Entities (FRAME) framework to improve reporting consistency and data quality, with prototype reporting forms targeted before end-2026 and implementation targeted for 2028. The AIFM reform proposals introduce a three-tier categorization (small, medium, large) to replace the current system, with technical consultations running to October 14, 2026. This sequencing is likely to affect compliance costs and reporting expectations, as well as product governance for firms distributing both UCITS and alternative-access vehicles such as LTAFs.
Value Chain Analysis
The UK mutual fund value chain begins with product design and portfolio management by fund houses, then moves through fund administration, depositary and custody, transfer agency, and pricing/NAV production, with third-party data and risk oversight before distribution to end-investors via workplace and retail routes. Governance and rulemaking span HM Treasury and the Financial Conduct Authority, while the Investment Association provides an industry forum for member input and market standards, including feedback loops on the FCA FRAME (CP26/26) and AIFM (CP26/28) proposals released in July 2026.
Distribution and client servicing are concentrated in platforms and intermediaries. Major fund platforms and wrappers, including Fidelity, Hargreaves Lansdown, Quilter, Transact, and Aegon, shape shelf placement, ongoing charges visibility, and the economics of active versus passive strategies. That concentration raises the value of platform integrations, data readiness, and evidencing requirements under conduct expectations, while also tightening the link between operational resilience, standardized reporting, and the ability of managers, particularly boutiques, to compete on product innovation and price.
Competitive Landscape
The United Kingdom Mutual Fund Market demonstrates moderate concentration, where a small group of leading firms control a significant portion of total assets. This creates a competitive environment that balances the benefits of scale with the need for continuous innovation. BlackRock holds a leading position due to its dominance in index-tracking strategies and deep penetration into institutional pension schemes. Vanguard has gained rapid momentum in the retail space through its low-cost passive offerings and direct-to-consumer approach. Legal & General Investment Management capitalizes on its role as a default manager for defined contribution schemes and its close ties to an integrated insurance business. However, it is undergoing strategic restructuring through a merger with Legal & General Capital to form a unified global asset management arm targeting substantial long-term operating profits.
Consolidation within the UK mutual fund industry accelerated through 2024 and 2025, reflecting growing pressure for scale and specialization. Notable transactions include BlackRock’s acquisition of a major private market data and analytics provider, enhancing its capabilities in alternative assets. Other significant deals include Oaktree’s purchase of a prominent wealth manager and the formation of a large-scale joint venture between Phoenix Group and Schroders aimed at consolidating workplace pensions. These moves indicate a trend toward vertical integration and strategic partnerships in a maturing market. Firms are seeking to bolster both their retail and institutional offerings through targeted acquisitions and alliances. This consolidation is reshaping the competitive landscape and elevating the importance of differentiated capabilities.
Technology has emerged as a critical factor in competitive positioning across the United Kingdom Mutual Fund Market. Leading firms are increasingly deploying AI-driven portfolio construction tools, exploring tokenised fund structures, and building robust digital distribution platforms. These innovations help attract cost-sensitive retail investors while maintaining strong institutional relationships. The strategic alliance between Wellington, Vanguard, and Blackstone highlights a growing industry shift toward collaboration across public and private markets. Regulatory pressures, including new consumer protection rules, sustainability disclosure requirements, and operational resilience standards, are raising barriers to entry. However, these same regulations are also pushing established players to innovate in product design, compliance infrastructure, and client experience.
United Kingdom Mutual Fund Industry Leaders
BlackRock
Vanguard
LGIM
Fidelity International
Schroders
- *Disclaimer: Major Players sorted in no particular order

Market Opportunities and Future Outlook
Fee transparency and platform-led cost comparisons keep expanding the addressable market for low-cost building blocks, particularly in passive strategies and model portfolios. In 2026, flow data provides demand signals: passive fund flows reached GBP 19.92 billion in H1 2026, and net retail sales into all funds totaled GBP 2.5 billion in May 2026, extending a run of seven consecutive months of inflows. These patterns support room for fund houses and platforms to broaden core ranges (index equity, bond, and multi-asset) while competing on implementation quality, tax-wrapper journeys, and portfolio construction focused on outcomes.
Product and distribution whitespace is also growing for investors that want bond exposure and managed-volatility profiles without losing daily-dealing mutual fund convenience. At the same time, access to private markets through regulated vehicles such as LTAFs is becoming more visible in product menus. 2026 fund-flow patterns show continued retail demand for fixed income and mixed-bond solutions through Q2 2026, while April 2026 included notable inflows into North American equity funds, indicating ongoing appetite for global diversification through UK-domiciled or UK-distributed funds. On the infrastructure side, the FCA FRAME initiative, with prototyping before end-2026 and implementation targeted for 2028, creates incentives for managers, administrators, and platforms to invest in higher-quality data pipelines and standardized reporting, which should reduce friction in fund onboarding, comparability, and supervised distribution.
Recent Industry Developments
- July 2026: Fidelity International secured admission to trading on the London Stock Exchange for the Fidelity Global HY Corp Bond Research Enhanced PAB UCITS ETF (ISIN IE000C1SVLJ9). The London listing expands access to a London-listed high-yield bond UCITS ETF for retail and institutional investors. It strengthens Fidelity's position in UK fixed income and broadens product access on public markets.
- July 2026: Fidelity International launched a London Bond Strategy backed by a £40 million mandate from the London Borough of Bromley Pension Fund. The strategy brings private-credit style fixed income exposure into a public-market vehicle. This expands institutional distribution and supports deeper engagement with the local market.
- July 2026: Schroders partnered with Nest to launch a £200 million dedicated venture capital sleeve for private market investments. The venture expands Schroders' exposure to private markets and venture capital through a strategic alliance. It adds diversification to the private-market platform and supports longer-term growth potential.


Research Methodology Framework and Report Scope
Market Definition and Coverage
For this report, the UK mutual funds market is measured as the total value of assets under management held in mutual fund vehicles that are distributed to investors in the United Kingdom, captured in USD for comparability across years.
Scope exclusions: This sizing does not treat listed closed-end investment trusts, direct pension plan assets outside fund wrappers, or pure advisory and platform service revenues as part of the mutual funds market value.
Segmentation Overview
- By Asset Class
- Equity
- Bond
- Hybrid
- Money Market
- Others
- By Investor Type
- Retail
- Institutional
- By Distribution Channel
- Banks
- Online Platforms
- Financial Advisors
- Direct
- By Region
- England
- Scotland
- Wales
- Northern Ireland
Data Sources, Market Sizing, and Validation
Desk Research
Desk work starts with building the demand and supply context for mutual funds in the UK, then aligning definitions across public datasets so the same assets are not counted twice. We rely on official and association series for fund assets and flows, plus regulator pages that clarify what qualifies as an authorized fund structure.
Typical inputs come from sources such as The Investment Association fund statistics, FCA publications on authorized and recognized funds and product sales reporting, and supporting macro series from the Bank of England and the UK Office for National Statistics. We also review fund manager annual reports, public factsheets, investor presentations, and reputable financial press for changes in product mix and fee trends. For stitching company-level context, we use paid subscriptions for company financials and news coverage, and we selectively check patent databases when product structuring or fund operations tooling changes matter. The desk sources mentioned here are illustrative, and many other public documents were also used for data collection, cross-checking, and clarification.
Primary Interviews and Surveys
Primary work is used to pressure test the desk assumptions, especially around what part of fund assets should be treated as in-scope and how cross-domiciled funds marketed into the UK are handled. We spoke with a mix of asset managers, distributors, and market intermediaries so the model reflects reporting practices, product demand shifts, and pricing behavior seen by different participants.
Distribution of primary research fieldwork respondents
| Company type | Respondent position |
|---|---|
| Top tier: 28% | CXOs: 18% |
| Mid tier: 50% | Functional/Unit leaders: 34% |
| Smaller Players: 22% | Managers: 48% |
Market-Sizing & Forecasting
Market sizing was built using a top-down and bottom-up approach where the total fund asset pool is first reconstructed from UK-focused fund statistics, regulator definitions of eligible fund structures, and the split between domestic and overseas distribution. Once the total pool was formed, it was adjusted for known overlaps such as funds-of-funds layering and reporting cutoffs that can distort totals in certain months.
To keep the numbers realistic, we corroborated the totals with selective bottom-up approximations, such as summing a sample of large fund ranges and checking whether implied AUM per fund and per manager stays within normal bands. Key inputs used in the model include fund assets under management trends, net retail sales and redemptions, equity versus fixed income allocation shifts, index-tracking share expansion, and the pace of GBP to USD conversion effects across the year. Where a data series was missing for a smaller category, gaps were handled by using the closest public proxy series and then tightening the assumption through interview feedback.
For forecasting, scenario analysis was applied and then refined using a light multivariate regression that links asset growth to market return direction, net flow momentum, and rate-driven fixed income demand changes. The final forward view was checked so that the implied CAGR is consistent with what primary respondents described for investor risk appetite and distribution behavior over the forecast period.
Data Validation & Update Cycle
Validation happens in steps, starting with basic variance checks between independent public series and then moving to reasonableness tests on growth rates, allocation shifts, and implied per-fund averages. If a sudden jump shows up, we trace the drivers back to either a definition change, a one-off market move, or a reporting timing effect, then rework the inputs before finalizing the model.
We also run multi-level internal reviews so assumptions are consistent across chapters and the forecast logic follows the same market signals used in the historical build. When a material event occurs, such as a regulatory rule change or a major asset reallocation trend, we re-contact relevant respondents to confirm the likely impact. Reports are refreshed annually, with interim updates when needed, and a final pre-delivery pass is done so clients receive the most current view.
Mordor Intelligence's UK Mutual Funds Market Estimate Compared With Other Published Estimates
Published market values for UK mutual funds often differ because each publisher chooses a different starting dataset, currency timing, and what they treat as a mutual fund versus a broader investment fund universe. Differences also come from whether the figure is built from investor-held fund assets, manager-reported assets, or a mix of both.
The benchmark table shows a wide spread that is mostly explained by scope and conversion choices. In Mordor Intelligence's model, the market value is reported as total mutual fund AUM in USD, which helps separate UK mutual funds from other investment fund assets and keeps year-to-year comparisons consistent.
Benchmark comparison
| Source | Market Size | Gaps in Research Methodology |
|---|---|---|
| Mordor Intelligence | USD 14.13 T (2025) | |
| Industry Association A | USD 1.65 T (2025) | Often limited to member-reported UK domiciled fund totals, which can exclude non-member managers and does not aim to represent the full mutual fund opportunity used in broader market models. |
| Trade Journal B | USD 4.90 T (2025) | Some estimates use UK-managed investment fund assets that include a large share of overseas domiciled funds, which expands the pool beyond UK mutual fund holdings and can lift the value versus a UK-distribution-focused view. |
Reading the table together, the lower numbers tend to reflect narrower UK-domiciled reporting sets, while the higher numbers usually fold in overseas-domiciled funds managed from the UK. By keeping the unit of measure tied to mutual fund AUM and then checking it against flow and allocation signals, our sizing stays traceable to clear inputs and can be repeated when new annual data is released.


Key Questions Answered in the Report
What is the projected value of the United Kingdom mutual fund market in 2031?
The market is forecast to reach USD 19.13 trillion by 2031, reflecting a 5.16% CAGR.
Which asset class currently leads the United Kingdom mutual fund market?
Equity funds dominate with 47.50% of assets under management as of 2025.
How fast are online platforms growing in fund distribution?
Online platforms are expanding at a 9.62% CAGR, moving from 53.60% share in 2025 to a larger footprint by 2031.
What impact does the Mansion House Compact have on investment allocation?
It commits pension funds to direct at least 5% of assets toward UK growth equity, supporting domestic capital formation.
Why are Long-Term Asset Funds significant for retail investors?
LTAFs open access to private markets with FCA-regulated liquidity tools, offering new diversification opportunities.
Page last updated on:


 Your data is secure and never sold or shared.


