Market Overview
| Study Period | 2020 - 2031 |
|---|---|
| Forecast Data Period | 2026 - 2031 |
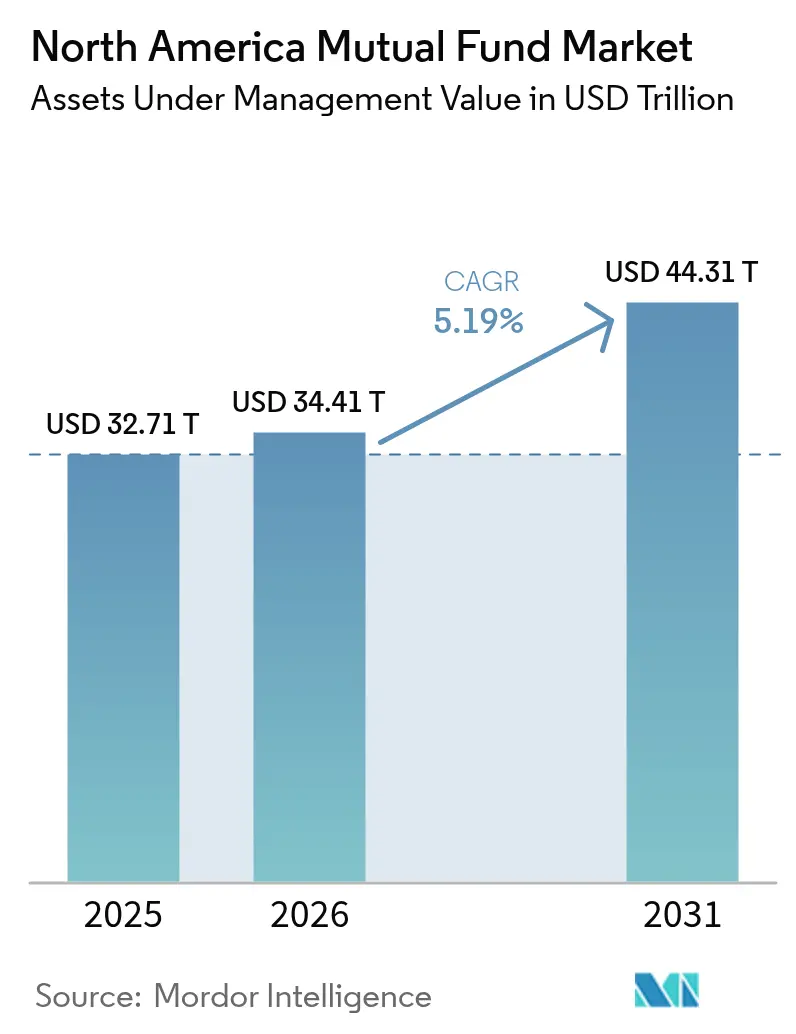
| Base Year Market Size (2025) | USD 32.71 Trillion |
| Market Size (2026) | USD 34.41 Trillion |
| Market Size (2031) | USD 44.31 Trillion |
| Growth Rate (2026 - 2031) | 5.19% CAGR |
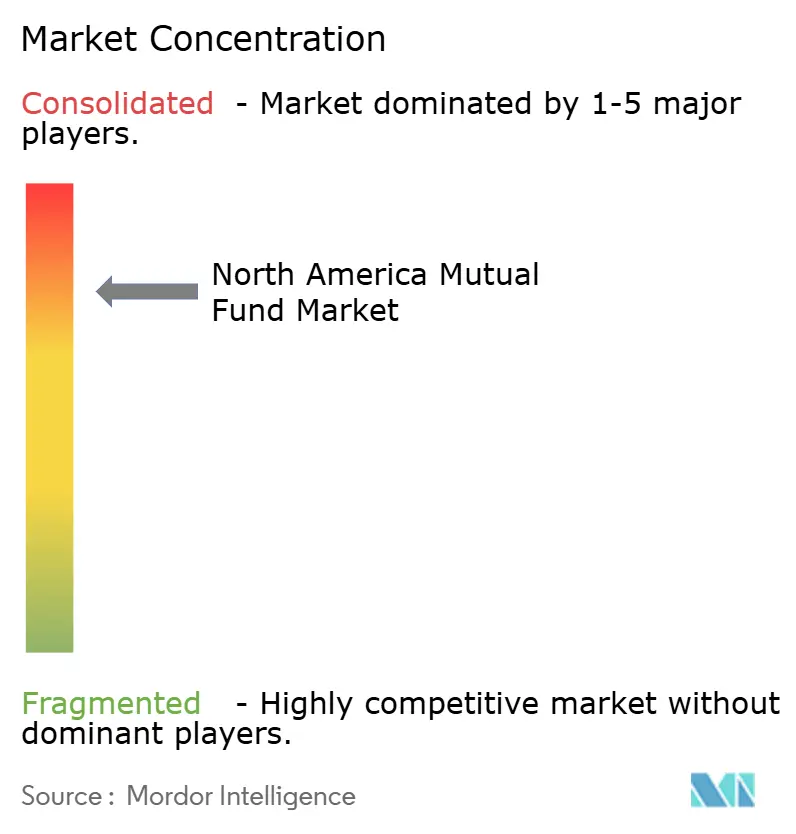
| Market Concentration | High |
Major Players *Disclaimer: Major Players sorted in no particular order Image © Mordor Intelligence. Reuse requires attribution under CC BY 4.0. | |
North America Mutual Fund Market Analysis by Mordor Intelligence
The North American mutual fund market size was valued at USD 32.71 trillion in 2025 and estimated to grow from USD 34.41 trillion in 2026 to reach USD 44.31 trillion by 2031, at a CAGR of 5.19% during the forecast period (2026-2031). Rising retirement‐plan contributions, a marked shift toward passive index strategies, and sustained demand for money market funds in a higher-rate environment collectively underpin this trajectory. Policy changes have also reshaped product design and distribution, most notably the 2024 U.S. money-market reforms that accelerated consolidation among large fund complexes. Rapid digital adoption is lowering advice barriers and widening access for younger investors, while regulatory latitude in Canada and demographic momentum in Mexico create fresh regional opportunity pockets. However, fee compression is nearing structural limits, compelling managers to pursue scale or specialized alpha to sustain margins.
Key Report Takeaways
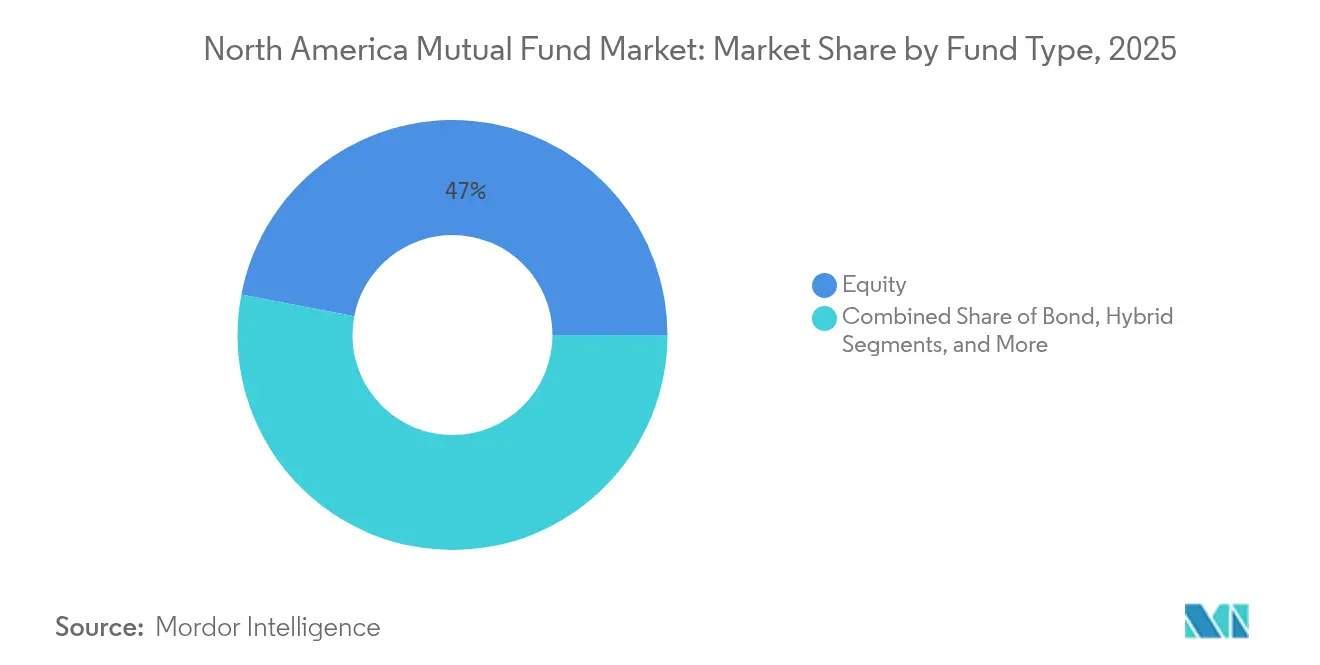
- By fund type, equity funds held 46.98% of North America mutual fund market share in 2025; the “Others” bucket, led by alternative strategies, is projected to post the fastest 9.63% CAGR through 2031.
- By investor type, retail investors commanded 66.28% of the North America mutual fund market size in 2025 and are set to grow at a 5.87% CAGR, outpacing institutional flows.
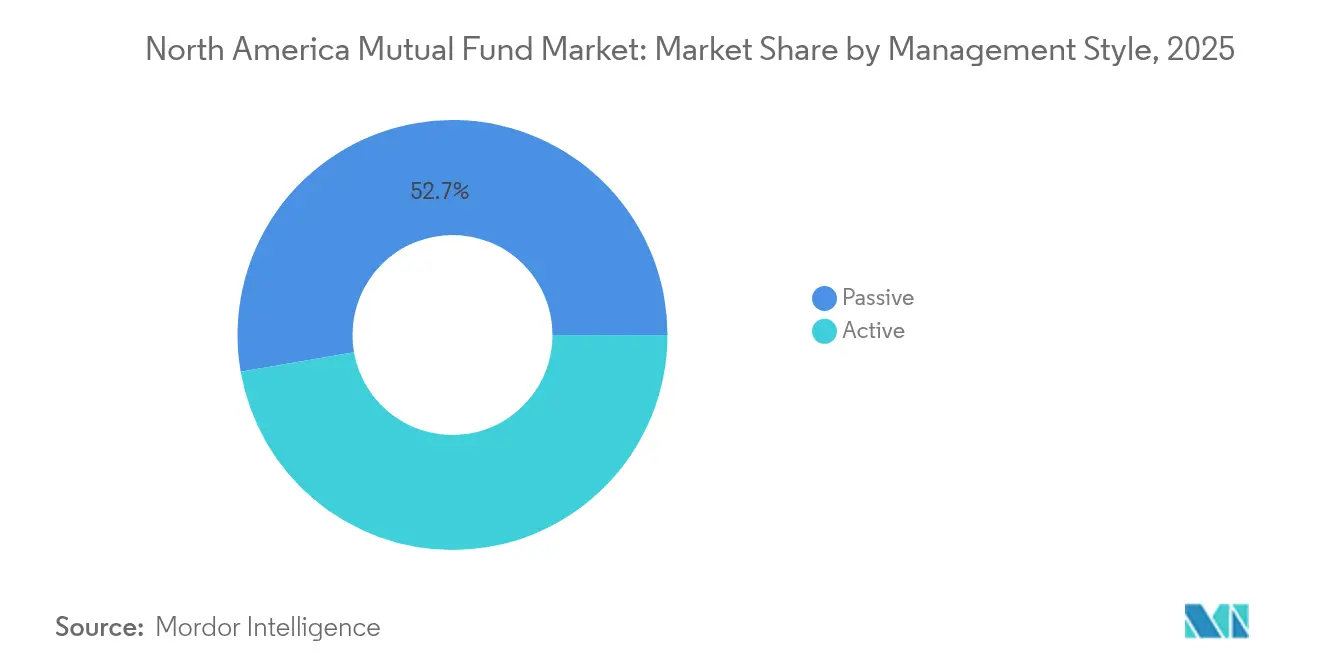
- By management style, passive products controlled 52.74% of assets of the North America mutual fund market in 2025, with a 5.64% CAGR expected through 2031.
- By distribution channel, securities firms led with a 36.55% share of the North America mutual fund market in 2025, whereas online trading platforms are forecasted to expand at a 7.22% CAGR to 2031.
- By country, the United States retained a dominant 91.08% share of the North America mutual fund market in 2025, while Mexico is on track for a 7.72% CAGR to 2031.
Note: Market size and forecast figures in this report are generated using Mordor Intelligence’s proprietary estimation framework, updated with the latest available data and insights as of 2026.
North America Mutual Fund Market Trends and Insights
Drivers Impact Analysis*
| Driver | (~) % Impact on CAGR Forecast | Geographic Relevance | Impact Timeline |
|---|---|---|---|
| Deposit-to-money-market migration amid higher policy rates | +1.2% | United States institutional segment | Short term (≤ 2 years) |
| Retirement-plan inflows into mutual funds & target-date series | +1.8% | United States and Canada | Long term (≥ 4 years) |
| Surge in passive index-based mutual funds & sleeve structures | +1.5% | Global, led by North America | Medium term (2–4 years) |
| Retirement-based auto-contributions anchor sticky inflows | +0.9% | United States and Canada | Long term (≥ 4 years) |
| Family-office uptake of private-credit interval funds | +0.6% | United States wealth centers | Medium term (2–4 years) |
| Canadian alt-fund derivative latitude boosts product innovation | +0.3% | Canada | Medium term (2–4 years) |
| Source: Mordor Intelligence | |||
Deposit-to-Money-Market Migration Amid Higher Policy Rates
The 2024–2025 easing cycle failed to stem the flow of bank deposits into money market funds, as investors prioritized yield and daily liquidity. Institutional prime funds shrank after the SEC’s October 2024 liquidity-fee rule, falling from 25 to 9 vehicles while assets declined by 49%[1]U.S. Securities and Exchange Commission, “Money Market Fund Reform,” sec.gov. Larger complexes with automated fee-calculation systems absorbed the change, widening the scale gap over niche managers. As money market yields stay attractive relative to deposits, the North American mutual fund market continues to channel short-term cash into low-risk funds, underpinning baseline asset growth.
Retirement-Plan Inflows into Mutual Funds & Target-Date Series
Target-date mutual funds surpassed USD 4 trillion in assets, aided by default enrollment rules that funnel new workplace contributions into age-based portfolios. The Department of Labor's 2007 regulations establishing target-date funds as qualified default investment alternatives created a structural tailwind that continues to drive growth. Their average annualized return of 7.3% over 15 years and falling expense ratios—now 29 basis points—reinforce stickiness. Vanguard, Capital Group, Fidelity, and T. Rowe Price dominate flows by coupling robust glide-path design with aggressive fee cuts, ensuring the continued expansion of passive-indexed share classes inside employer plans.
Surge in Passive Index-Based Mutual Funds & Sleeve Structures
Passive assets crossed the symbolic 50% threshold of total U.S. fund holdings, driven by defined contribution migration and ETF tax efficiency. This shift reflects the transition from defined benefit to defined contribution plans and the proliferation of ETF structures that offer superior tax efficiency and lower costs. Concentrated megacap weightings, however, challenge active managers to outperform benchmarks in large-cap spaces. Advisers increasingly rely on sleeve or model portfolios blending passive cores with niche active satellites, enabling specialist boutiques to win mandates in small-cap, credit, or thematic exposures while the North America mutual fund market tilts further toward low-fee indexing. The rise of sleeve structures and model portfolios has enabled advisors to combine passive core holdings with active satellite strategies, creating new opportunities for specialized managers who can demonstrate consistent alpha generation in less efficient market segments.
Family-Office Uptake of Private-Credit Interval Funds
The democratization of private markets through interval funds represents a significant structural shift, with major asset managers launching products to capture retail demand for alternative investments. Interval funds opened private credit to high-net-worth channels, reaching an estimated USD 220 billion asset base by 2025. Franklin Templeton’s USD 904.5 million FLEX fund launch illustrates strong demand for secondary private equity exposure through registered tender-offer vehicles. Vanguard’s tie-up with Blackstone and Wellington exemplifies hybrid portfolios combining listed and unlisted assets, indicating a structural broadening of product choice in the North American mutual fund market.
Restraints Impact Analysis*
| Restraint | (~) % Impact on CAGR Forecast | Geographic Relevance | Impact Timeline |
|---|---|---|---|
| Fee compression & margin squeeze leading to consolidation | -0.8% | United States passive segment | Medium term (2–4 years) |
| ETF & SMA cannibalization of traditional mutual fund flows | -1.1% | United States and Canada | Long term (≥ 4 years) |
| Complexity and cost of distribution shelf access | -0.4% | United States wealth channels | Medium term (2–4 years) |
| Boomer decumulation creating secular redemption overhang | -0.7% | United States and Canada retail | Long term (≥ 4 years) |
| Source: Mordor Intelligence | |||
Fee Compression & Margin Squeeze Leading to Consolidation
Average asset-weighted fund expenses fell to 0.34% in 2024 from 0.36% a year earlier as large managers passed through incremental savings to investors. Vanguard alone trimmed fees on 87 funds, reinforcing the deflationary race[2]Vanguard Group, “Vanguard Reduces Expense Ratios,” vanguard.com. A Carne Group survey reveals that 65% of asset management executives anticipate significant margin pressure over the next two years, with 73% of traditional managers planning to rationalize products, particularly actively managed public funds. With index expense ratios approaching zero, managers are pivoting toward active ETFs, alternatives, or scale-driven mergers—evidenced by Franklin Templeton’s integration of Putnam and BlackRock’s USD 12 billion HPS deal—to protect economics inside the North America mutual fund market.
ETF & SMA Cannibalization of Traditional Mutual Fund Flows
Citigroup projects ETFs could siphon USD 6 trillion–10 trillion in mutual-fund assets within ten years as investors prioritize liquidity and after-tax returns. Deloitte foresees a 13-fold rise in active ETF assets by 2035, signaling that wrapper choice rather than strategy governs new allocations. Mutual fund ownership among investors has declined from 72% in 2018 to 62% in 2023, with younger investors increasingly favoring self-directed investing and ETF structures. Separately managed accounts (SMAs) also gain favor among high-net-worth clients seeking transparency and customization, further pressuring legacy open-end structures.
*Our forecasts treat driver/restraint impacts as directional, not additive. The impact forecasts reflect baseline growth, mix effects, and variable interactions.
Segment Analysis
By Fund Type: Equity Dominance Faces Alternative Asset Disruption
Equity funds retained 46.98% of the North America mutual fund market share in 2025, reflecting their entrenched role in retirement and wealth portfolios. Bond funds attracted inflows amid higher yields, while money market offerings grappled with operational changes following SEC liquidity-fee mandates. The “Others” category—comprising interval, real-asset, and thematic funds—captured just a sliver of the North America mutual fund market size in 2025, yet is set to rise at a 9.63% CAGR through 2031 as investors hunt diversification and inflation hedges.
The democratization of private credit, real estate, and secondary strategies via registered interval structures is shifting allocations beyond public equities and core bonds. As target-date providers rebalance toward fixed income near retirement, equity weightings will gradually dilute, although tax-advantaged wrappers and megacap concentration keep equity funds pivotal to overall growth. Money market funds, despite fewer institutional prime options, continue to serve corporate treasuries and retail cash management needs, anchoring short-duration demand within the North American mutual fund market.


By Investor Type: Retail Resilience Anchors Market Growth
Retail investors held 66.28% of the assets of the North America mutual fund market share in 2025, driving a 5.87% CAGR outlook that outstrips institutional expansion. Automatic enrollment and escalation in 401(k) plans funnel predictable contributions, offsetting aging baby-boomer withdrawals. Online brokerages report 31% of retail customers trading funds digitally, signaling channel convergence between advice and self-direction.
Institutional buyers negotiate deeper fee breaks and bespoke mandates, pressuring traditional share classes while embracing collective trusts and SMA formats. Yet household savings trends among millennials and Gen Z support ongoing retail primacy. These cohorts favor mobile platforms and passive building blocks, influencing product design and marketing across the North America mutual fund market.
By Management Style: Passive Revolution Reaches Maturity
Passive style management controlled 52.74% of assets of the North America mutual fund market share in 2025, with a 5.64% CAGR through 2031 still eclipsing active growth. Scale efficiencies let index giants maintain near-zero fees, accelerating asset capture from cost-sensitive segments. Active managers focus on less efficient arenas—small-cap, international, and alternatives—where skilled security selection can justify higher pricing.
Active ETFs offer a hybrid route: daily transparency and tradability alongside discretionary security selection. Already 8% of U.S. ETF assets, these funds absorbed one-third of 2025 inflows, helping active shops repackage strategies without cannibalizing flagship mutual fund lines. As performance dispersion widens in niche corners, investors may recalibrate allocations, slowing passive encroachment within the North American mutual fund market.
By Distribution Channel: Digital Disruption Accelerates Platform Growth
Securities firms topped distribution with a 36.55% share in the North America mutual fund market in 2025, leveraging advisory depth and product breadth. Yet online trading platforms are forecasted to compound at 7.22% annually to 2031 as younger cohorts demand intuitive, low-cost execution. Charles Schwab’s integration of TD Ameritrade brought USD 115 billion net new assets in Q4 2024 alone, illustrating scale synergies.
Banks retain a conservative investor base but face erosion from robo-advisers that bundle automated planning with transparent pricing. Across channels, 95% of providers now deploy artificial intelligence to streamline onboarding and service, embedding technology as a core competitive requisite in the North American mutual fund market.
Geography Analysis
The United States accounted for 91.08% of the North American mutual fund market in 2025, supported by the world’s largest defined-contribution ecosystem and a mature regulatory regime under the Investment Company Act of 1940. Ongoing SEC modernization—such as revised N-PORT and N-CEN reporting—improves transparency while lowering compliance friction, sustaining industry scale advantages. Yet mutual-fund ownership slipped to 62% of households in 2023 as younger investors pivot to ETFs and direct indexing, foreshadowing slower organic growth. Fee wars are most acute in the United States, compelling consolidation and ancillary service expansion.
Canada represents a distinct regulatory laboratory. The Canadian Securities Administrators’ derivative and crypto proposals invite innovative strategies that may not yet be clear under U.S. rules. The Canadian Investment Regulatory Organization’s 2025 integrated fee model aims to align oversight costs with dealer size, potentially lowering barriers for boutique managers. Such flexibility could bolster cross-border flows as U.S. investors seek differentiated exposures.
Mexico is the region’s fastest-growing locale, projected at an 7.72% CAGR to 2031. A young population, an expanding middle class, and a domestic revenue orientation make Mexican equities defensive against global trade shocks. With market valuations implying 8.5% expected annualized U.S.–dollar returns, international firms continue to scale local distribution partnerships. Nevertheless, fund penetration remains low, requiring sustained investor-education and infrastructure build-out to capture the full promise within the North America mutual fund market.
Competitive Landscape
Large-scale managers dominate the North American mutual fund market through unrivaled distribution reach, data-driven operations, and fee leadership. Vanguard’s mutual ownership model channels operational savings straight to shareholders, reinforcing its virtuous-cycle asset growth while sustaining the industry’s lowest expense ratios. BlackRock counters with Aladdin-powered analytics and an aggressive push into private markets, punctuated by its USD 12 billion acquisition of HPS Investment Partners that created a USD 220 billion private-credit franchise [3]CNBC, “BlackRock to Acquire HPS Investment Partners,” cnbc.com.
Second-tier players compete via domain specialization. Fidelity leverages retirement-plan servicing and active research capabilities, while American Funds sustains advisor-centric distribution bolstered by long-tenured performance. T. Rowe Price emphasizes target-date and active equity prowess. Each is diversifying into alternatives or active ETFs to mitigate margin erosion.
Technology has become a decisive separator: AI-driven client profiling, straight-through processing, and cloud-native platforms shrink servicing costs and elevate user experience. Partnerships such as Vanguard’s alliance with Blackstone and Wellington offer retail investors institutional-grade private assets, underscoring a blurring line between public and alternative markets. Smaller firms face twin pressures of rising compliance spend and shelf-access costs; many pursue mergers or niche thematic mandates to survive. Franklin Templeton’s purchase of Putnam and Guggenheim’s sale of its equity funds to New Age Alpha illustrate rationalization trends within the North America mutual fund market.
North America Mutual Fund Industry Leaders
Vanguard
Fidelity Investments
American Funds
T. Rowe Price
BlackRock
- *Disclaimer: Major Players sorted in no particular order

Recent Industry Developments
- April 2025: Vanguard, Wellington Management, and Blackstone formed a strategic alliance to co-develop multi-asset solutions blending public and private markets, broadening retail access to private assets.
- February 2025: Franklin Templeton and Lexington Partners launched the Franklin Lexington Private Markets Fund (FLEX) with USD 904.5 million in initial assets, creating the first registered tender-offer secondaries strategy for U.S. wealth clients.
- December 2024: BlackRock acquired HPS Investment Partners for USD 12 billion, establishing a sizeable private-credit platform with USD 220 billion in assets
- May 2024: Franklin Templeton completed its Putnam Investments acquisition, boosting retirement capabilities and lifting total AUM to USD 1.55 trillion.


Research Methodology Framework and Report Scope
Market Definitions and Key Coverage
Our study treats the North American mutual fund market as the total pool of assets under management held by open-ended investment companies that issue redeemable shares to retail or institutional investors across the United States, Canada, and Mexico. Assets parked in exchange-traded funds, segregated mandates, private funds, or defined benefit pension plans are excluded from this scope.
Scope Exclusion: Money market-only trusts regulated outside mutual fund statutes are not counted.
Segmentation Overview
- By Fund Type
- Equity
- Bond
- Hybrid
- Money Market
- Others
- By Investor Type
- Retail
- Institutional
- By Management Style
- Active
- Passive
- By Distribution Channel
- Online Trading Platform
- Banks
- Securities Firm
- Others
- By Country
- United States
- Canada
- Mexico
Detailed Research Methodology and Data Validation
Primary Research
In-depth interviews with portfolio managers, fund auditors, distributors, and regulators across the three countries help us validate flows, fee compression trends, and retail penetration assumptions that secondary data alone cannot surface. Follow-up questionnaires capture average ticket sizes and channel shifts that feed our model calibration.
Desk Research
We begin by mapping the asset pool through trusted public sources such as the Investment Company Institute, the U.S. Securities and Exchange Commission's N-CEN filings, Statistics Canada's Investment Fund Survey, and Banco de México's asset reports. Trade associations like the Canadian ETF Association, policy papers from the Office of Financial Research, and audited fund prospectuses supply complementary asset splits and fee ratios. Where issuer-level data are thin, our analysts tap paid datasets, D&B Hoovers for sponsor revenues and Dow Jones Factiva for corporate actions, before stitching a coherent baseline. The references named illustrate core inputs; many additional publications underpin our evidence stack.
Market-Sizing & Forecasting
A top-down build starts with 2024 country AUM, reconstructed from production and trade data resets, and then cross-checked through sampled sponsor roll-ups (bottom-up). Key variables like net sales, average return, shift toward passive products, retirement plan contributions, interest-rate trajectory, and management fee glide path drive annual asset growth. Forecasts rely on multivariate regression that links net sales to disposable income and relative equity performance, with scenario analysis layering valuation shocks. Where sponsor roll-ups leave gaps, we prorate using average assets per account benchmarks before final triangulation.
Data Validation & Update Cycle
Outputs undergo variance checks against independent AUM dashboards; anomalies trigger peer review and additional callbacks. Mordor refreshes the dataset annually and issues interim updates after material events, ensuring clients see the latest vetted view.
Why Mordor's North America Mutual Fund Baseline Commands Trust
Published estimates rarely align because firms select differing asset pools, base years, and refresh rhythms. Our disciplined scope selection and yearly re-benchmarking minimize such drift.
Key gap drivers include: some publishers quoting only U.S. figures, others broadening to all asset-management pools, and a few measuring fee revenue rather than underlying assets. Mordor Intelligence anchors on regulated open-ended mutual funds only, applies uniform currency conversion, and rolls forward with validated net inflow assumptions.
Benchmark comparison
| Market Size | Anonymized source | Primary gap driver |
|---|---|---|
| USD 32.71 Trillion (2025) | Mordor Intelligence | - |
| USD 34.58 Trillion (2024) | Regional Consultancy A | Covers U.S. only; older base year; includes money-market trusts without asset-type filters |
| USD 71.20 Trillion (2025) | Global Consultancy B | Mixes mutual funds with mandates and alternatives, inflating totals |
| USD 0.59 Trillion (2024) | Industry Data Service C | Reports fee revenue, not asset pool, leading to understated value |
In sum, the comparison shows that once scope and metric mismatches are stripped away, Mordor's carefully bounded asset baseline offers decision-makers a balanced, transparent figure they can trace back to publicly auditable inputs and repeatable steps.


Key Questions Answered in the Report
What is the current size of the North America mutual fund market?
The market stands at USD 34.41 trillion in 2026 and is forecasted to reach USD 44.31 trillion by 2031.
Which fund type is growing fastest?
Alternative and specialty funds grouped under “Others” are projected to grow at a 9.63% CAGR through 2031, outpacing equity and bond segments.
How much of the market is now in passive strategies?
Passive products hold 52.74% of the North America mutual fund market assets and continue to expand at a 5.64% CAGR.
Why are money market funds attracting deposits despite lower rates?
Elevated policy rates still offer competitive yields over bank deposits, and regulatory reforms favor large, well-resourced sponsors that can handle new liquidity-fee rules.
Which geography is expanding the quickest?
Mexico leads with an expected 7.72% CAGR to 2031, supported by favorable demographics and growing capital-market infrastructure.
How are asset managers coping with fee compression?
Most pursue scale through mergers, diversify into active ETFs or private-market products, and deploy technology to cut operating costs and enhance client experience.
Page last updated on:


