Truck Platooning Market Size and Share
Market Overview
| Study Period | 2019 - 2031 |
|---|---|
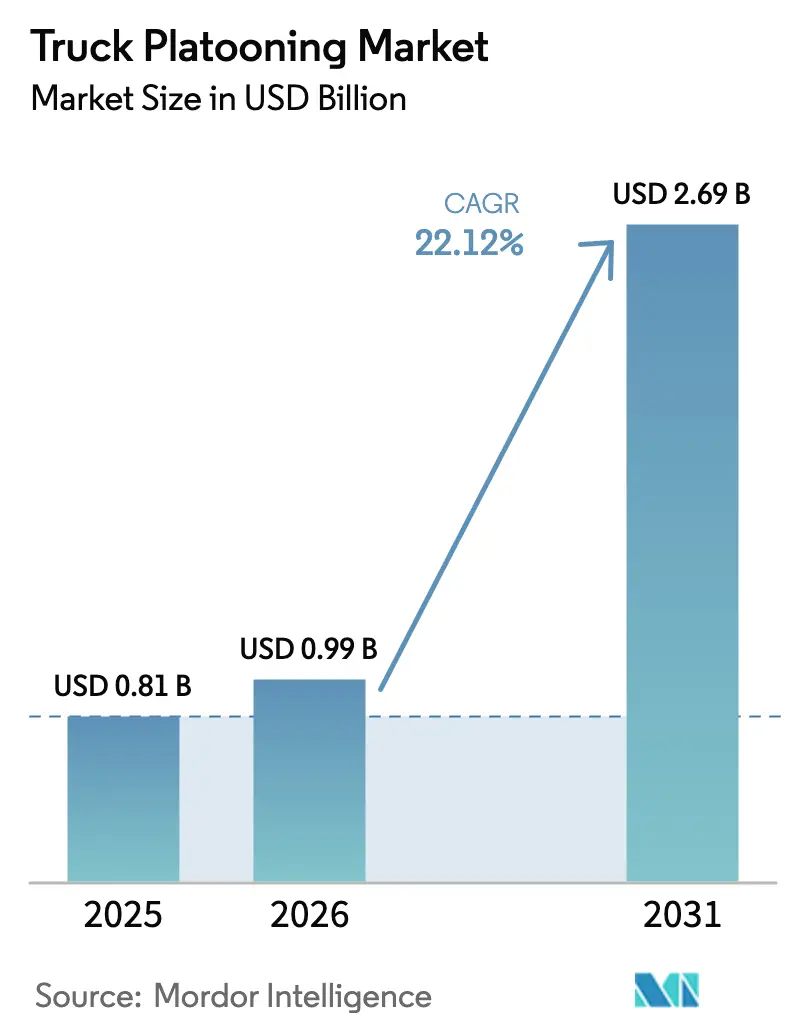
| Market Size (2026) | USD 0.99 Billion |
| Market Size (2031) | USD 2.69 Billion |
| Growth Rate (2026 - 2031) | 22.12% CAGR |
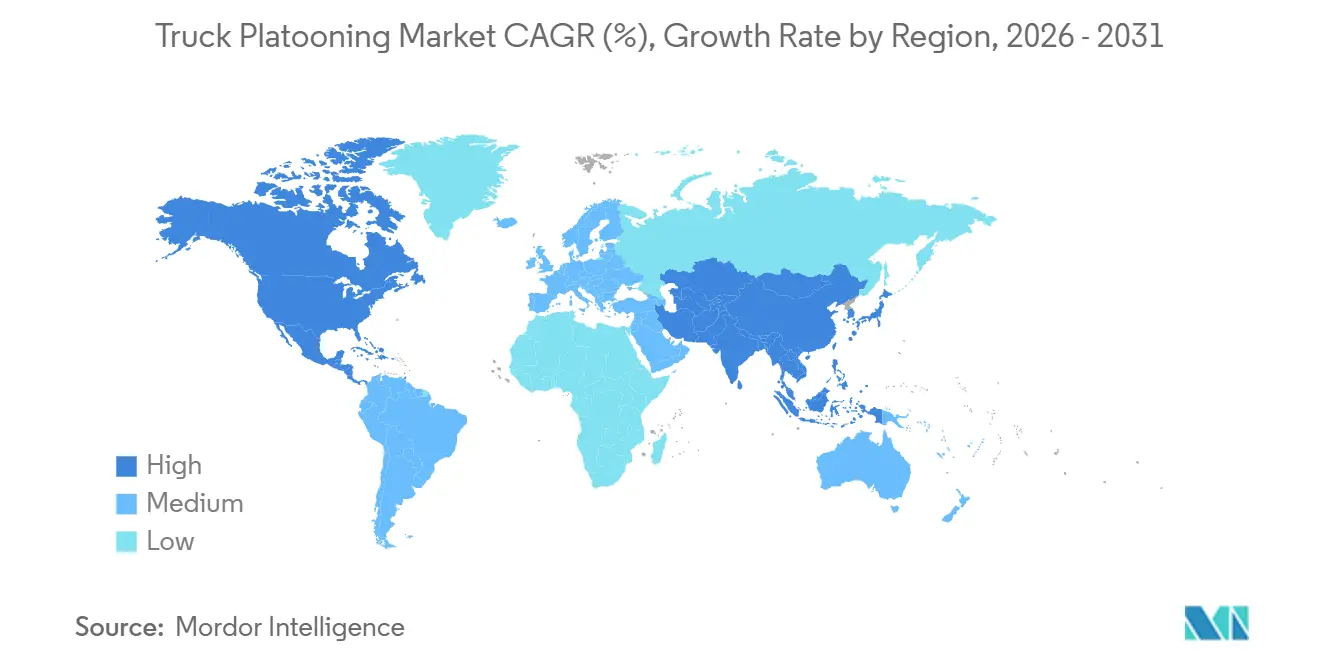
| Fastest Growing Market | Asia Pacific |
| Largest Market | North America |
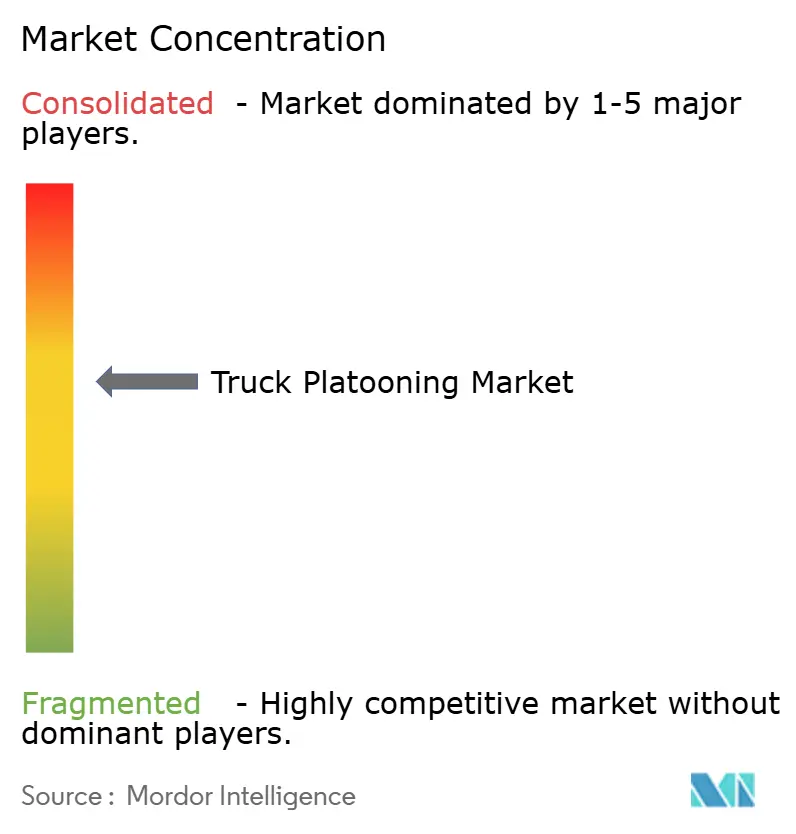
| Market Concentration | Medium |
Major Players *Disclaimer: Major Players sorted in no particular order Image © Mordor Intelligence. Reuse requires attribution under CC BY 4.0. | |
Truck Platooning Market Analysis by Mordor Intelligence
The truck platooning market size was valued at USD 0.81 billion in 2025 and estimated to grow from USD 0.99 billion in 2026 to reach USD 2.69 billion by 2031, at a CAGR of 22.12% during the forecast period (2026-2031). Fleet operators are accelerating deployment because regulatory penalties on greenhouse-gas (GHG) emissions now exceed the payback period for the aerodynamic fuel savings that platooning delivers. With the roll-out of fifth-generation C-V2X along United States interstates, Europe's TEN-T corridors, and China's Beijing-Shanghai expressway, latency constraints have been eliminated. This advancement facilitates vehicle-to-vehicle signaling in minimal time and with tighter following gaps, significantly boosting fuel economy. Concurrently, original-equipment manufacturers (OEMs) are transitioning to subscription pricing. This shift transforms capital expenditures into operating costs, thereby attracting mid-sized carriers - typically operating a moderate number of tractors - into the potential customer fold. Shippers are further bolstering adoption by incorporating platooning clauses in long-term freight contracts. This strategy not only ensures verifiable Scope-3 emission reductions but also redefines platooning from a mere cost-saving tool to a crucial revenue-protection measure.
Key Report Takeaways
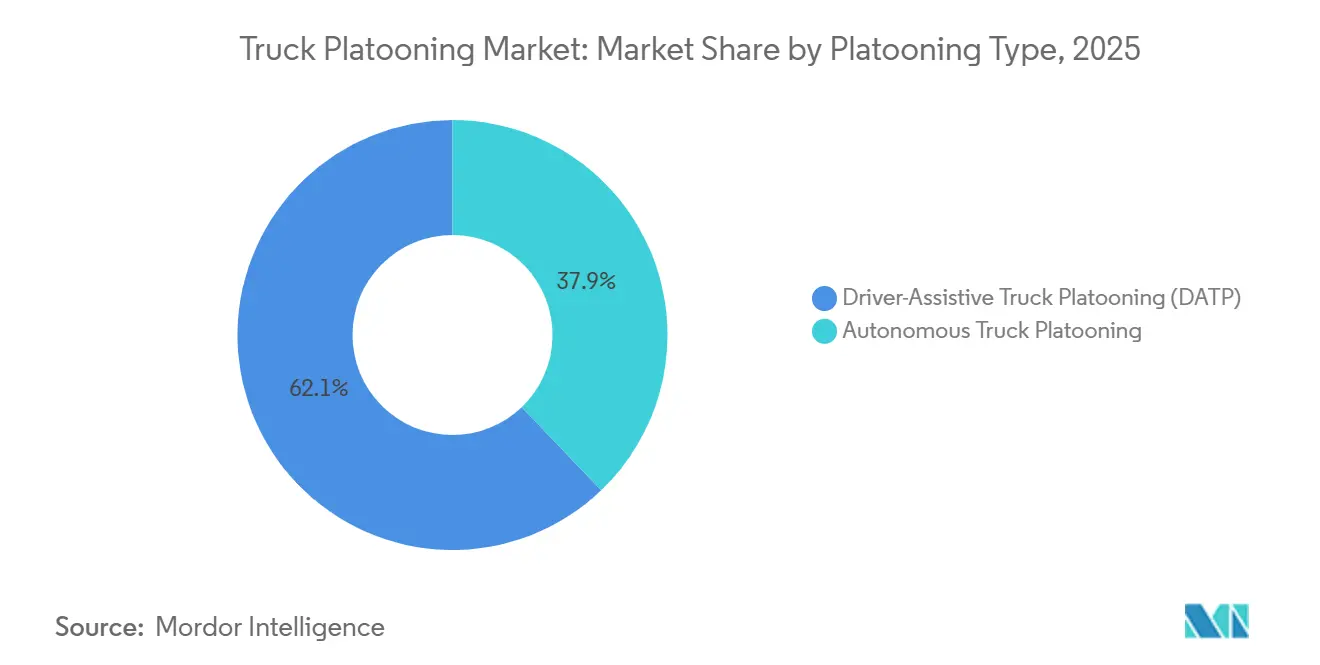
- By platooning type, driver-assistive configurations led with 62.15% revenue share in 2025, while autonomous platooning is projected to post a 23.54% CAGR through 2031.
- By technology type, adaptive cruise control commanded 33.25% of revenue in 2025; active brake assist is forecast to advance at a 26.11% CAGR.
- By infrastructure connectivity, vehicle-to-vehicle links represented 50.13% of 2025 revenue, whereas vehicle-to-infrastructure solutions are expected to expand at a 22.87% CAGR during 2026-2031.
- By truck class, Class 8 models captured 57.24% share in 2025 and are on track for a 22.51% CAGR through 2031.
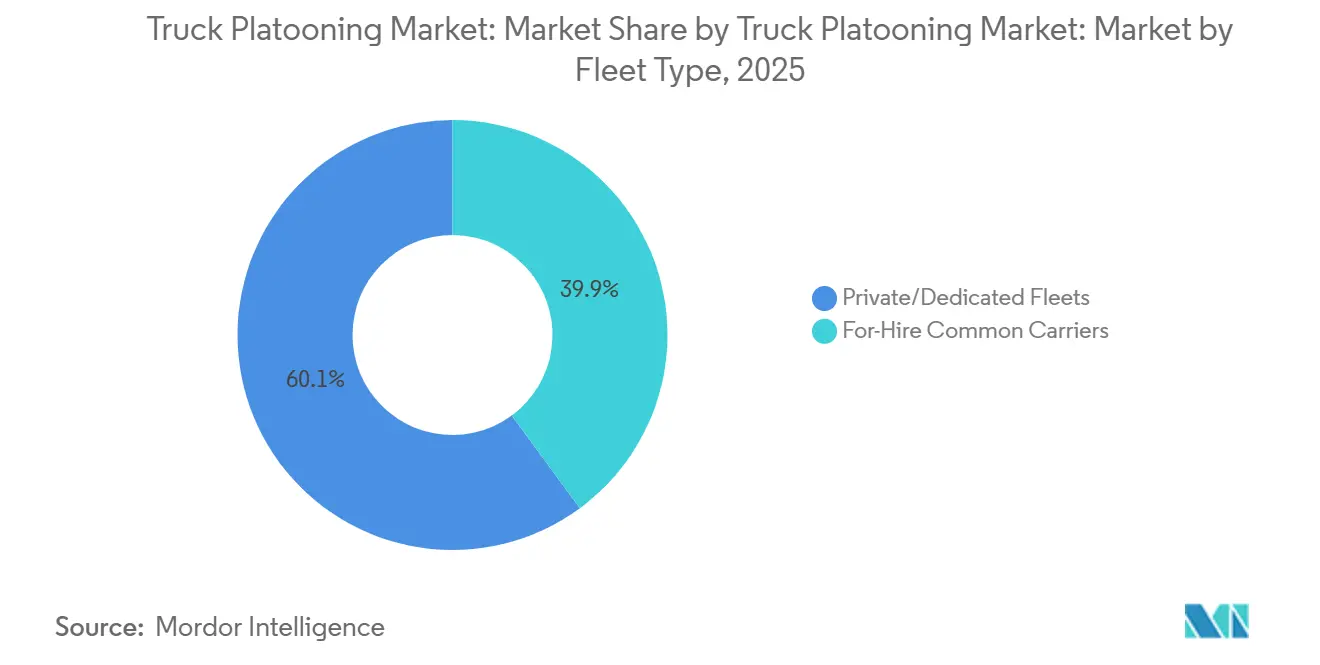
- By fleet type, private and dedicated operators held 60.11% share in 2025; for-hire common carriers are likely to grow at a 23.14% CAGR through 2031.
- By application, long-haul line-haul retained 58.03% share in 2025, yet regional hub-to-hub lanes are forecast to accelerate at a 24.31% CAGR through 2031.
- By ownership/business model, OEM-integrated subscriptions accounted for 58.64% share in 2025 and are poised to rise at a 23.78% CAGR through 2031.
- By geography, North America led with 43.15% 2025 share, but Asia-Pacific is the fastest-growing region at a 25.56% CAGR through 2031.
Note: Market size and forecast figures in this report are generated using Mordor Intelligence’s proprietary estimation framework, updated with the latest available data and insights as of January 2026.
Global Truck Platooning Market Trends and Insights
Drivers Impact Analysis*
| Driver | (~) % Impact on CAGR Forecast | Geographic Relevance | Impact Timeline |
|---|---|---|---|
| GHG Mandates and Fuel-Economy Standards | +4.2% | Global, Europe and California spearheading | Medium term (2-4 years) |
| Launch of 5G-C-V2X | +4.1% | United States, China, and South Korea | Medium term (2-4 years) |
| Multi-State / Trans-EU Pilot Corridors | +3.8% | North America and Europe priority routes | Short term (≤ 2 years) |
| Diesel Prices Widening ROI | +3.5% | Worldwide, acute in the Europe and Asia-Pacific | Short term (≤ 2 years) |
| Platooning-as-a-Service Subscription | +3.3% | North America and Europe, emerging in Asia-Pacific | Medium term (2-4 years) |
| Scope-3 Decarbonization Credits | +2.9% | Global, led by multinational logistics providers | Long term (≥ 4 years) |
| Source: Mordor Intelligence | |||
Stringent Global GHG Mandates and Fuel-Economy Standards
Heavy-duty emission rules are toughening faster than typical replacement cycles, forcing carriers to search for near-term compliance tools. The European Union requires a 45% reduction in truck CO₂ by 2030 relative to 2019 baselines, with non-compliance fines per required kilometer [1]Source: European Commission, “Heavy-Duty Vehicles CO₂ Regulation,” ec.europa.eu . California’s Advanced Clean Fleets rule obliges high-priority carriers to make a significant share of new Class 8 purchases zero- or near-zero-emission from 2027. China's Stage VI standards, effective since July 2024, impose stricter nitrogen-oxide limits, magnifying the economic benefit of the fuel savings typical of tight-gap convoys. Penalty frameworks now make platooning not merely an efficiency upgrade but a regulatory hedge.
Commercial Launch of 5G-C-V2X Enabling Sub-50 ms Latency
Standalone 5G cores now blanket the bulk of United States interstates, achieving end-to-end network latencies below 30 milliseconds and enabling safe inter-vehicle gaps of 10-15 meters at highway speeds. China Mobile’s 5G-Advanced build-out on the Beijing-Shanghai corridor supports synchronized braking across five-truck platoons. Release 17 of the 3GPP standard introduced direct sidelink, letting trucks maintain cohesion even in rural coverage gaps [2]Source: 3GPP, “Release 17 Features,” 3gpp.org . Semiconductor volume shipments confirm scale: NXP delivered a significant volume of C-V2X chipsets in 2025, a notable jump year-on-year.
Government-Funded Multi-State/Trans-EU Pilot Corridors
Public capital is stepping in to support early deployments, taking on liabilities as fleets gather operational experience. The United States Automated Driving Systems grants invested in dedicated lanes on Interstates 10 and 80, enhancing them with roadside 5G-C-V2X beacons and standardized emergency-response protocols. Europe's Connecting Europe Facility allocated funding in 2025 for infrastructure ready for platooning along the Germany-France-Netherlands corridors. In Japan, the Shin-Tomei Expressway pilot offers toll discounts for trucks traveling in certified platoons, showcasing how fiscal incentives can accelerate payback periods.
Rising Diesel Prices Widening ROI Gap vs. Conventional Convoys
In 2025, average diesel prices in the United States remained high, while European counterparts also experienced elevated levels. This pricing surge significantly increased fuel costs as a major component of operating expenses for long-haul fleets. A Class 8 truck trio, collectively covering extensive distances, can achieve notable annual fuel savings per truck. This means they can recover retrofit investments in a relatively short period. Furthermore, carbon-credit systems, notably the EU Emissions Trading System, enhance these savings by monetizing the emissions they avoid, bolstering overall returns.
Restraints Impact Analysis*
| Restraint | (~) % Impact on CAGR Forecast | Geographic Relevance | Impact Timeline |
|---|---|---|---|
| Freight-Cycle Downturn | –2.3% | Global, concentrated in North America and Europe | Short term (≤ 2 years) |
| Retrofit and Sensor Cost | –2.1% | Price-sensitive Asia-Pacific and Latin America | Short term (≤ 2 years) |
| Cross-Border Liability and Data-Ownership | –1.8% | EU and the United States state borders | Medium term (2-4 years) |
| Cyber-Attack Exposure | –1.5% | North America and Europe, emerging in Asia-Pacific | Medium term (2-4 years) |
| Source: Mordor Intelligence | |||
Freight-Cycle Downturn Curbing Cap-Ex by For-Hire Fleets
In 2025, freight rates and volumes significantly declined, reducing the discretionary cash that for-hire fleets typically allocate for technology upgrades. United States truckload spot rates dropped below the break-even point for numerous carriers, forcing many to divert limited funds towards servicing debts rather than investing in platooning retrofits. In Europe, road-freight tonnage experienced a year-over-year decline in Q3 2025, marking the fourth consecutive quarterly drop. This trend further diminished revenues and postponed equipment orders. Capital expenditures among for-hire carriers decreased in 2025, as high financing costs made the math for new-technology paybacks less appealing. An overcapacity issue exacerbated the situation, with the United States truck-to-load ratio becoming imbalanced. This imbalance not only depressed asset utilization but also extended payback periods for platooning hardware.
High Retrofit and Sensor-Suite Cost per Truck
In 2025, the average cost for a complete retrofit—encompassing radar, lidar, cameras, V2X radios, and control units—was significantly lower than the previous year but still represented a notable portion of a five-year-old truck’s resale value. The installation process, taking three days, leads to lost revenue due to downtime. Furthermore, the need for recurring calibration elevates ongoing costs. Many smaller carriers find it challenging to reach the breakeven point unless their annual mileage is considerably high.
*Our forecasts treat driver/restraint impacts as directional, not additive. The impact forecasts reflect baseline growth, mix effects, and variable interactions.
Segment Analysis
By Platooning Type: Liability Clarity Paces Autonomous Shift
In 2025, driver-assistive configurations are expected to dominate the truck platooning market with a significant 62.15% share, highlighting regulators' preference for Level 2 systems that ensure human oversight remains integral to operations. This dominance reflects the comfort of regulatory bodies with systems that keep drivers actively involved, maintaining a balance between technological advancement and safety. At the same time, autonomous platooning is anticipated to grow at a strong 23.54% CAGR as lawmakers work on drafting comprehensive Level 4 highway regulations and as insurance frameworks become more sophisticated. If the current adoption trends continue, the market size for autonomous truck platooning is likely to experience substantial growth by 2031, driven by advancements in technology and supportive regulatory developments.
At present, fleets predominantly opt for driver-assistive platoons, as these systems ensure that drivers remain responsible for vehicle operations. This approach aligns well with existing commercial-license regulations, making it easier for insurers to underwrite policies for such systems. However, as cross-border liability agreements are finalized and become more standardized, the adoption of autonomous operations is expected to accelerate. Autonomous systems offer significant advantages, including superior fuel savings and enhanced labor efficiencies, which are likely to drive their increasing market share in truck platooning steadily throughout the forecast period.


By Technology Type: Redundancy Mandates Propel Brake-Assist Growth
Adaptive cruise control, which accounts for 33.25% of 2025 revenues, has established itself as the foundational layer for every commercially deployed platoon. Insurance underwriters are increasingly advocating for redundant braking systems in fleets, which is driving active brake assist to achieve a robust forecast CAGR of 26.11%. This trend is further reinforced by the European Union's mandate requiring automated emergency braking systems in all new trucks, set to take effect in November 2024, ensuring widespread adoption across the region.
OEMs are progressively integrating sensor-fusion architectures into their factory builds to enhance vehicle safety and performance. These architectures combine radar's long-range detection capabilities, lidar's high precision, and the advanced object classification features of cameras. While these systems introduce incremental production costs, they significantly lower accident probabilities, emphasizing the industry's growing focus on leveraging scale advantages to improve safety and operational efficiency.
By Infrastructure Connectivity: V2I Gains as Highway Authorities Invest
In 2025, vehicle-to-vehicle links generated 50.13% of total revenue, primarily due to their ability to operate without relying on fixed roadside assets. This capability allows fleets to form ad-hoc platoons whenever compatible trucks converge, offering significant flexibility and cost efficiency. The absence of infrastructure dependency makes this connectivity model particularly appealing for fleet operators aiming to optimize operations in dynamic environments. Meanwhile, vehicle-to-infrastructure connectivity is projected to grow at a strong 22.87% CAGR, driven by substantial federal investments in roadside-unit deployments across the United States and major freight corridors in the European Union. This growth underscores the increasing emphasis on infrastructure enhancements to support advanced connectivity solutions.
Highway agencies are actively adopting V2I technology as a strategic tool to improve lane utilization, reduce congestion, and collect detailed freight data for better decision-making. Additionally, converged chipsets like NXP’s RoadLINK, which integrate both vehicle-to-vehicle and vehicle-to-infrastructure protocols, are minimizing hardware differentiation[3]“RoadLINK Device Shipments,” NXP Semiconductors, nxp.com. These chipsets also enable software updates, allowing the introduction of new services and functionalities, further enhancing the value proposition of connected vehicle technologies.
By Truck Class: Heavy-Duty Dominance Reflects Fuel-Cost Sensitivity
Class 8 (heavy-duty) trucks, benefiting from 120,000-mile annual duty cycles that amplify fuel-economy gains, accounted for 57.24% of 2025 revenue and are on track with a 22.51% CAGR. These trucks play a crucial role in the truck platooning market, where the revenue generated from retrofitting Class 8 vehicles has already reached a significant milestone, highlighting their dominance in the segment.
In contrast, Medium-duty Class 6-7 platforms, which have fewer miles eligible for platooning and experience longer payback periods, are seeing a lag in adoption. These platforms face challenges in achieving widespread implementation due to their limited operational efficiency in platooning scenarios. Regulatory scrutiny remains heavily focused on heavy-duty vehicles due to their substantial contribution to road-freight emissions, ensuring that policy pressures remain concentrated on this segment to drive environmental improvements.
By Fleet Type: Private Fleets Lead On Route Predictability
In 2025, private and dedicated fleets captured a dominant 60.11% share of the market by effectively leveraging predictable lanes and centralized maintenance strategies to enhance uptime and operational efficiency. These fleets have consistently demonstrated their ability to optimize performance through streamlined processes, ensuring reliability and cost-effectiveness in their operations.
Meanwhile, for-hire carriers are projected to experience a strong 23.14% CAGR during the forecast period, primarily fueled by industry consolidation. This consolidation trend is increasing the average fleet size, which, in turn, is enabling the adoption of standardized hardware and technologies, further driving growth and operational improvements in this segment. Shipper mandates are playing a critical role in narrowing the gap between private and for-hire fleets. Large retailers are increasingly favoring common carriers that can provide documented platooning capabilities, a feature that enhances efficiency and safety. This preference is shifting freight volumes toward carriers with such capabilities, creating a reinforcing cycle of increased utilization, cost savings, and competitive advantage for adopters in the market.
By Application: Regional Hub-To-Hub Gains on Urban-Access Pressure
In 2025, long-haul line-haul maintained its dominance with a significant 58.03% market share. However, regional hub-to-hub corridors are expected to witness substantial growth, driven by a strong 24.31% CAGR. This growth is attributed to the increasing implementation of tighter emissions zones by cities and the rising demand for faster delivery timelines, fueled by the expansion of e-commerce.
Shorter routes allow tractors to complete a higher number of cycles annually, enhancing operational efficiency. When paired with subscription-based pricing models, these routes improve the overall return profile, even though the per-trip fuel savings are slightly lower. The early momentum toward these medium-length corridors is clearly demonstrated by port drayage pilot programs in Los Angeles, which highlight the growing shift in transportation dynamics.
By Ownership / Business Model: Subscription Models Align with Cash Flow
In 2025, OEM-integrated subscriptions accounted for 58.64% of the revenue and are projected to grow at a CAGR of 23.78%. This growth is primarily driven by the increasing preference of fleets for operating expenditures over capital expenditures. By choosing a monthly subscription fee, fleets can avoid the significant challenges associated with retrofitting while also benefiting from the inclusion of over-the-air updates as part of standard service agreements, ensuring seamless and up-to-date operations.
While third-party suppliers continue to hold a position among mixed-brand fleets that prioritize vendor neutrality, they are facing growing challenges in the market. OEMs are leveraging their extensive dealer networks and robust telematics ecosystems to embed proprietary technology stacks, thereby exerting pressure on third-party providers and gradually consolidating their dominance in the market.
Geography Analysis
North America accounts for 43.15% of the 2025 revenue, driven by a well-connected interstate network, extensive 5G coverage, and supportive federal grants. Yet state-level rule divergence still forces carriers to alter platoon configurations, trimming efficiency when crossing borders between California, Arizona, and Texas. Annual adoption, nevertheless, is set to quicken as the Infrastructure Investment and Jobs Act funds more connected-vehicle projects.
Europe ranked second, underpinned by stringent CO₂ caps and the TEN-T modernization program, but cross-border liability gaps and economic stagnation in Germany moderate near-term expansion. Harmonized UNECE regulations under discussion could unlock multi-country platoons, erasing current fragmentation penalties.
Asia-Pacific shows the fastest trajectory at 25.56% CAGR, propelled by China’s freight-digitization roadmap that mandates Level 2 automation on a significant share of new trucks sold from 2026. Japan’s Society 5.0 program offers a notable share of toll rebates for certified platoons, while India’s Golden Quadrilateral upgrade earmarks high costs for V2I pilots. Remaining infrastructure gaps and regulatory inconsistencies mean ramp-up will vary by nation, but upside potential is significant.

Competitive Landscape
The sector remains moderately concentrated: the five largest OEMs - Daimler Truck, AB Volvo, Paccar, Volkswagen-Traton, and Hyundai Motor - shipped a notable share of platoon-ready trucks in 2025. These incumbents are vertically integrating software and sensors to secure subscription revenue and lock in brand-loyal customers.
Technology specialists such as ZF, Continental, Bosch, and Knorr-Bremse compete on sensor fusion, brake redundancy, and cybersecurity certification. ZF’s acquisition of WABCO enables an end-to-end stack that reduces installation complexity, permitting it to win supplier slots across multiple OEM lines.
Disrupters, including Einride, pursue purpose-built autonomous electric trucks that operate in geofenced platoons, bypassing diesel retrofit economics altogether. Their clean-sheet approach underscores a strategic divide: legacy manufacturers refine existing platforms, while newcomers aim to leapfrog with fully automated, zero-emission vehicles.
Truck Platooning Industry Leaders
Daimler Truck AG
AB Volvo
Paccar Inc (DAF Trucks)
Volkswagen Group
Hyundai Motor Company
- *Disclaimer: Major Players sorted in no particular order

Recent Industry Developments
- October 2025: Montana Department of Transportation and the University of North Dakota launched a public survey to gauge perceptions of platooning on state highways.
- April 2025: The Ohio and Indiana Departments of Transportation began a two-state trial in which twin tractor-trailers equipped with Kratos Defense automation technology shuttled freight along Interstate 70 under diverse Midwestern weather conditions.


Research Methodology Framework and Report Scope
Market Definitions and Key Coverage
Our study defines the truck platooning market as revenue from hardware, embedded software, and subscription services that let Class 6-8 trucks travel in electronically linked convoys at commercial scale in 2025. We capture factory-fitted systems and validated retrofit kits that enter paid fleet service across all regions.
Scope Exclusions: We exclude passenger-car convoys, military test beds, and non-monetized prototypes.
Segmentation Overview
- By Platooning Type
- Driver-Assistive Truck Platooning (DATP)
- Autonomous Truck Platooning
- By Technology Type
- Adaptive Cruise Control
- Forward Collision Warning
- Automated Emergency Braking
- Active Brake Assist
- Lane Keep Assist
- Other ADAS (Blind-Spot Warning, etc.)
- By Infrastructure Connectivity
- Vehicle-to-Vehicle (V2V)
- Vehicle-to-Infrastructure (V2I)
- Global Positioning System (GPS)
- By Truck Class
- Class 8 (Heavy-Duty)
- Class 6-7 (Medium-Duty)
- By Fleet Type
- Private/Dedicated Fleets
- For-Hire Common Carriers
- By Application
- Long-Haul Line-haul
- Regional / Hub-to-Hub
- Port and Intermodal Drayage
- By Ownership / Business Model
- OEM-Integrated Subscription
- Third-Party Technology Provider
- By Geography
- North America
- United States
- Canada
- Rest of North America
- South America
- Brazil
- Argentina
- Rest of South America
- Europe
- Germany
- United Kingdom
- France
- Spain
- Italy
- Russia
- Rest of Europe
- Asia-Pacific
- China
- Japan
- India
- South Korea
- Rest of Asia-Pacific
- Middle East and Africa
- United Arab Emirates
- Saudi Arabia
- Egypt
- Turkey
- South Africa
- Rest of the Middle East and Africa
- North America
Detailed Research Methodology and Data Validation
Primary Research
Interviews with OEM engineers, fleet operations heads, highway concessionaires, and regulators across North America, Europe, and Asia let us validate adoption curves, service pricing, and retrofit rates that secondary data alone could not uncover.
Desk Research
We began by extracting heavy-truck registration and production data from sources such as the US Bureau of Transportation Statistics, Eurostat Mobility, and OICA, and then overlaid long-haul ton-kilometer series, International Energy Agency diesel price dashboards, and patents logged through Questel. Annual reports, investor decks, and news archived on Dow Jones Factiva helped us date technology launches and price points. The sources listed are illustrative; many additional references informed the analysis.
Market-Sizing & Forecasting
We reconstructed a top-down demand pool from new heavy-truck sales and the share already equipped with essential ADAS. Results were cross-checked with sampled supplier roll-ups of sensor shipments and telematics activations. Key variables like diesel price trends, connected-truck penetration, 5G-C-V2X coverage, average haul length, and regional CO2 targets feed a multivariate regression that generates the 2025-2030 outlook. Where early-stage regions lacked detail, we gap-filled by applying validated adoption ratios from matched peer markets.
Data Validation & Update Cycle
Before release, our model runs variance checks against freight spot rates and OEM backlogs; any anomaly triggers a joint analyst review. The dataset refreshes annually, with interim updates for material regulatory or technology events.
Why Mordor's Truck Platooning Baseline Earns Decision-Maker Trust
Published values often diverge because firms apply unique scopes, base years, or sensor-price assumptions. Our focus on billable truck platooning deployments and adoption tied to verified ADAS readiness provides a balanced baseline.
Key gap drivers include whether subscription revenue is counted, treatment of retrofit kits, and currency translation approaches; some publishers even convert pilot mileage directly into revenue, whereas we wait for invoiced miles before crediting value.
Benchmark comparison
| Market Size | Anonymized source | Primary gap driver |
|---|---|---|
| USD 0.81 B (2025) | Mordor Intelligence | - |
| USD 2.30 B (2024) | Global Consultancy A | Counts light commercial convoys and uses list prices, not realized fees |
| USD 1.10 B (2023) | Industry Research B | Includes unfunded pilots and freezes exchange rates at 2020 levels |
| USD 0.73 B (2025) | Trade Journal C | Assumes uniform 35 % retrofit penetration across all fleets |
Taken together, the comparison shows that Mordor's scoped-to-revenue, annually refreshed model gives logistics planners and investors a transparent, repeatable starting point for confident decisions.


Key Questions Answered in the Report
How large is the truck platooning market expected to become by 2031?
The truck platooning market size is forecast to reach USD 2.69 billion by 2031, expanding at a 22.12% CAGR from 2026 to 2031.
Which region is seeing the fastest growth in commercial platooning deployments?
Asia-Pacific leads on growth with a projected 25.56% CAGR as China, Japan, and India roll out digital-freight and connected-corridor programs.
Why do Class 8 tractors dominate early adoption?
Their high annual mileage and fuel-cost sensitivity deliver faster payback, allowing Class 8 trucks to hold 57.24% of 2025 revenue and sustain a 22.51% CAGR.
What is driving the shift toward subscription pricing?
OEM subscriptions convert capital expenditure into operating expense, lowering adoption barriers; OEM-integrated plans already account for 58.64% of 2025 revenue.
Page last updated on:


