
Market Overview
| Study Period | 2021 - 2031 |
|---|---|
| Forecast Data Period | 2026 - 2031 |
| Historical Data Period | 2021 - 2024 |
| Growth Rate | 4.29 % |
Major Players *Disclaimer: Major Players sorted in no particular order Image © Mordor Intelligence. Reuse requires attribution under CC BY 4.0. | |
Trinidad and Tobago Oil and Gas Upstream Market Analysis by Mordor Intelligence
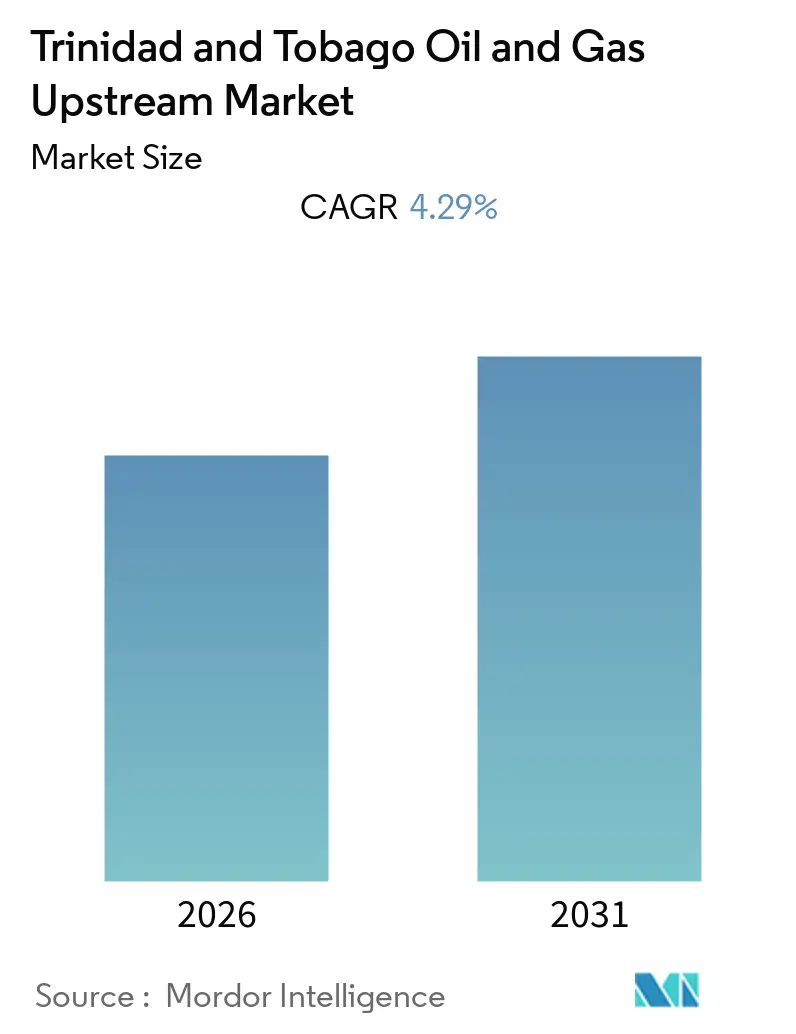
The Trinidad and Tobago Oil and Gas Upstream Market size is expected to register a CAGR of 4.29% during the forecast period.
- Offshore projects are expected to remain the most utilized of the deployment locations as they provide for cheaper access to the oil resources. In 2019, the offshore gas fields and oil fields dominated the market overwhelmingly.
- Rerouting, expansion, and construction of pipelines are getting installed in the Trinidad and Tobago, which can become an opportunity for an increase in the oil and gas upstream sector by decreasing the cost of transportation.
- Increasing gas production coupled with increasing investment in the oil and gas fields are expected to drive the market in the forecast period.
Note: Market size and forecast figures in this report are generated using Mordor Intelligence’s proprietary estimation framework, updated with the latest available data and insights as of 2026.
Trinidad and Tobago Oil and Gas Upstream Market Trends and Insights
Offshore Oil and Gas Production to Dominate the Market
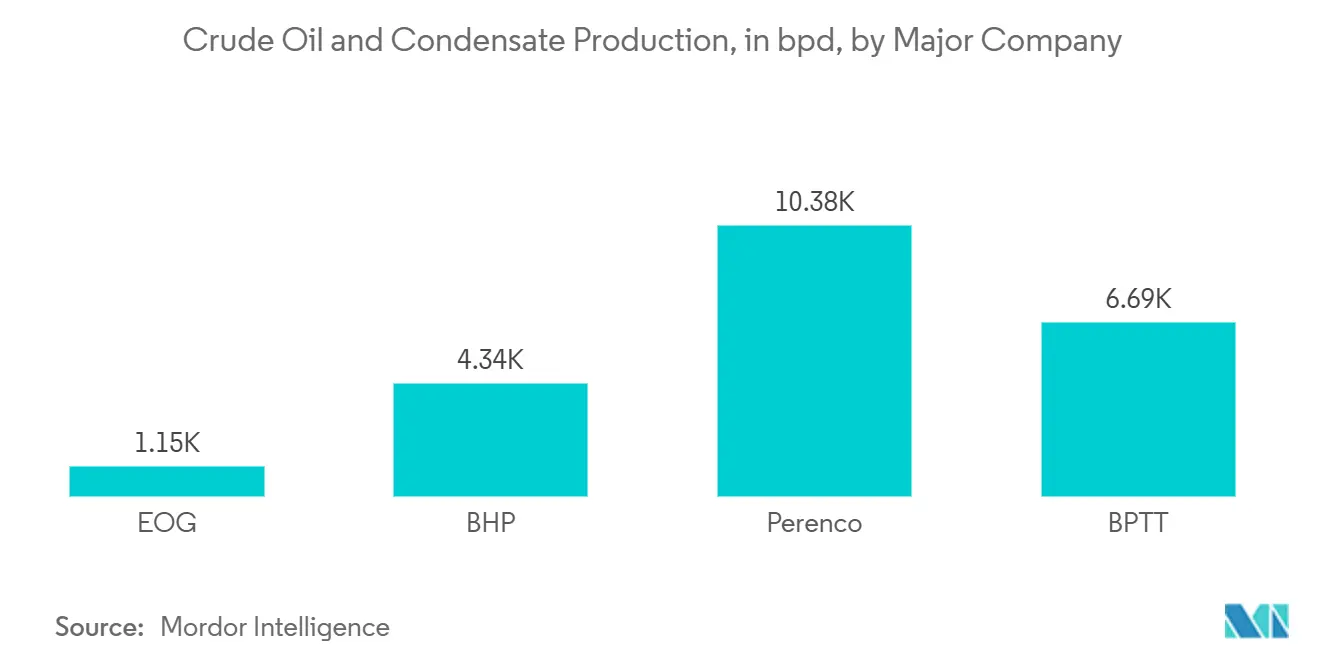
- Around 43,056 MMSCF/D of natural gas was produced, mostly, from the offshore fields, In 2019 which decreased from 43,536 MMSCF/D and around 40,131 barrels of oil per day (bopd) was produced from the offshore oilfields alone, in 2019, which fell about 5.65% from 42,540 bopd.
- In 2019, offshore make approximately 68% of the oil produced with 40,131 bopd being produced in the offshore fields and 18,720 bopd in the onshore fields.
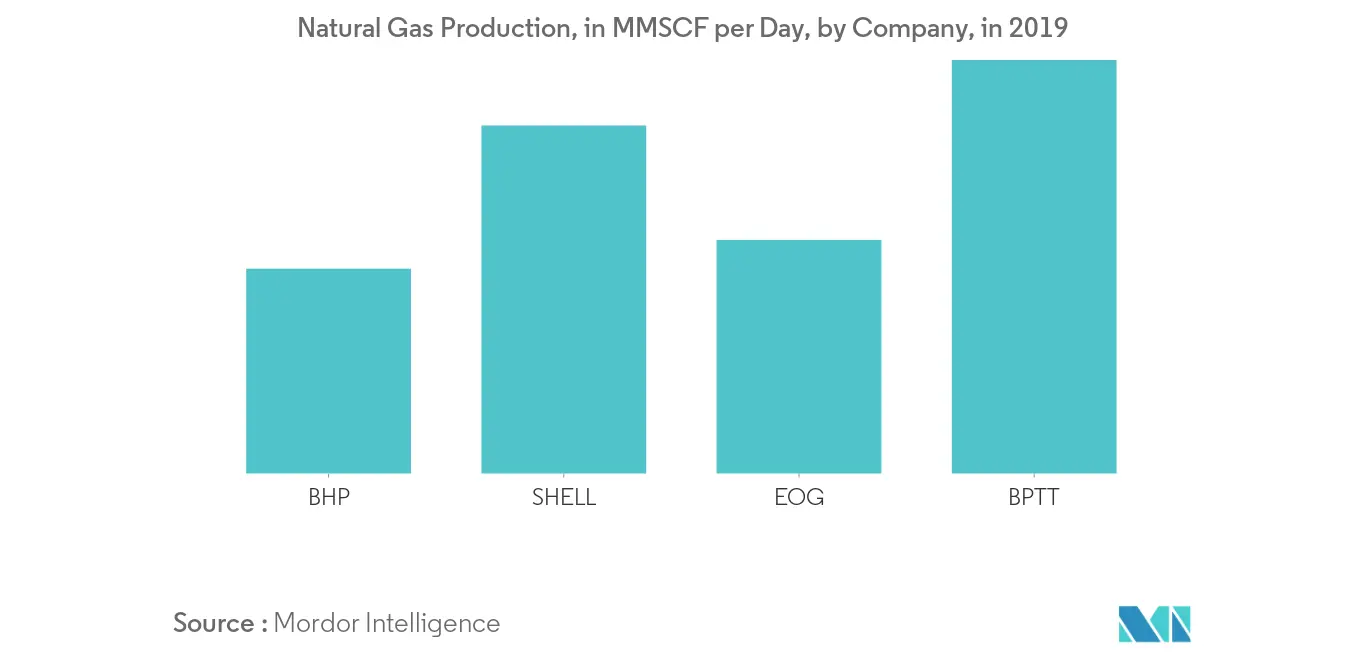
- As of 2019, BPTT had 15 offshore platforms and two onshore processing facilities. The company is Trinidad & Tobago's largest gas producer, accounting for about 55% of the nation's gas production.
- Hence, offshore oilfields are expected to dominate the market due to gas reserves being concentrated in the water bodies of the exclusive economic zone.
Increasing Gas Production to Drive the Market
- In 2018, natural gas production became 29.2 million tons increasing from 27.4 million tons, in 2017. New projects, both onshore and offshore, are the primary reason for the increase in growth of natural gas.
- In 2019, BPTT commissioned its 15th installation in the offshore sector of Trinidad & Tobago which is expected to have a production capacity of around 600 MMscf/d.
- Matapal is a new offshore gas project being developed off the coast of Trinidad and Tobago, in 2019. The production capacity of the project is estimated to be 400 million standard cubic feet (mscf) of gas per day, with average annual peak production of approximately 70 million barrels of oil equivalent per day (mboed)
- Hence, the oil production is expected to dominate the market owing to its large production. It is also likely to drive the market by attracting investment into the industry.
Regulatory Landscape
Trinidad and Tobago upstream petroleum activities are governed by the Petroleum Act and Regulations (Chap 62:01), alongside the Petroleum Taxes Act and the Petroleum Production Levy and Subsidy Act, which together set licensing requirements, operational controls, and fiscal obligations. The Ministry of Energy and Energy Industries (MEEI), through its Petroleum Operations and Management Division (POMD), oversees key approvals and compliance requirements across exploration, development plans, production operations, and associated infrastructure.
Recent policy actions include the opening of the MEEI 2025 Deep Water Competitive Bidding Round (26 offshore blocks under updated production sharing contract terms) and a targeted marginal marine gas field fiscal incentive introduced via the 2026 Finance Bill. The 2026 measure applies to qualifying offshore shallow-water marginal gas projects starting after January 1, 2026, reducing the natural gas royalty rate from 12.5% to 8% and permitting a 30% uplift on qualifying expenditure, signaling a regulatory push to commercialize smaller offshore resources.
Value Chain Analysis
The upstream value chain in Trinidad and Tobago starts with acreage access via exploration and production licences and production sharing contracts administered by the MEEI. This is followed by geophysical surveys, exploration drilling, appraisal, field development approvals, and offshore and onshore production operations.
Operators then route gas and liquids through subsea tiebacks and pipelines into processing and export-oriented infrastructure. The National Gas Company of Trinidad and Tobago Limited (NGC) acts as a central midstream interface through gas aggregation and supply arrangements that connect upstream output to domestic industry and LNG value chains. The current chain is anchored by offshore production hubs operated by major companies such as bpTT and Shell, supported by project-driven contracting (drilling, subsea, fabrication, logistics) and environmental permitting processes overseen by the Environmental Management Authority (EMA). Recent project flow highlights continued reliance on brownfield tiebacks and new developments, including bpTT projects (Cypre) and the bpTT/EOG joint venture Mento, alongside Shells Manatee development (FID announced in 2024, with drilling commencing in 2026 per project updates), which reinforces the importance of timely approvals, pipeline readiness, and gas sales contracting to monetize offshore volumes.
Competitive Landscape
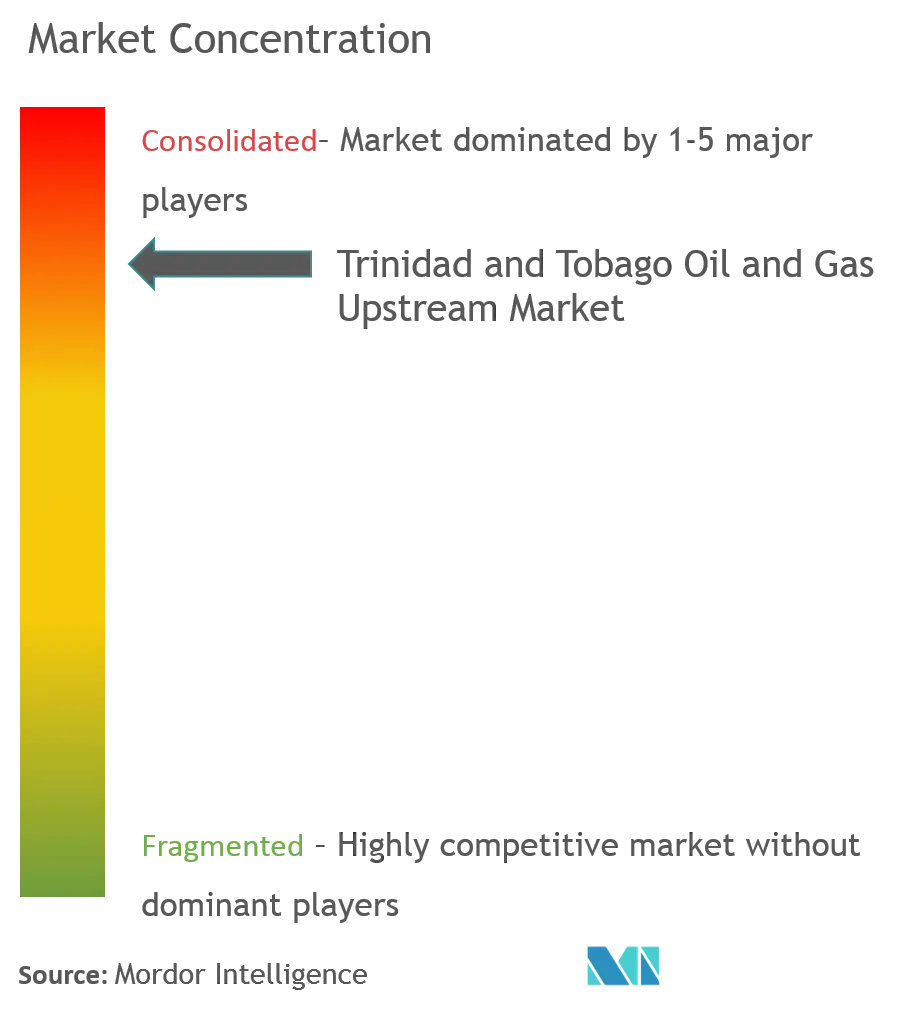
The Trinidad and Tobago oil and gas upstream market is consolidated. The major companies include BP PLC, Shell Trinidad & Tobago Limited, The National Gas Company of Trinidad and Tobago Limited, EOG Resources, Inc. and BHP Group PLC.
Trinidad and Tobago Oil and Gas Upstream Industry Leaders
-
BP PLC
-
Shell Trinidad & Tobago Limited
-
The National Gas Company of Trinidad and Tobago Limited
-
EOG Resources, Inc.
-
BHP Group PLC
-
Perenco SA
- *Disclaimer: Major Players sorted in no particular order
Market Opportunities and Future Outlook
Near-term opportunity centers on converting additional offshore gas resources into sales using fiscal incentives and active acreage programs. The 2026 Finance Bill introduced a marginal marine gas field incentive, including a royalty reduction to 8% from 12.5% for qualifying projects starting after January 1, 2026, which improves the commercial pathway for smaller shallow-water fields. Alongside this, the government continues to use competitive bidding and PSC awards to broaden the exploration funnel, including the 2025 Deep Water Competitive Bidding Round and subsequent awards activity.
Exploration and resource maturation activity also supports demand for services tied to subsea tiebacks and associated infrastructure. MEEI highlighted the TTUD-1 3D seismic campaign (Amazon Warrior) in early 2026, and in June 2026 the government signed a PSC with ExxonMobil and Occidental Petroleum for the TTUD-1 ultra-deepwater block, establishing a new operator set for frontier drilling. On the supply side, mature field revitalization is being pursued through contract amendments, including MEEI and Perenco signing PSC amendments for blocks 2(c) and 3(a) in April 2026. At the same time, Shell-operated Manatee, a large backfill project under development, underscores the need for execution capacity across drilling, marine logistics, and pipeline integration to deliver additional gas into the countrys downstream industrial base.
Recent Industry Developments
- June 2026: The Government of Trinidad and Tobago signed a production sharing contract with ExxonMobil and Occidental Petroleum for the TTUD-1 ultra-deepwater exploration block. The award strengthens the frontier exploration pipeline and broadens the operator mix in-country beyond incumbent shallow-water and mature-area developments.
- May 2026: National Gas Company of Trinidad and Tobago (NGC) executed a new two-year natural gas supply contract with EOG Resources Trinidad Limited. The agreement supports feedgas continuity for domestic and industrial demand, tightening the linkage between upstream production planning and downstream offtake commitments.
- February 2026: The Environmental Management Authority (EMA) held an engagement session with upstream operators including BP, Shell, and EOG to address permitting efficiency and ease of doing business. The forum aligns regulatory process improvements with near-term project execution needs, particularly for tiebacks, well work, and facility modifications that depend on timely clearances.
Research Methodology Framework and Report Scope
Market Definition and Coverage
For this methodology, the Trinidad and Tobago oil and gas upstream market covers the value created from exploration, field development, and hydrocarbon production activities carried out in-country, across onshore and offshore assets.
Scope exclusions: Midstream, LNG processing, refining, petrochemicals, fuel retail, and most downstream logistics are excluded from this sizing.
Segmentation Overview
- Location of Deployment
- Onshore
- Offshore
Data Sources, Market Sizing, and Validation
Desk Research
We start by building a fact base on Trinidad and Tobago upstream activity, and then we use it to anchor assumptions that cannot be directly observed in one place. Public sources, such as the Ministry of Energy and Energy Industries of Trinidad and Tobago, the Central Bank of Trinidad and Tobago, and official budget and policy releases, help set the country context and upstream priorities.
Operational direction is then cross-checked using sources such as operator and contractor filings, investor presentations, audited financial statements, and credible energy press coverage. Where available, we also refer to public production and trade statistics from sources such as the U.S. Energy Information Administration, UN Comtrade, and technical publications to sense-check trends such as liquids versus gas tilt and export reliance. In parallel, a paid subscription for company financials and a paid shipment-level import and export database are used selectively to improve consistency in price and activity signals. These desk research sources are illustrative, and many other public and paid references were also used to collect data, validate it, and clarify gaps.
Primary Interviews and Surveys
Interviews with upstream operators, service providers, regulators, and industry specialists in Trinidad and Tobago focus on field schedules, drilling activity, production constraints, realized prices, and local spending. Respondent input helps resolve missing data, check secondary assumptions against operating conditions, and triangulate the final model for the country's upstream market.
Distribution of primary research fieldwork respondents
| Company type | Respondent position |
|---|---|
| Top tier: 31% | CXOs: 17% |
| Mid tier: 45% | Functional/Unit leaders: 32% |
| Smaller Players: 24% | Managers: 51% |
Market-Sizing & Forecasting
Sizing is built using a top-down reconstruction of the annual upstream spend pool in Trinidad and Tobago, where project activity is translated into value using a mix of production and development signals. For example, the offshore versus onshore activity mix, drilling and workover intensity, greenfield versus brownfield development share, and the expected sequencing of sanctioned projects are treated as key drivers, followed by a price and cost layer that reflects local contracting and inflation conditions.
Once the country total is formed, it is corroborated using selective bottom-up approximations, such as sampled project and contract checks, a small roll-up of supplier revenue exposure, and reasonableness tests of implied spend per barrel of liquids and per unit of gas output. Gaps in company disclosures are handled by using peer ratios adjusted for asset maturity and offshore share, and then reviewed with industry respondents before finalizing. Forecasts are created using scenario analysis around project start dates, commodity price sensitivities, and expected service cost progression, and the assumptions are aligned to what interviewees consider a practical base case for 2026 to 2031.
Data Validation & Update Cycle
We run several validation passes so outputs do not drift away from real-world signals. Model results are checked against independent markers such as upstream investment commentary, production direction, and known project timelines, and any unusual jumps are traced back to the specific assumption causing it.
Before sign-off, a second analyst reviews the worksheets, units, and currency handling, then tests the logic again across onshore and offshore splits to confirm nothing is double counted. If a key input changes materially, such as a project delay, a revised fiscal term, or a major price move, respondents are re-contacted to confirm the practical impact. The report is refreshed annually, and a final pre-delivery review is completed so clients receive the latest updated view.
Mordor Intelligence's Trinidad Tobago Oil and Gas Upstream Market Size Measured Against Other Published Estimates
Published market sizes for Trinidad and Tobago upstream can vary because sources do not always measure the same thing, and the year labeling is not always consistent. Some estimates describe upstream capital and operating spend, while others mix in broader energy activity or apply global templates that do not fully reflect the country's offshore-led project cadence.
The main gap comes from treating upstream spending as a full revenue market, where Mordor Intelligence counts only upstream E and P activity in Trinidad and Tobago and keeps onshore and offshore definitions tight, while other sources may blend global regional splits or use upstream spend headlines as a market value proxy.
Benchmark comparison
| Source | Market Size | Gaps in Research Methodology |
|---|---|---|
| Mordor Intelligence | USD 4.75 B (2026) | |
| Research Publisher A | USD 2.11 B (2024) | Uses a global template with multi-region coverage and broader upstream service buckets, so parts of the value chain and geographies can get mixed into what is presented as a Trinidad and Tobago figure. |
| Trade Journal B | USD 2.30 B (2025) | Represents upstream investment spend for a single year and is not constructed as a full upstream market value, which can understate activity when multi-year development cycles are present. |
The spread in the table is mainly explained by what is being measured and how tightly the country scope is controlled. When upstream is modeled using clear activity drivers and then cross-checked with practical project and cost signals, the resulting total stays easier to trace and repeat from one update cycle to the next.
Key Questions Answered in the Report
What is the current Trinidad & Tobago Oil and Gas Upstream Market size?
The Trinidad & Tobago Oil and Gas Upstream Market is projected to register a CAGR of 4.29% during the forecast period (2026-2031)
Who are the key players in Trinidad & Tobago Oil and Gas Upstream Market?
BP PLC, Shell Trinidad & Tobago Limited, The National Gas Company of Trinidad and Tobago Limited, EOG Resources, Inc., BHP Group PLC and Perenco SA are the major companies operating in the Trinidad & Tobago Oil and Gas Upstream Market.
What years does this Trinidad & Tobago Oil and Gas Upstream Market cover?
The report covers the Trinidad & Tobago Oil and Gas Upstream Market historical market size for years: 2020, 2021, 2022, 2023 and 2024. The report also forecasts the Trinidad & Tobago Oil and Gas Upstream Market size for years: 2026, 2027, 2028, 2029, 2030 and 2031.