
Treasury Management Services Market Size and Share
Market Overview
| Study Period | 2020 - 2031 |
|---|---|
| Market Size (2026) | USD 76.10 Billion |
| Market Size (2031) | USD 99.60 Billion |
| Growth Rate (2026 - 2031) | 5.50 % |
| Fastest Growing Market | South America |
| Largest Market | North America |
| Market Concentration | Low |
Major Players *Disclaimer: Major Players sorted in no particular order Image © Mordor Intelligence. Reuse requires attribution under CC BY 4.0. | |
Treasury Management Services Market Analysis by Mordor Intelligence
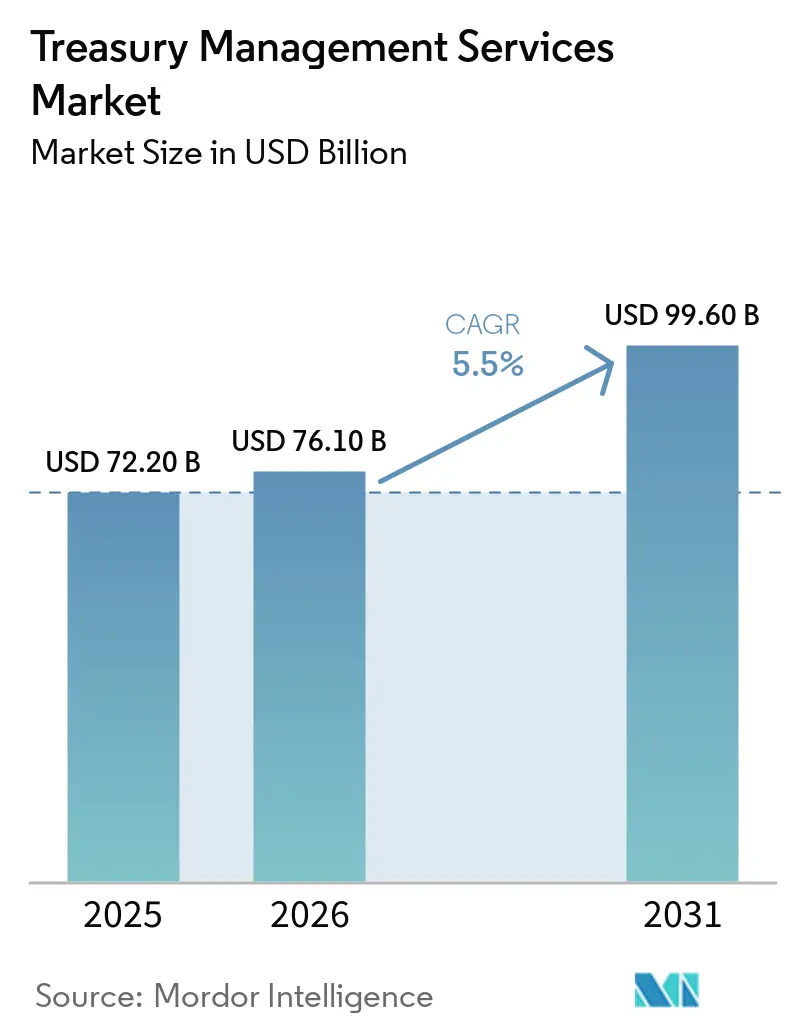
The treasury management services market size was valued at USD 72.2 billion in 2025 and is estimated to grow from USD 76.1 billion in 2026 to reach USD 99.6 billion by 2031, at a CAGR of 5.5% during the forecast period (2026-2031).
The treasury management services market is being reshaped by real-time payment networks, the migration to ISO 20022 messaging, and wider use of artificial intelligence in cash forecasting. These changes move treasury work toward continuous cash visibility and more timely decisions rather than overnight reconciliation. Providers are responding with cloud platforms, data connectivity tools, and automated controls that can support complex payments, liquidity, and compliance requirements. Demand remains strong, although implementation costs, integration challenges, cybersecurity exposure, and a shortage of qualified treasury personnel can slow the pace at which users adopt advanced capabilities.
Key Report Takeaways
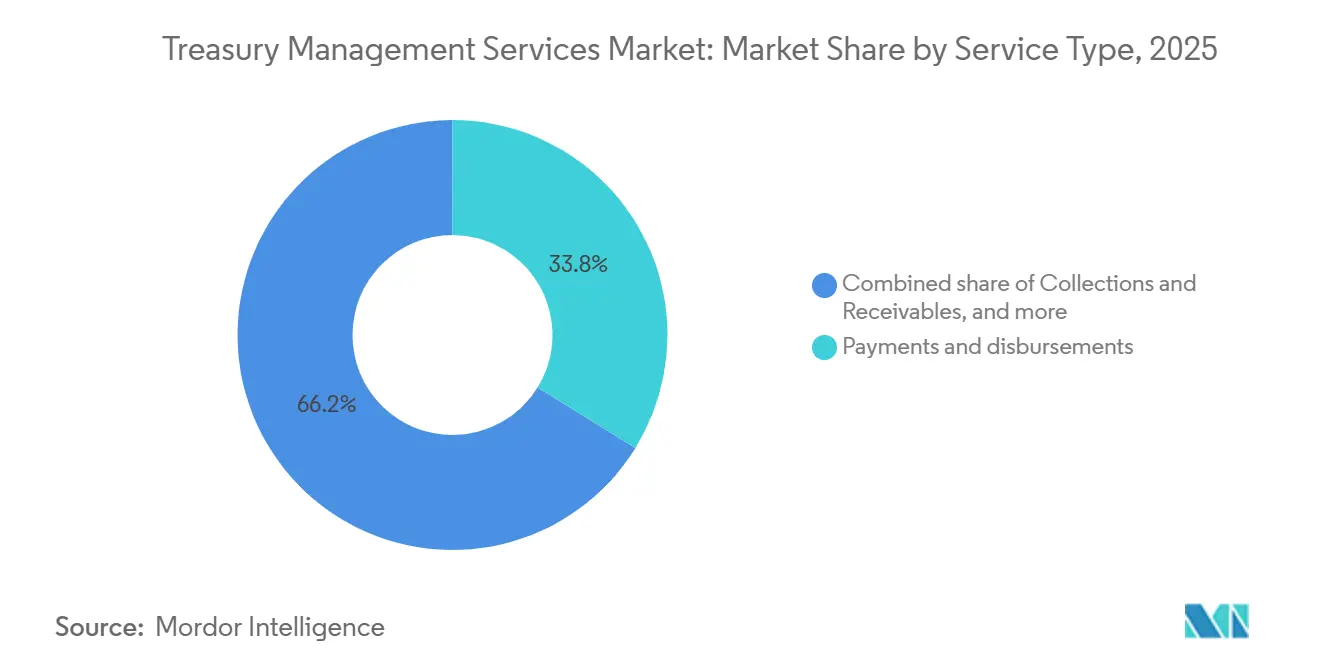
- By service type, payments and disbursements captured 33.8% of the treasury management services market share in 2025, while account services, information reporting, and bank connectivity are projected to grow at a 7.1% CAGR through 2031.
- By client segment, large corporates and multinationals held 37.2% of the treasury management services market share in 2025, while mid-market and commercial banking clients are projected to grow at a 6.6% CAGR through 2031.
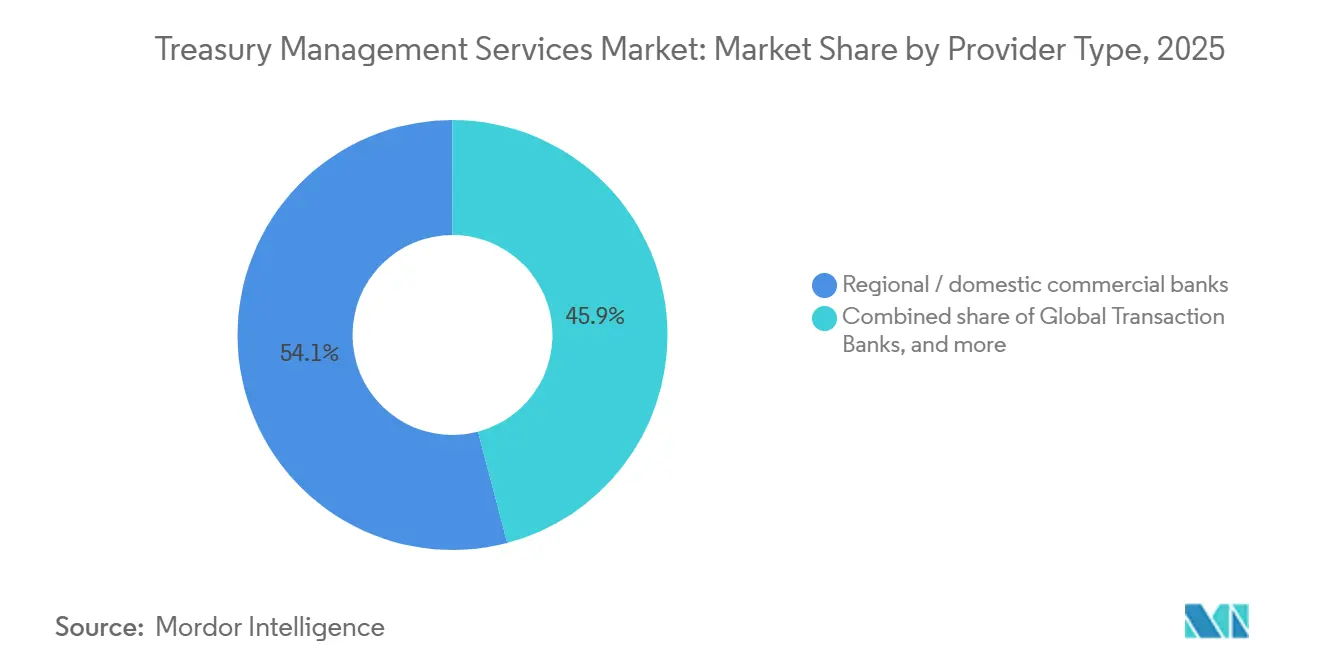
- By provider type, regional and domestic commercial banks held 54.1% of the treasury management services market share in 2025, while specialist non-bank operational-treasury providers are projected to grow at a 9.2% CAGR through 2031.
- By industry vertical, manufacturing and industrial held 19.6% of the treasury management services market share in 2025, while retail, consumer goods, and e-commerce are projected to grow at a 7.3% CAGR through 2031.
- By geography, North America held 34.7% of the treasury management services market share in 2025, while South America is projected to grow at a 7.5% CAGR through 2031.
Note: Market size and forecast figures in this report are generated using Mordor Intelligence’s proprietary estimation framework, updated with the latest available data and insights as of January 2026.
Global Treasury Management Services Market Trends and Insights
Drivers Impact Analysis*
| Driver | % Impact on CAGR Forecast | Geographic Relevance | Impact Timeline |
|---|---|---|---|
| Growing demand for real-time cash and liquidity visibility | +1.2% | Global: The highest intensity in North America and the Asia-Pacific | Short term (≤ 2 years) |
| Increasing cross-border payment and FX management complexity | +1.0% | Global; concentrated in North America, Europe, and the Asia-Pacific corridors | Medium term (2–4 years) |
| AI-enabled treasury automation and advanced cash forecasting | +0.9% | Global; most mature deployment in North America | Short to medium term |
| Increasing need for working capital and liquidity optimization | +0.8% | Global, led by North America and Europe | Medium term (2–4 years) |
| Expansion of cloud-based treasury management platforms | +0.7% | Global; accelerating in Asia-Pacific and South America | Short term (≤ 2 years) |
| Growing regulatory compliance, fraud prevention and cybersecurity requirements | +0.6% | Europe (PSD3/ISO 20022), North America, Asia-Pacific | Medium term (2–4 years) |
| Source: Mordor Intelligence | |||
Growing Demand for Real-Time Cash and Liquidity Visibility
The treasury management services market is benefiting from the growing need for current cash and liquidity information. This need is strengthening demand across the treasury management services market. Real-time payment networks have removed much of the overnight processing buffer that treasury teams previously used for liquidity decisions. FedNow, SEPA Instant, and comparable networks require companies to monitor positions throughout the day. The Association for Financial Professionals reported that 68% of corporate treasury departments used artificial intelligence or machine learning in forecasting in 2025, compared with 41% in 2023. A 2025 Asia Pacific cash management survey found that all respondents ranked real-time cash flow management as a top priority. Better visibility can reduce excess cash holdings and limit short-term credit use when organizations can identify funding needs earlier.
Increasing Cross-Border Payment and Foreign Exchange Management Complexity
Cross-border activity is increasing the number of payment corridors, currencies, and controls that treasury teams must manage. Standard Chartered reported that cross-border payment volumes reached USD 194 trillion in 2024 and are forecast to reach USD 320 trillion by 2032. Its research also found that 56% of corporates ranked foreign exchange risk management as their top treasury priority. The move away from SWIFT MT103 and MT202 formats requires companies to support structured ISO 20022 information across enterprise resource planning, treasury, and bank connectivity systems. J.P. Morgan noted in 2026 that 30% of global trade could shift to alternative corridors by 2035, increasing the need to recalibrate hedging and payment strategies[1]https://www.jpmorgan.com/insights/payments/fx-cross-border/2026-trends-for-financial-institutions. The treasury management services market therefore has opportunities for platforms that combine local instant payment networks, SWIFT CBPR+, and emerging settlement options within one controlled workflow.
Artificial Intelligence-Enabled Treasury Automation and Advanced Cash Forecasting
Artificial intelligence is becoming a regular tool in the treasury management services market rather than a limited trial. The Association for Financial Professionals found that 68% of treasury departments used artificial intelligence or machine learning for forecasting in 2025, but only 22% reported high confidence in forecast accuracy. This difference shows that adoption has moved faster than model reliability and governance. J.P. Morgan stated that artificial intelligence forecasting models can reduce forecast error rates by up to 50%. Bank of America reported in December 2025 that more than 3,000 companies used CashPro Forecasting and had saved more than 250,000 collective hours[2]https://newsroom.bankofamerica.com/content/newsroom/press-releases/2025/12/bofa-s-ai-solution-cashpro-forecasting--helps-clients-navigate-y.html. The technology can reduce manual work while moving staffing needs toward people who can manage risk, data, and strategic decisions.
Expansion of Cloud-Based Treasury Management Platforms
Cloud delivery is expanding the addressable customer base for the treasury management services market. It also supports broader access to the treasury management services market among smaller organizations. It lowers the infrastructure burden associated with older on-premise deployments and can shorten the time needed to introduce core treasury modules. FIS launched Treasury and Risk Manager, Quantum Cloud Edition, in April 2025 with a Liquidity Hub, SAP, and Oracle connectors, and real-time cash analytics. Frankfurt International Bank selected the platform in July 2026 to establish treasury and risk operations without legacy infrastructure[3]https://www.fisglobal.com/about-us/media-room/press-release/2026/frankfurt-international-bank-selects-fis-to-bypass-legacy-infrastructure. This approach can make formal treasury systems more practical for mid-market users who previously faced high implementation barriers. Automatic update paths also help companies respond to changing ISO 20022 and Payment Services Directive requirements across jurisdictions.
Restraints Impact Analysis*
| Restraint | % Impact on CAGR Forecast | Geographic Relevance | Impact Timeline |
|---|---|---|---|
| High implementation and integration complexity | -0.5% | Global; most acute in mid-market across Asia-Pacific and South America | Medium term (2–4 years) |
| High implementation, customization, and ongoing operating costs | -0.4% | Global; highest constraint in SME and mid-market segments | Medium term (2–4 years) |
| Data security, privacy, and third-party dependency risks | -0.3% | Global; regulatory escalation in North America and Europe | Short to medium term |
| Shortage of treasury technology and risk management expertise | -0.3% | North America highest shortage; widening in Asia-Pacific and Europe | Long term (≥ 4 years) |
| Source: Mordor Intelligence | |||
High Implementation and Integration Complexity
Implementation complexity remains a material restraint on the treasury management services market. It can delay purchasing decisions across the treasury management services market. Many organizations work with fragmented data environments that existed before the adoption of modern treasury platforms. NeuGroup reported in 2026 that more than 1 in 5 surveyed member companies operated multiple enterprise resource planning systems[4]https://connect.neugroup.com/public/blogs/treasury-technology-benchmark. Multiple systems can use inconsistent data models and require middleware before a treasury platform can produce consistent forecasts. Each additional entity, currency, or bank connection expands the work required to integrate and test the platform. The effect is particularly significant for mid-market companies that have limited information technology resources and less capacity to absorb a failed deployment.
Data Security, Privacy, and Third-Party Dependency Risks
Third-party exposure can delay treasury platform decisions because systems connect banks, payment intermediaries, and enterprise applications. The United States Treasury Office of Inspector General described how a compromised vendor key allowed Chinese state-sponsored hackers to access Treasury systems during the 2025 incident. The incident showed how a trusted access point can bypass direct perimeter controls. The Bank for International Settlements published a third-party risk discussion paper for financial market infrastructure in September 2026 that addresses concentration risk in payment, clearing, and settlement systems. Its focus indicates that oversight of provider ecosystems is becoming more stringent. Buyers are therefore placing greater weight on security, privacy, resilience, and governance before extending treasury connectivity.
*Our forecasts treat driver/restraint impacts as directional, not additive. The impact forecasts reflect baseline growth, mix effects, and variable interactions.
Segment Analysis
By Service Type: Payments Lead Revenue While Connectivity Leads Growth
Payments and disbursements held 33.8% of the treasury management services market size in 2025, making it the largest service category. Companies route large transaction volumes through banking channels, which supports this position. J.P. Morgan processed USD 16.1 trillion in payments on a single day in 2025 and routinely moved nearly USD 12 trillion daily across 120 currencies. Collections and receivables are becoming more complex as e-commerce creates multi-currency and multi-rail payment flows. These flows require automated matching and reconciliation at scale. Liquidity and cash concentration services also remain relevant for multinational groups seeking to centralize cash across entities. Commercial payables cards remain smaller, but J.P. Morgan Payments introduced business-to-business virtual card capabilities in Europe with Mastercard during 2025.
Account services, information reporting, and bank connectivity are projected to grow at a 7.1% CAGR through 2031. The treasury management services industry is seeing stronger demand for data connectivity as ISO 20022 replaces legacy bank-file formats. The November 2026 SWIFT requirement for structured postal addresses in CBPR+ messages is accelerating upgrade decisions across Europe, Asia Pacific, and North America. Treasury teams need information that can move between enterprise systems and banking partners in a structured format. Kyriba reported that its network spans more than 10,000 bank connections and processes USD 51 trillion in payments annually for more than 4,000 customers. This scale places connectivity closer to a shared operating layer than a stand-alone product feature. The faster growth rate reflects the value of timely and complete bank information for forecasting, controls, and reporting.


By Client Segment: Large Corporates Set Requirements While Mid-Market Clients Expand
Large corporates and multinationals held 37.2% of revenue in 2025, the largest client share in the treasury management services market. Their operations often include multi-entity cash pooling, in-house banking, foreign exchange hedging, and reporting across several jurisdictions. These needs create sustained reliance on premium banking and technology services. Financial institutions form a distinct revenue pool through correspondent banking and interbank settlement requirements. Public sector and nonprofit users also need compliance and reporting functions that align with accounting standards and procurement rules. The operating complexity of these clients establishes the functional baseline for higher-value treasury offerings.
Mid-market and commercial banking clients are projected to grow at a 6.6% CAGR through 2031. SaaS platforms have made structured treasury tools more viable for companies below USD 1 billion in revenue. Cross-border trade by mid-sized e-commerce businesses is also increasing the need for multi-currency management. The treasury management services industry is gaining opportunities as private equity owners seek to replace informal spreadsheet-based processes with standardized platforms. NeuGroup reported that Kyriba was used by nearly 30% of 226 surveyed companies in 2026, followed by FIS at 20% and ION Group at 17%. The Association for Financial Professionals found that 57% of respondents identified automation of manual processes as the second-most challenging treasury task in 2025. ISO 20022, Payment Services Directive 3, and Digital Operational Resilience Act requirements can add urgency to spending that some companies would otherwise defer.
By Provider Type: Regional Banks Lead Revenue While Specialists Grow Faster
Regional and domestic commercial banks held 54.1% of revenue in 2025, the largest provider share in the treasury management services market. Relationship banking, local regulatory knowledge, and embedded credit facilities give these banks an established advantage. These features can create meaningful switching costs for corporate customers. Global transaction banks, including J.P. Morgan, Citi, HSBC, BNY, and BNP Paribas, serve a premium segment. Their offerings combine correspondent banking, cross-border payments, cash management, foreign exchange, trade finance, and investment capabilities. This breadth is valuable for organizations that prefer an integrated institutional relationship.
Specialist non-bank operational-treasury providers are projected to grow at a 9.2% CAGR through 2031. Their growth reflects a willingness among mid-market and large companies to separate their banking relationships from their treasury technology. Modular software and lower SaaS deployment costs support this choice. Ripple acquired GTreasury for USD 1 billion in October 2025, adding a platform used by more than 1,000 customers across 160 countries. The company then launched a treasury and payments platform in Brazil in March 2026. The treasury management services market is therefore creating room for providers that can coordinate multiple payment rails without relying on a single bank-owned infrastructure.
By Industry Vertical: Manufacturing Holds Revenue While Retail and E-Commerce Modernize
Manufacturing and industrial held 19.6% revenue in 2025, the largest vertical share in the treasury management services market. Capital-intensive operations require close management of working capital, receivables, and cash forecasting. Bottomline reported in 2025 that 62% of manufacturing companies used artificial intelligence in cash forecasting, 63% used it in accounts payable, and 51% used it in fraud detection. The National Association of Manufacturers found in its 2024 survey that 67% of manufacturers identified working capital as a key financial concern. Financial corporations, information technology and telecommunications, healthcare, energy and utilities, transportation and logistics, and government users have separate regulatory and reporting needs. These requirements support demand for vertical-specific functions and controls.
Retail, consumer goods, and e-commerce are projected to grow at a 7.3% CAGR through 2031. Digital commerce generates high-frequency, multi-currency, and multi-rail flows that older batch-based treasury systems struggle to manage. Large platforms may process millions of transactions each day across dozens of payment rails and more than 50 currencies. The treasury management services market can support this workload through automated reconciliation and more current collection data. Standard Chartered found that Singapore, Malaysia, and Indonesia had raised transaction thresholds on real-time payment schemes, opening additional business-to-business use cases in retail supply chains. The Digital Operational Resilience Act is also creating demand in Europe for resilience and third-party risk controls among retail groups with financial services subsidiaries. These factors support infrastructure modernization in a vertical where payment complexity is rising quickly.
Geography Analysis
North America held 34.7% of revenue in 2025, the largest geographic share in the treasury management services market. The United States has 2 real-time payment rails, FedNow and The Clearing House RTP, and a high concentration of large corporate treasury functions. J.P. Morgan reported USD 19.3 billion in Payments revenue during 2025, an increase of 7%, while deposits grew 13% and fees rose 10%. Canada contributes through resource-sector requirements, where commodity-linked revenue creates continuing multi-currency exposure. Mexico benefits from nearshoring activity that adds cross-entity cash management and cross-border payment needs for manufacturers.
Europe remains shaped by an intensive regulatory timetable. The Payment Services Directive 3 and Payment Services Regulation texts were finalized before the European Parliament Economic and Monetary Affairs Committee in April 2026, with application expected in the first half of 2028 after a 21-month transposition period. The November 2026 ISO 20022 structured address mandate is accelerating connectivity upgrades, especially in Germany and the Netherlands. The United Kingdom CHAPS system had used ISO 20022 since June 2023, leaving British companies relatively advanced in structured-data migration. AFTE reported in January 2026 that 36% of surveyed French corporate treasurers expected improvements during 2026, while 35% expected stability. These conditions support steady technology investment and make programmable liquidity and application programming interface connectivity important competitive features.
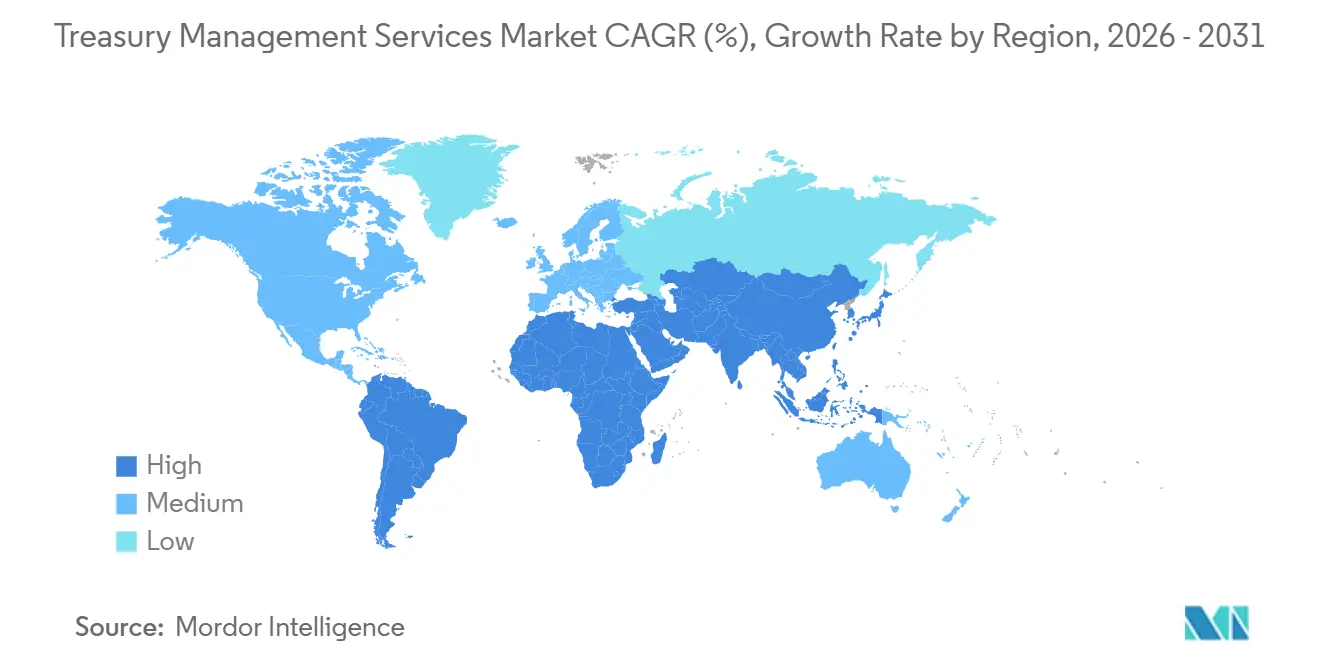
South America is projected to grow at a 7.5% CAGR through 2031, the fastest regional rate in the treasury management services market size. This expansion broadens the treasury management services market beyond its established North American base. Brazil's Pix processed 63.4 billion transactions in 2024, while its open finance framework processed more than 1.5 billion application programming interface calls each week. Ripple launched a full-stack digital banking infrastructure platform in Brazil and applied for a VASP license in March 2026. Asia Pacific is also advancing, as HSBC found that 90% of regional treasurers prioritized foreign exchange and interest-rate management in 2025. Citi launched Real-Time Funding for corporate clients in Singapore in August 2025, enabling automated cross-border liquidity transfers around the clock. The Middle East and Africa are emerging opportunities as Saudi Arabia and the United Arab Emirates invest in digital banking and payment capabilities.

Competitive Landscape
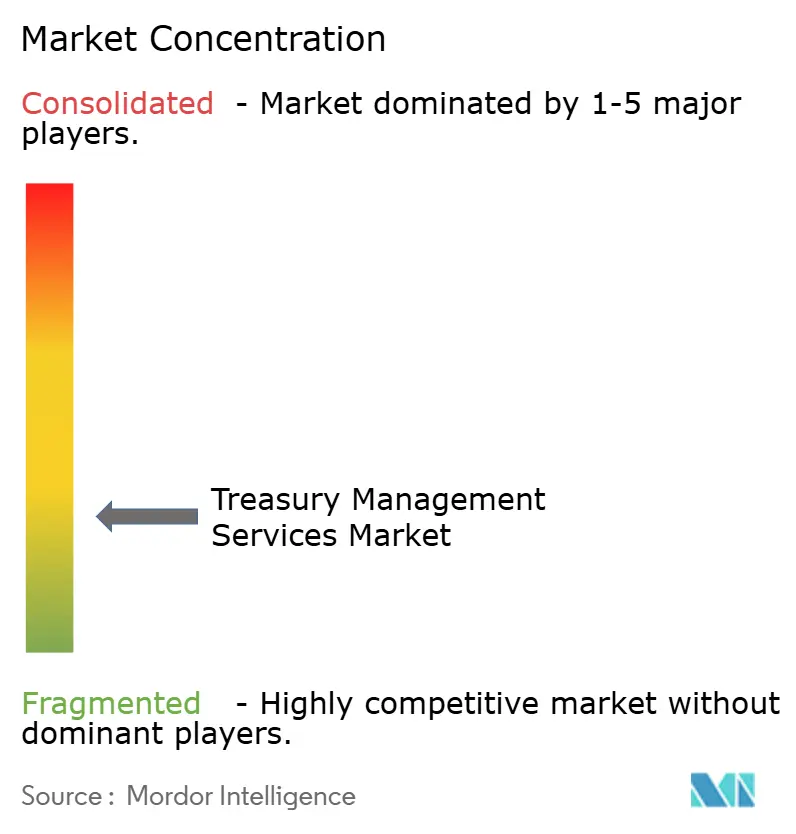
The treasury management services market is fragmented across global transaction banks, regional banks, and specialist software providers. Global transaction banks retain large revenue pools through correspondent banking networks and proprietary platforms. Specialist vendors compete through modular deployment, more flexible pricing, and artificial intelligence features that appeal to mid-market users. J.P. Morgan had a global treasury services share above 10% in 2025, following an increase of 400 basis points since 2019. The company also embeds cash forecasting tools in its payments operations. The USD 250 million to USD 2 billion revenue customer range remains important because cloud deployment can reduce implementation time to less than 90 days.
Specialist providers are strengthening their positions through partnerships and acquisitions. Kyriba partnered with J.P. Morgan Asset Management in April 2026 to embed Morgan Money in its platform. This allows teams to identify investable cash, review money market fund options, and execute decisions within a governed workflow. Kyriba also announced a partnership with Merge in July 2026 to bring Bank of England-authorized regulated stablecoin payment infrastructure to its more than 4,000 corporate clients. Ripple's USD 1 billion GTreasury acquisition combines digital-asset infrastructure with an established enterprise treasury platform. These moves show how providers are seeking to incorporate new settlement options into familiar treasury workflows.
FIS introduced its Neural Treasury suite in September 2025 with Treasury GPT, cash forecasting, automated reconciliation, and fraud monitoring capabilities. The treasury management services market is rewarding providers that can demonstrate dependable automation alongside established controls. ISO 20022 compliance, Digital Operational Resilience Act controls, and anti-money laundering and know-your-customer automation are becoming procurement considerations for regulated buyers. Banks continue to use their broad service relationships as a competitive advantage. Specialists continue to benefit from rail-neutral architecture and faster implementation. The competitive balance therefore favors a mix of integrated banking offerings and independent technology platforms rather than a single provider model.
Treasury Management Services Industry Leaders
J.P. Morgan Chase & Co.
Citigroup Inc.
HSBC Holdings plc
Bank of America Corporation
FIS Global
- *Disclaimer: Major Players sorted in no particular order

Recent Industry Developments
- September 2026: The Bank for International Settlements CPMI-IOSCO published its third-party risk discussion paper for financial market infrastructure, directly addressing concentration risk in payment, clearing, and settlement systems. The paper is expected to shape future regulatory oversight frameworks for treasury service providers with significant third-party dependency, including bank connectivity platforms and payment hub vendors.
- July 2026: FIS announced that Frankfurt International Bank AG selected Treasury & Risk Manager, Quantum Cloud Edition, to power its treasury and risk operations from inception, choosing cloud-native architecture over on-premise infrastructure from day 1. The deployment demonstrates that cloud-first treasury is now the default architectural posture for greenfield banking entities seeking institutional-grade capability without legacy overhead.
- July 2026: Kyriba and Merge announced a partnership to bring Bank of England-authorized, regulated stablecoin payment infrastructure to Kyriba's 4,000+ corporate clients globally, enabling faster, cheaper, and fully traceable cross-border settlement. The integration is the first stablecoin capability embedded natively within a leading enterprise TMS under a regulated, production-ready framework.
- June 2026: Kyriba and Fipto confirmed that Ledger and Mantu have deployed live stablecoin payment flows directly inside the Kyriba TMS using Fipto's regulated European rails, making these the first companies to execute production-ready stablecoin treasury operations embedded within an enterprise TMS in Europe. Treasury teams initiate and monitor stablecoin payments within Kyriba, with balances reconciled in real time.


Global Treasury Management Services Market Report Scope
| Payments and Disbursements |
| Collections and Receivables |
| Liquidity and Cash Concentration |
| Account Services, Information Reporting, and Bank Connectivity |
| Commercial Payables Cards |
| Large Corporates and Multinationals |
| Mid-Market/Commercial Banking Clients |
| Financial-Institution Clients |
| Public Sector and Non-Profits |
| Global Transaction Banks |
| Regional/Domestic Commercial Banks |
| Specialist Non-Bank Operational-Treasury Providers |
| Financial Corporations |
| Manufacturing and Industrial |
| Retail, Consumer Goods and E-Commerce |
| Information Technology and Telecommunications |
| Healthcare and Life Sciences |
| Energy and Utilities |
| Transportation and Logistics |
| Government and Public Sector |
| Other Industry Verticals |
| North America | United States |
| Canada | |
| Mexico | |
| South America | Brazil |
| Argentina | |
| Rest of South America | |
| Europe | United Kingdom |
| Germany | |
| France | |
| Italy | |
| Spain | |
| Rest of Europe | |
| Asia-Pacific | China |
| Japan | |
| India | |
| South Korea | |
| Australia | |
| Indonesia | |
| Thailand | |
| Malaysia | |
| Singapore | |
| Vietnam | |
| Rest of Asia-Pacific | |
| Middle East and Africa | Saudi Arabia |
| United Arab Emirates | |
| Turkey | |
| South Africa | |
| Egypt | |
| Rest of Middle East and Africa |
| By Service Type | Payments and Disbursements | |
| Collections and Receivables | ||
| Liquidity and Cash Concentration | ||
| Account Services, Information Reporting, and Bank Connectivity | ||
| Commercial Payables Cards | ||
| By Client Segment | Large Corporates and Multinationals | |
| Mid-Market/Commercial Banking Clients | ||
| Financial-Institution Clients | ||
| Public Sector and Non-Profits | ||
| By Provider Type | Global Transaction Banks | |
| Regional/Domestic Commercial Banks | ||
| Specialist Non-Bank Operational-Treasury Providers | ||
| By Industry Vertical | Financial Corporations | |
| Manufacturing and Industrial | ||
| Retail, Consumer Goods and E-Commerce | ||
| Information Technology and Telecommunications | ||
| Healthcare and Life Sciences | ||
| Energy and Utilities | ||
| Transportation and Logistics | ||
| Government and Public Sector | ||
| Other Industry Verticals | ||
| By Geography | North America | United States |
| Canada | ||
| Mexico | ||
| South America | Brazil | |
| Argentina | ||
| Rest of South America | ||
| Europe | United Kingdom | |
| Germany | ||
| France | ||
| Italy | ||
| Spain | ||
| Rest of Europe | ||
| Asia-Pacific | China | |
| Japan | ||
| India | ||
| South Korea | ||
| Australia | ||
| Indonesia | ||
| Thailand | ||
| Malaysia | ||
| Singapore | ||
| Vietnam | ||
| Rest of Asia-Pacific | ||
| Middle East and Africa | Saudi Arabia | |
| United Arab Emirates | ||
| Turkey | ||
| South Africa | ||
| Egypt | ||
| Rest of Middle East and Africa | ||


Key Questions Answered in the Report
What is driving treasury management services adoption?
Real-time payment rails, ISO 20022 migration, cloud platforms, and artificial intelligence-based forecasting are increasing demand for connected treasury tools.
Which service category has the largest treasury management services revenue share?
Payments and disbursements held 33.8% revenue share in 2025.
Which treasury service is forecast to grow the fastest?
Account services, information reporting, and bank connectivity is projected to grow at a 7.1% CAGR through 2031.
Which client group uses treasury platforms most extensively?
Large corporates and multinationals held 37.2% revenue share in 2025 because of their multi-entity, cross-border, and hedging needs.
Which region is expanding fastest for treasury services?
South America is projected to grow at a 7.5% CAGR through 2031, supported by Brazil’s payment and open finance infrastructure.
What limits adoption of treasury technology?
Integration complexity and third-party security risks can delay deployment, particularly for organizations with fragmented systems.
Page last updated on:





