Market Overview
| Study Period | 2020 - 2031 |
|---|---|
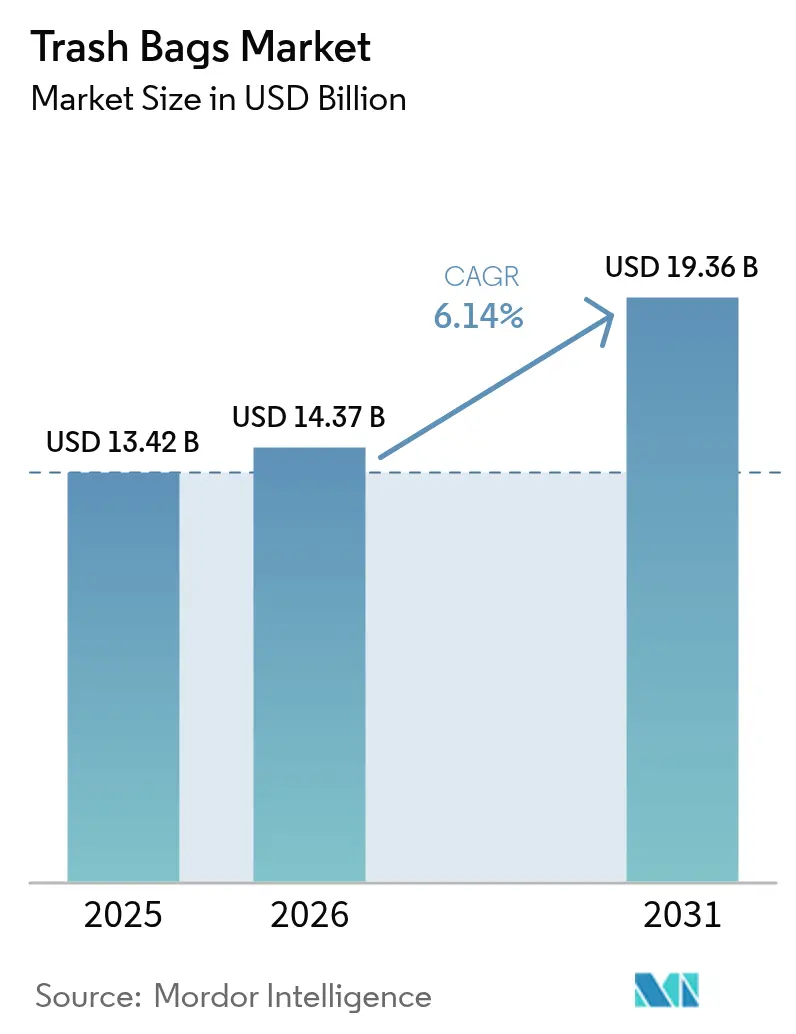
| Market Size (2026) | USD 14.37 Billion |
| Market Size (2031) | USD 19.36 Billion |
| Growth Rate (2026 - 2031) | 6.14% CAGR |
| Fastest Growing Market | Asia Pacific |
| Largest Market | Asia Pacific |
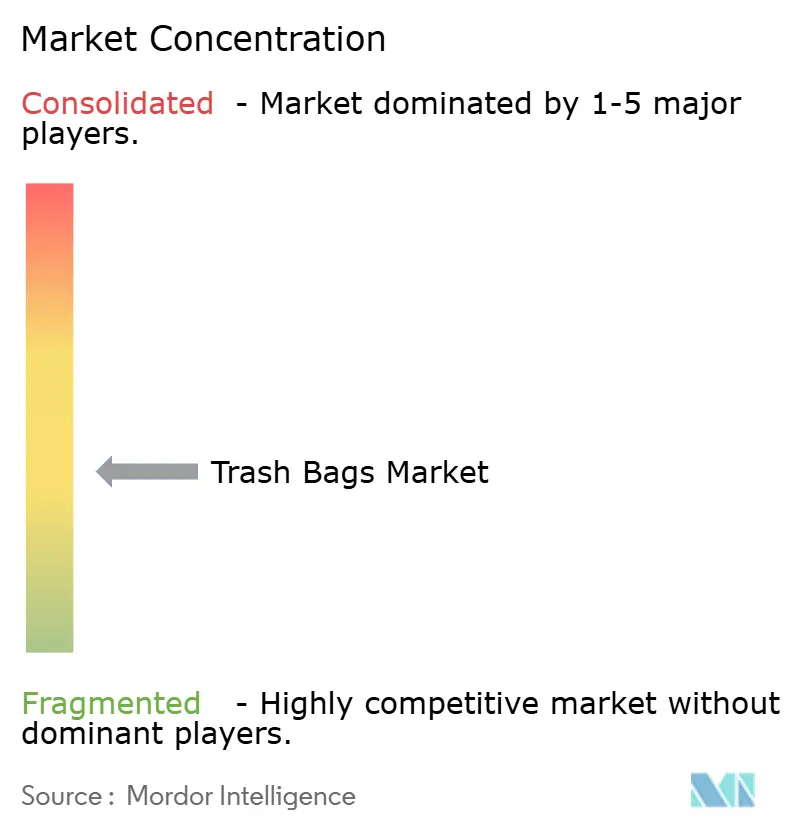
| Market Concentration | Medium |
Major Players *Disclaimer: Major Players sorted in no particular order Image © Mordor Intelligence. Reuse requires attribution under CC BY 4.0. | |
Trash Bags Market Analysis by Mordor Intelligence
The trash bags market size is expected to grow from USD 13.42 billion in 2025 to USD 14.37 billion in 2026 and is forecast to reach USD 19.36 billion by 2031, registering a CAGR of 6.14% over 2026-2031. Demand is shifting away from undifferentiated commodity liners toward value-added formats that embed price signals, hygiene features, and compostable performance. Municipal pay-as-you-throw policies are turning each bag into a behavioral lever that nudges residents to limit disposal volume, while bioplastics reached feedstock cost parity with LDPE and LLDPE in late 2025, removing the primary barrier to mass adoption. E-commerce grocery growth is amplifying the need for puncture-resistant, odor-barrier liners that protect perishables in last-mile delivery. Recycled-content mandates in California and the European Union are accelerating investment in closed-loop supply chains, and AI-enabled robotic sorters are lifting recycled-HDPE purity above 95%, narrowing the performance gap with virgin resin. Ethylene price swings remain a headwind for converters that lack vertical integration, yet capacity rationalization among smaller regional players is tightening supply, supporting price realization.
Key Report Takeaways
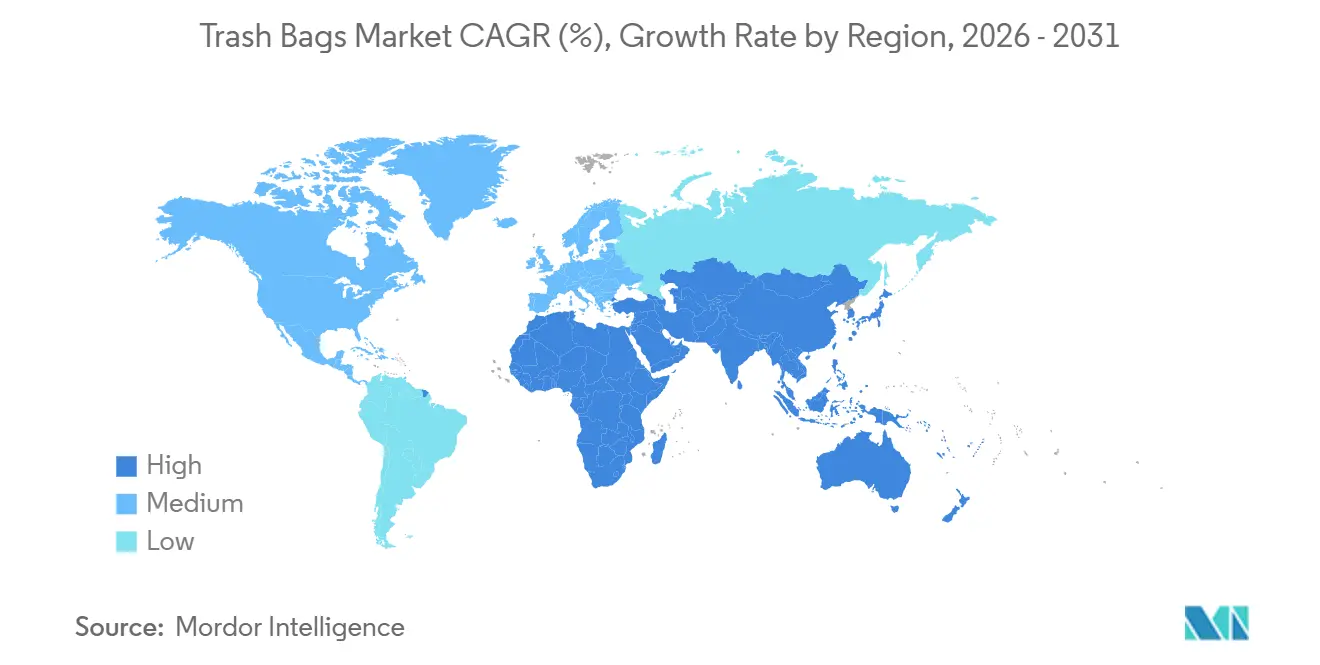
- By geography, Asia-Pacific led with 39.60% regional revenue share in 2025 and is projected to register a 7.09% CAGR through 2031.
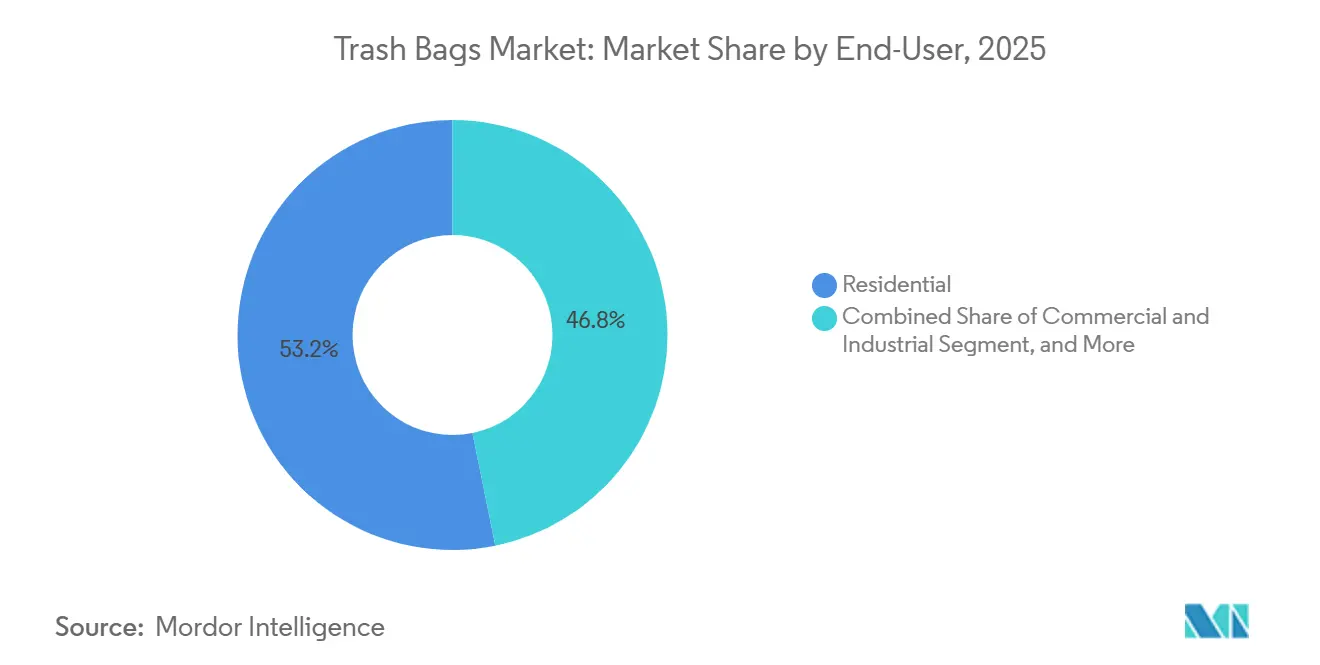
- By end-user, residential applications commanded 53.19% revenue share in 2025, while the institutional segment is projected to expand at a 6.73% CAGR through 2031.
- By material type, linear low-density polyethylene led with 44.14% of trash bags market share in 2025, whereas bio-based and biodegradable plastics are forecast to grow at a 6.91% CAGR between 2026-2031.
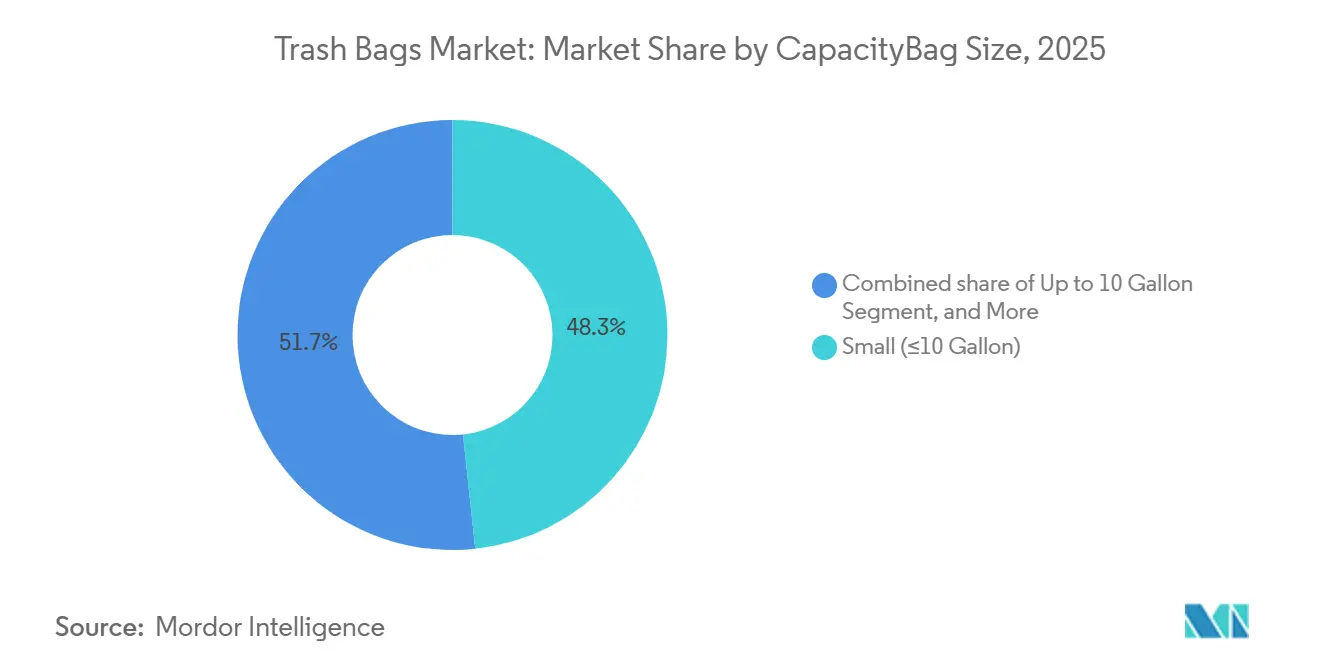
- By capacity, small bags up to 10 gallons held 48.32% of trash bags market size in 2025, while the 30-55 gallon bracket is set to advance at a 6.89% CAGR to 2031.
- By sales channel, retail formats accounted for 32.89% share of the trash bags market size in 2025 and are anticipated to rise at a 6.69% CAGR over 2026-2031.
Note: Market size and forecast figures in this report are generated using Mordor Intelligence’s proprietary estimation framework, updated with the latest available data and insights as of 2026.
Global Trash Bags Market Trends and Insights
Drivers Impact Analysis*
| Driver | (~) % Impact on CAGR Forecast | Geographic Relevance | Impact Timeline |
|---|---|---|---|
| High urban waste generation and need for seamless collection | +1.8% | Global, with intensity in Asia-Pacific megacities and Sub-Saharan Africa | Medium term (2-4 years) |
| Hygiene-centric consumer behavior post-pandemics | +1.2% | North America, Europe, urban Asia-Pacific | Short term (≤ 2 years) |
| Rise of pay-as-you-throw municipal fee models | +1.0% | North America (Massachusetts, Connecticut, New Hampshire), Europe (Italy, Netherlands) | Medium term (2-4 years) |
| Expansion of online grocery requiring leak-proof liners | +0.9% | Global, led by North America and Europe | Short term (≤ 2 years) |
| Bioplastic price parity with LDPE/LLDPE feedstocks | +0.7% | Global, early adoption in Europe and select Asia-Pacific markets | Long term (≥ 4 years) |
| AI-enabled robotic sorters boosting recycled-HDPE supply | +0.6% | North America, Europe, advanced Asia-Pacific facilities | Medium term (2-4 years) |
| Source: Mordor Intelligence | |||
High Urban Waste Generation And Need For Seamless Collection
Rapid urbanization in Asia-Pacific and Africa is shrinking daily collection windows, which raises demand for high-tensile liners that survive mechanical compaction and curbside lifting. China mandated waste sorting in 297 cities by December 2024, creating immediate pull for color-coded bags that match municipal collection streams.[1]Ministry of Housing and Urban-Rural Development, “Mandatory Waste Sorting Programs,” mohurd.gov.cn India’s Swachh Bharat Mission 2.0 earmarked INR 1.41 trillion (USD 17 billion) for urban solid-waste upgrades, including RFID-tagged bags that enable route optimization. Bangkok introduced chip-embedded liners in 2025 and cut household waste 28% within six months.[2]SBangkok Metropolitan Administration, “RFID-Tagged Bag Results,” bangkok.go.th These programs treat the bag as a data carrier, not just a container, positioning smart liners as essential infrastructure rather than discretionary packaging.
Hygiene-Centric Consumer Behavior Post-Pandemics
Infection-control protocols adopted during COVID-19 endure in 2026, especially in healthcare, hospitality, and education. Hospitals participating in the U.S. Environmental Protection Agency’s WasteWise initiative lifted purchases of leak-proof and antimicrobial liners by 19% over 2023-2025.[3]U.S. Environmental Protection Agency, “WasteWise Hospital Report,” epa.gov European hotel chains specify EN 13432-certified compostable bags to satisfy the region’s recyclability rule, and Japan’s new double-bagging guideline for medical waste increased 13-30 gallon institutional demand 11% year-over-year through 2025. These hygiene and segregation standards underpin premium-priced specialty films that outpace commodity formats.
Rise Of Pay-As-You-Throw Municipal Fee Models
Variable-rate pricing links disposal fees directly to bag volume, motivating households to downsize liner capacity. Three Massachusetts towns that adopted pay-as-you-throw in 2024 saw residential tonnage fall 44% within 18 months. Bloomington, Indiana, shifted 37% of households to smaller formats after introducing tiered liner pricing. Treviso, Italy, uses RFID-tagged bags to audit disposal frequency, pushing per-capita waste down 30% from 2023 levels. Premium certified-weight liners meet the accountability requirement, opening a defensible niche with higher margins.
Bioplastic Price Parity With LDPE And LLDPE Feedstocks
Polylactic acid and polybutylene adipate terephthalate achieved manufacturing cost parity with petro-based polyethylene in Q4 2025. NatureWorks’ 75 000 ton Thailand plant delivers PLA at USD 1.52 per kg, within 3% of spot LLDPE. BASF’s biomass-balanced PBAT is priced at EUR 1.68 per kg (USD 1.79) in Europe, enabling Clorox to release a compostable Glad liner at equal shelf price to its conventional offering. San Francisco’s municipal organics collection now mandates 100% compostable liners for 2026 service contracts, proof that economics have tipped in favor of sustainable alternatives.
Restraints Impact Analysis*
| Restraint | (~) % Impact on CAGR Forecast | Geographic Relevance | Impact Timeline |
|---|---|---|---|
| Single-use plastic bans and extended producer responsibility | -1.4% | Europe (EU Regulation 2025/40), North America (California SB 1053, Washington HB 1085), select Asia-Pacific markets (India, Thailand) | Short term (≤ 2 years) |
| Volatile ethylene prices squeezing converter margins | -0.9% | Global, acute in regions dependent on imported naphtha (Europe, Japan, India) | Short term (≤ 2 years) |
| Compostable-bag performance gaps in humid climates | -0.5% | Tropical and subtropical zones (Southeast Asia, Sub-Saharan Africa, South America) | Medium term (2-4 years) |
| Growing refill/reuse station pilots in retail chains | -0.3% | Europe (Carrefour, Tesco), North America (Walmart, Kroger) | Long term (≥ 4 years) |
| Source: Mordor Intelligence | |||
Single-Use Plastic Bans And Extended Producer Responsibility
California’s SB 1053 will bar sale of trash bags with less than 20% recycled content from January 2026, while Washington’s HB 1085 obliges producers to bankroll statewide collection infrastructure, adding up to USD 0.06 per 30-gallon unit. The European Union’s Regulation 2025/40 imposes a 30% recycled-content threshold by 2028 and full real-world recyclability by 2030. Non-compliant suppliers must either purchase pricey post-consumer resin or exit regulated markets, compressing margins and reorganizing supply chains around traceable recycled feedstocks.
Volatile Ethylene Prices Squeezing Converter Margins
North American spot ethylene swung between USD 620-1 050 per ton from Q1 2024-Q3 2025, while European contracts averaged EUR 980 per ton (USD 1 045) in H1 2025 due to gas-supply disruptions. Inteplast reported a 250 basis-point EBITDA erosion in 2024, and Indian converter margins fell to 6.5%. Suppliers on annual fixed-price retail contracts struggle to recoup feedstock spikes, triggering consolidation and localized capacity shutdowns that can delay deliveries and erode customer loyalty.
*Our forecasts treat driver/restraint impacts as directional, not additive. The impact forecasts reflect baseline growth, mix effects, and variable interactions.
Segment Analysis
By End-User: Institutional Growth Outpaces Residential Dominance
The institutional segment, covering HoReCa, healthcare, and education, is projected to grow at a 6.73% CAGR through 2031, the fastest among end-users. Hospitals value leak-proof, antimicrobial liners that meet infection-control codes, often paying 20-30% premiums. The American Hospital Association reported 78% adoption of color-segregated liner systems in 2025. Hotel brands mandate compostable kitchen liners to comply with local organics rules, and U.S. university systems are migrating to 100% post-consumer recycled content by 2027.
Residential users still represent a 53.19% revenue majority, sustained by e-commerce subscriptions and private-label promotions. Reynolds’ direct-to-consumer model captured 11% of its trash bag revenue in 2025. Pay-as-you-throw pricing nudges households toward smaller capacities, yet baseline volume is bolstered by ongoing urbanization and multigenerational housing formations that increase per-home liner turnover.


By Material Type: Bioplastics Narrow The Gap
LLDPE maintained 44.14% revenue share in 2025 thanks to puncture resistance and cost efficiency, while HDPE benefits from rising high-purity recycled supply enabled by AI sorting. California’s 25% recycled-content rule for 2028 positions HDPE as a favorable substrate. LDPE holds pockets of demand in low-gauge dry-waste bags but loses share to metallocene LLDPE.
Bio-based and biodegradable plastics, led by PLA and PBAT, are set to post a 6.91% CAGR. Cost parity, coupled with city-level compostable mandates, unlocks municipal procurement. Fraunhofer’s PLA block-copolymer work boosts elongation-at-break above 600%, easing fears of brittleness in curbside handling. Danimer’s PHA pilot with Walmart offers proof of concept for humidity-resilient compostable formulations in warm climates.
By Capacity: Mid-Range Bags Lead Commercial Uptake
Small bags up to 10 gallons accounted for 48.32% of capacity revenue in 2025, dominating kitchen and bathroom use. Pay-as-you-throw adoption spurred a 22% rise in 13-gallon bag sales in Massachusetts during 2024. The 30-55 gallon bracket will grow fastest at 6.89% as logistics warehouses, restaurants, and retailers consolidate waste collection.
Above-55-gallon liners serve construction, hospitality, and event venues that require 1.5-mil gauges for heavy loads. The National Restaurant Association found 63% of full-service outlets switched to larger liners to support food-waste diversion. Private-label pressure in the sub-10-gallon tier trims branded margins, forcing premium suppliers to add odor-control or subscription conveniences to protect shelf presence.
By Sales Channel: Retail Keeps The Lead, Institutional Contracts Expand
Retail outlets captured 32.89% of sales in 2025 and will rise at a 6.69% CAGR. Amazon’s Solimo and Presto private labels absorbed an estimated 14% of U.S. online sales, pressuring branded price points. Supermarkets still drive impulse volume, as Walmart’s Q4 2025 rollback led to an 18% quarterly lift in 30-gallon Hefty units.
Institutional procurement gains share via group purchasing contracts. The U.S. General Services Administration’s 2025 schedule specifies 25% recycled content, advantaging converters with in-house PCR capacity. Wholesale distributors such as Sysco favor bulk-case packs that lower per-unit cost 12-15% versus retail formats, reinforcing economies of scale for high-volume extruders.
Geography Analysis
Asia-Pacific delivered 39.60% of global trash bags revenue in 2025 and is projected to post a 7.09% CAGR through 2031. Mandatory sorting programs in China and India drive procurement of coded and RFID-enabled liners, while Thailand and Vietnam channel urban-infrastructure budgets toward large-capacity commercial bags. Japan’s compostable mandate for food-waste collection increased bio-based plastic demand 19% over 2024-2025. Southeast Asian humidity challenges durability of current bioplastic blends, signaling an innovation gap for tropical-grade compostables.
North America and Europe set the regulatory pace. California requires 20% recycled content from 2026, and the EU will enforce 30% by 2028. Pay-as-you-throw programs in New England towns cut residential tonnage by up to 44%, proving price signals influence liner volume. Germany’s higher producer fees for non-recyclable films accelerate the shift to mono-material LLDPE or compostable formats, and the United Kingdom’s producer-funded collection model adds direct cost pressure on converters.
Middle East, Africa, and South America represent emerging footholds. Saudi Arabia allocated SAR 12 billion (USD 3.2 billion) to modernize urban waste systems, lifting commercial liner demand 16% in 2024. The UAE targets 75% landfill diversion by 2030 and mandates compostable organics liners. Brazil’s 2024 amendments require organics collection in cities over 100 000 residents by 2027, creating a USD 64 million compostable-liner opportunity. South Africa and Argentina impose extended producer responsibility fees that suppliers pass through as 8-10% price hikes, but local manufacturing shields regional converters from import duties and currency volatility.

Competitive Landscape
The market is moderately fragmented. Amcor utilizes upstream resin integration to buffer ethylene swings, sustaining a 14% global share. Reynolds leverages Hefty’s 68% U.S. household penetration but faces 22-28% price undercuts from Amazon’s private labels. Clorox’s Glad brand trails in Europe where Novolex and Pack-It offer compostable certificates at equal shelf price.
Regional converters such as Kemii Garbage Bag, Cosmoplast, and Luban Packing capture municipal contracts with 15-20% discounts enabled by lower labor and freight costs. Their agile lines pivot quickly to RFID-tagged or recycled-content specifications, eroding multinationals’ tender advantage.
Innovation gaps create white-space opportunities. Durable compostable liners for humid climates could unlock an estimated USD 420 million annual niche by 2028. Closed-loop supply chains built on AI-sorted recycled HDPE help suppliers comply with recycled-content mandates without costly third-party resin, preserving margins while satisfying regulation.
Trash Bags Industry Leaders
Terdex GmbH
Novplasta, s.r.o.
Amcor Plc
Reynolds Consumer Products Inc. (Hefty)
Novolex Holdings LLC
- *Disclaimer: Major Players sorted in no particular order

Recent Industry Developments
- September 2025: Clorox introduced a compostable Glad 13-gallon bag using BASF ecoflex PBAT resin, priced on par with conventional LLDPE.
- April 2025: Clorox introduced Glad 2× Stronger trash bags featuring tear-resistant film and odor defense.
- March 2025: Reynolds Consumer Products launched a direct-to-consumer Hefty subscription that reached 11% of its trash bag revenue by year-end 2025.
- January 2025: Amcor and Berry Global announced a USD 8.43 billion all-stock merger to expand sustainable flexible-packaging capacity.


Global Trash Bags Market Report Scope
A trash bag is a disposable bag used to contain waste. The study tracks the market through the revenue accrued by the consumption of trash bags offered by various vendors operating in the market. It also analyzes the current trade scenario and the major manufacturing countries.
The Trash Bags Market Report is Segmented by End-User (Residential, Institutional, Commercial and Industrial), Material Type (HDPE, LDPE, LLDPE, Bio-based/Biodegradable Plastics), Capacity/Bag Size (Up to 10 Gallon, 13-30 Gallon, 30-55 Gallon, Above 55 Gallon), Sales Channel (Retail, B2B/Institutional Procurement, Distribution/Wholesale), and Geography (North America, Europe, Asia-Pacific, Middle East, Africa, South America). The Market Forecasts are Provided in Terms of Value (USD).
By End-user
| Residential |
| Institutional (HoReCa, Healthcare, Education) |
| Commercial and Industrial |
By Material Type
| High-Density Polyethylene (HDPE) |
| Low-Density Polyethylene (LDPE) |
| Linear Low-Density Polyethylene (LLDPE) |
| Bio-based/Biodegradable Plastics (PLA, PBAT, PHA) |
By Capacity / Bag Size
| Up to 10 Gallon |
| 13 - 30 Gallon |
| 30 - 55 Gallon |
| Above 55 Gallon |
By Sales Channel
| Retail (Supermarkets, Convenience, Online) |
| B2B / Institutional Procurement |
| Distribution / Wholesale |
By Geography
| North America | United States |
| Canada | |
| Mexico | |
| Europe | Germany |
| United Kingdom | |
| France | |
| Italy | |
| Spain | |
| Russia | |
| Rest of Europe | |
| Asia-Pacific | China |
| India | |
| Japan | |
| South Korea | |
| Australia and New Zealand | |
| Rest of Asia-Pacific | |
| Middle East | United Arab Emirates |
| Saudi Arabia | |
| Turkey | |
| Rest of Middle East | |
| Africa | South Africa |
| Nigeria | |
| Egypt | |
| Rest of Africa | |
| South America | Brazil |
| Argentina | |
| Rest of South America |
| By End-user | Residential | |
| Institutional (HoReCa, Healthcare, Education) | ||
| Commercial and Industrial | ||
| By Material Type | High-Density Polyethylene (HDPE) | |
| Low-Density Polyethylene (LDPE) | ||
| Linear Low-Density Polyethylene (LLDPE) | ||
| Bio-based/Biodegradable Plastics (PLA, PBAT, PHA) | ||
| By Capacity / Bag Size | Up to 10 Gallon | |
| 13 - 30 Gallon | ||
| 30 - 55 Gallon | ||
| Above 55 Gallon | ||
| By Sales Channel | Retail (Supermarkets, Convenience, Online) | |
| B2B / Institutional Procurement | ||
| Distribution / Wholesale | ||
| By Geography | North America | United States |
| Canada | ||
| Mexico | ||
| Europe | Germany | |
| United Kingdom | ||
| France | ||
| Italy | ||
| Spain | ||
| Russia | ||
| Rest of Europe | ||
| Asia-Pacific | China | |
| India | ||
| Japan | ||
| South Korea | ||
| Australia and New Zealand | ||
| Rest of Asia-Pacific | ||
| Middle East | United Arab Emirates | |
| Saudi Arabia | ||
| Turkey | ||
| Rest of Middle East | ||
| Africa | South Africa | |
| Nigeria | ||
| Egypt | ||
| Rest of Africa | ||
| South America | Brazil | |
| Argentina | ||
| Rest of South America | ||


Key Questions Answered in the Report
What is the current size of the trash bags market and how fast is it growing?
The trash bags market stands at USD 14.36 billion in 2026 and is forecast to expand to USD 19.37 billion by 2031 at a 6.15% CAGR.
Which region holds the largest trash bags market share today?
Asia-Pacific leads with 40.32% of global revenue, propelled by rapid urbanization and advancing waste-collection infrastructure.
Why are institutional buyers outpacing residential growth?
Hospitals, hotels and schools demand odor-neutralizing and antimicrobial liners, supporting a 9.58% CAGR for the institutional segment.
How are single-use-plastic bans affecting manufacturers?
Extended-producer-responsibility rules elevate compliance costs and accelerate a shift to recycled or bio-based films, trimming market CAGR by 1.38%.
Which trash-bag capacity is most popular and why?
Standard 13-30 gallon liners command 35.05% of 2025 revenue because they align with automated curbside bins and PAYT requirements.
What recent mergers might reshape competitive dynamics?
The pending Amcor–Berry Global and Novolex–Pactiv Evergreen deals will consolidate capacity and bolster investment in sustainable materials.
Page last updated on:


