
Thermoformed Plastics Market Size and Share
Market Overview
| Study Period | 2021 - 2031 |
|---|---|
| Market Size (2026) | USD 16.84 Billion |
| Market Size (2031) | USD 22.13 Billion |
| Growth Rate (2026 - 2031) | 5.62 % |
| Fastest Growing Market | Asia Pacific |
| Largest Market | Asia Pacific |
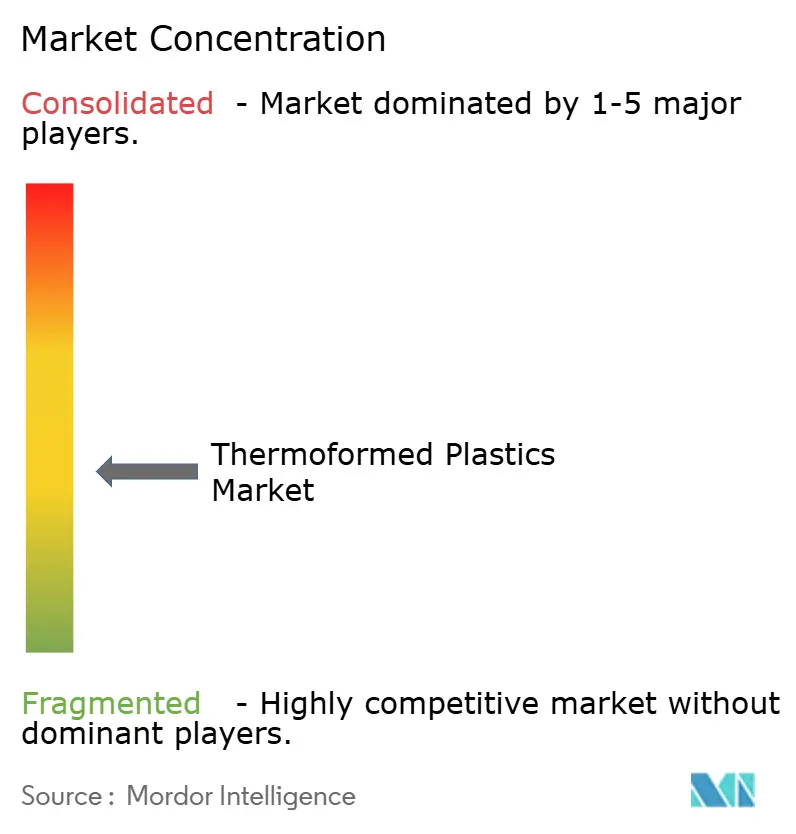
| Market Concentration | Medium |
Major Players *Disclaimer: Major Players sorted in no particular order Image © Mordor Intelligence. Reuse requires attribution under CC BY 4.0. | |
Thermoformed Plastics Market Analysis by Mordor Intelligence
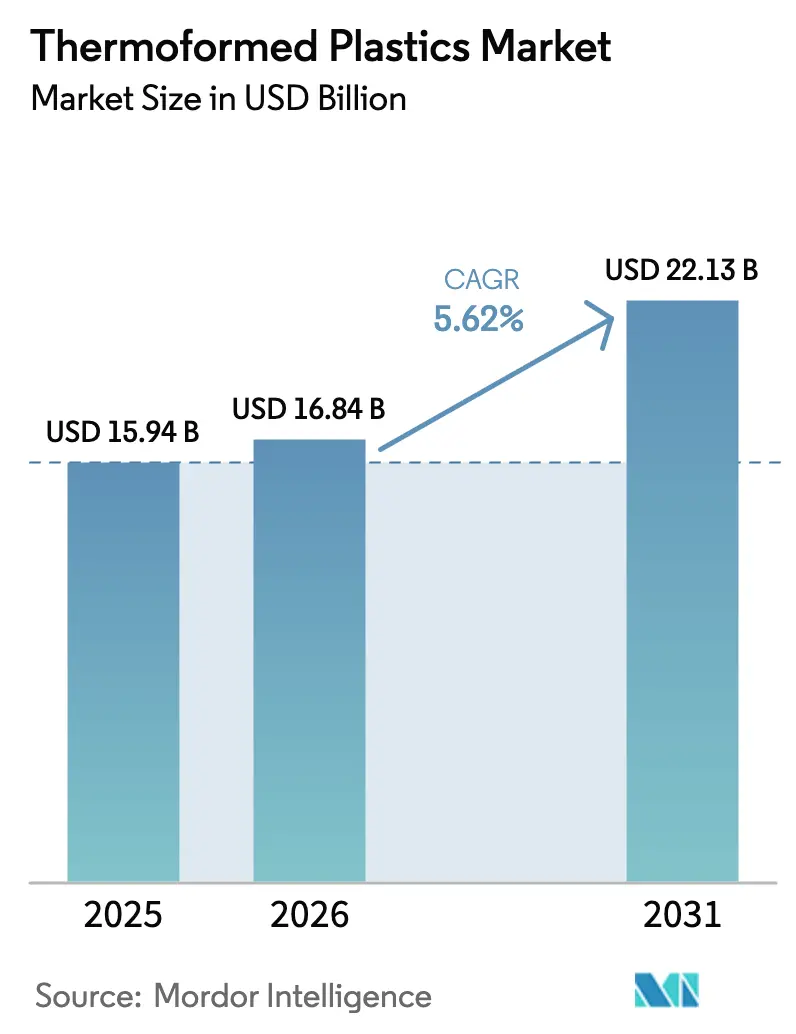
The Thermoformed Plastics Market size is expected to increase from USD 15.94 billion in 2025 to USD 16.84 billion in 2026 and reach USD 22.13 billion by 2031, growing at a CAGR of 5.62% over 2026-2031. Demand concentrates in food, beverage, healthcare, and automotive applications where thin- and thick-gauge sheets replace heavier or multi-part assemblies for cost and weight savings. Global brand owners accelerated recycled-content commitments after the European Union’s Packaging and Packaging Waste Regulation (PPWR) started phasing in minimum thresholds in 2024. Meanwhile, California’s SB 54 triggered similar momentum in North America by requiring 65% recyclability for single-use plastic packaging by 2032. Brand owners’ public sustainability goals have therefore insulated the thermoformed plastics market from cyclical feedstock price swings, although converters still face margin pressure when Brent crude volatility lifts resin costs faster than sales contracts adjust. Consolidation among mid-size processors is underway as Novolex completed its USD 6.7 billion purchase of Pactiv Evergreen in April 2025, capturing scale economies in recycled-PET procurement and cross-plant scheduling efficiencies.
Key Report Takeaways
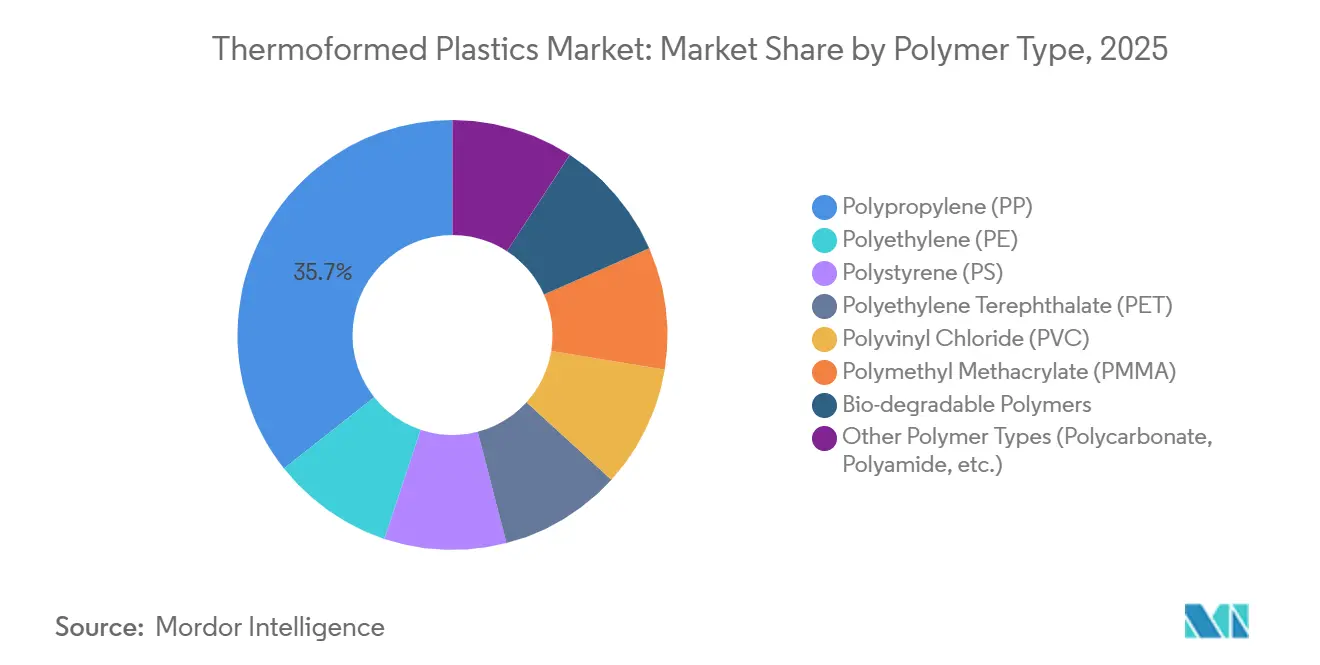
- By polymer type, polypropylene held 35.67% of the thermoformed plastics market share in 2025, while bio-degradable resins are forecast to accelerate at a 6.82% CAGR through 2031.
- By thermoforming process, vacuum forming led with 42.29% revenue share in 2025, whereas plug-assist forming is projected to post a 6.17% CAGR to 2031.
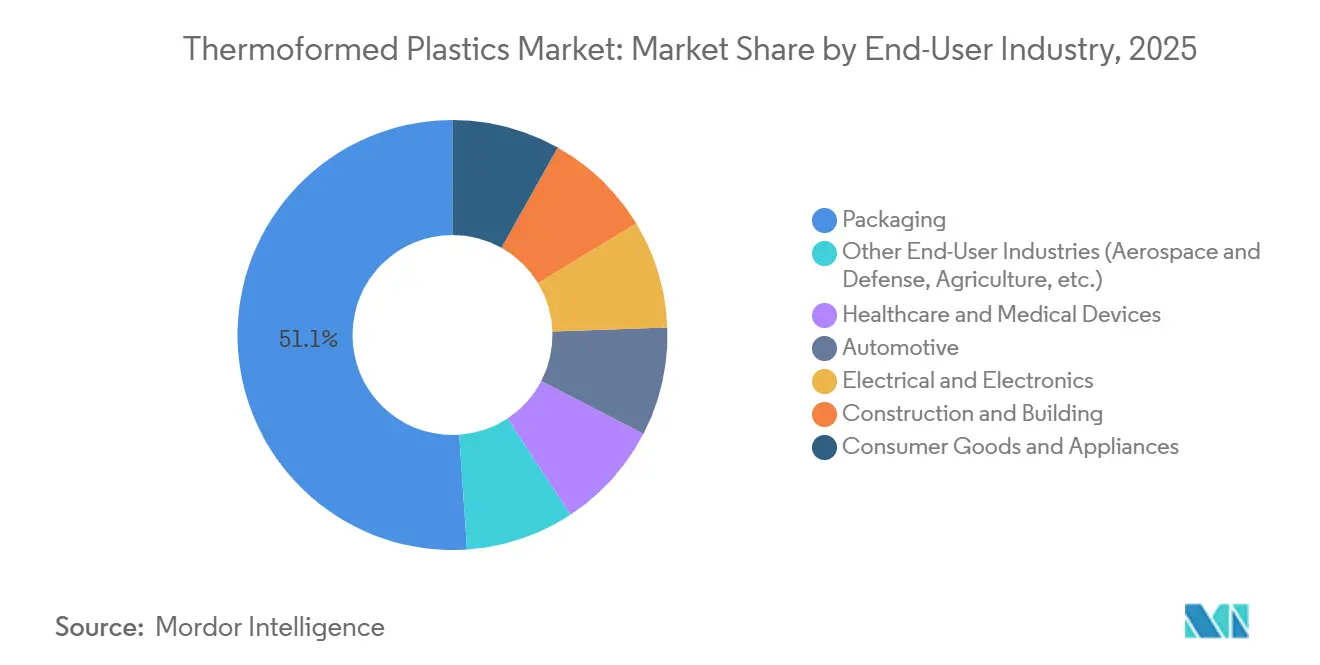
- By end-user industry, packaging accounted for 51.08% share of the thermoformed plastics market size in 2025, yet healthcare is expected to register the fastest 6.25% CAGR through 2031.
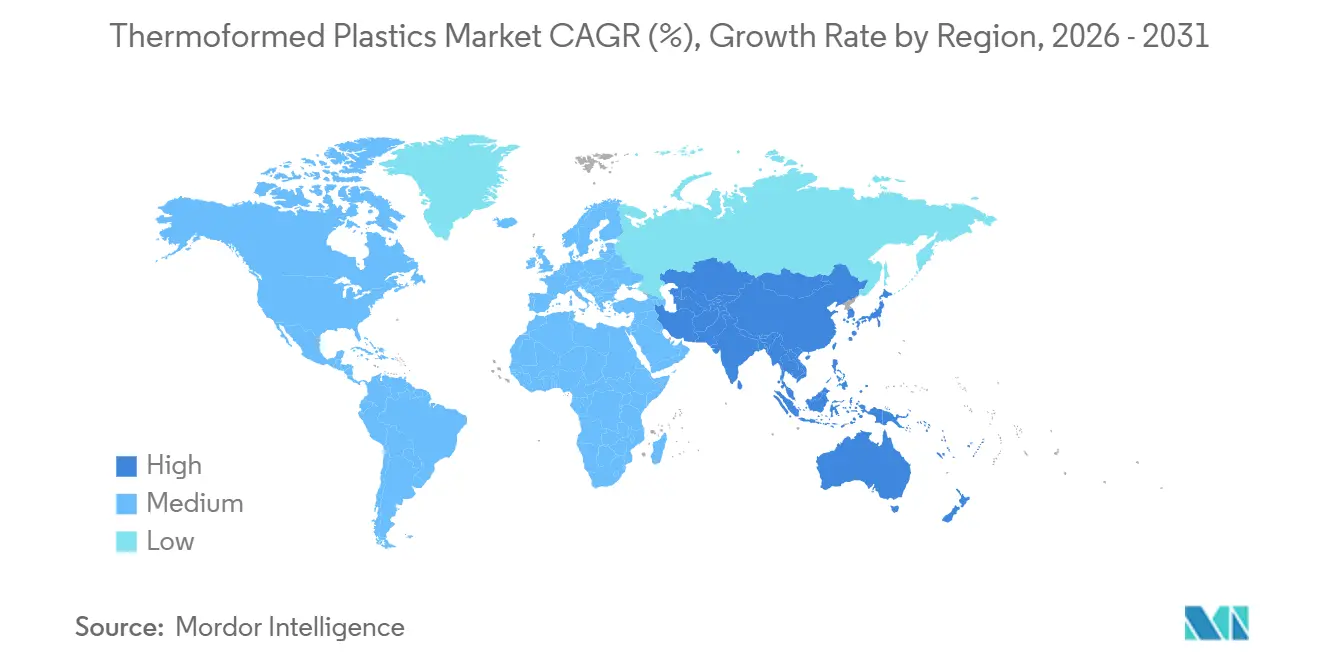
- By geography, Asia-Pacific held 39.96% share of the thermoformed plastics market size in 2025, and is anticipated to grow with the fastest CAGR of 5.94% through 2031.
Note: Market size and forecast figures in this report are generated using Mordor Intelligence’s proprietary estimation framework, updated with the latest available data and insights as of January 2026.
Market Trends and Insights
Drivers Impact Analysis of Thermoformed Plastics Market*
| Drivers | (~) % Impact on CAGR Forecast | Geographic Relevance | Impact Timeline |
|---|---|---|---|
| Lightweight sustainable food & beverage packaging | +1.2% | North America and EU markets | Medium term (2-4 years) |
| Rising use of disposable medical devices | +1.4% | North America, Europe, Japan, South Korea | Long term (≥4 years) |
| Cost-efficient mass production for auto interiors | +0.9% | Europe, North America, Chinese automotive hubs | Medium term (2-4 years) |
| Impact-resistant inserts for rapid e-commerce | +1.1% | North America, China, India, Brazil | Short term (≤2 years) |
| Automated poultry-farming feed-tray systems | +0.5% | China, Thailand, Vietnam, Brazil, United States | Long term (≥4 years) |
| Source: Mordor Intelligence | |||
Surging Demand for Lightweight Sustainable Food and Beverage Packaging
California’s SB 54 requires 65% recyclability for single-use plastic packaging by 2032, prompting global quick-service restaurants to replace polystyrene with recycled-PET clamshells. Amcor disclosed that recycled-content PET thermoformed containers now contribute 22% of its rigid-packaging portfolio, up from 14% in fiscal 2023. The European PPWR, effective May 2024, mandates 30% recycled content for PET and 10% for other formats by 2030. Huhtamaki responded by commissioning a EUR 50 million recycled-PET washing line in Poland with 40,000 tonnes annual capacity in January 2025[1]. Thin-gauge thermoforming reduces film thickness from 600 microns to 450 microns, trimming 25% resin per tray while maintaining drop-test integrity required for e-grocery chains that reported 8% of parcels experiencing impacts above 3 G in 2025.
Growing Consumption of Disposable Medical and Pharmaceutical Devices
The U.S. Centers for Disease Control highlighted high-level disinfection failures in 2024, steering ambulatory surgery centers toward sterile single-use trays[2]. Sealed Air’s 2024 10-K showed 11% revenue growth in medical-device packaging, led by insulin-pen blisters complying with ISO 11607. The U.S. FDA cleared 38 new Class II devices with thermoformed housings in 2025. India’s Production-Linked Incentive program earmarked INR 34 billion (USD 408 million) for domestic medical-device makers in fiscal 2025. New carbon-loaded polypropylene trays now achieve surface resistivity below 10¹¹ ohms-per-square, preventing electrostatic failures during cardiac-device assembly.
Cost-Efficient Mass-Production for Automotive Interior Components
EU carbon-emission norms cap fleet averages at 93.6 grams CO₂ per kilometer in 2025, encouraging original equipment manufacturers to substitute steel trunk liners with thermoformed glass-fiber-reinforced polypropylene, trimming weight by 40%. Stellantis reported that 14% of interior parts in its Peugeot 3008 now use thermoformed polypropylene, up from 8% in the prior model. Plug-assist forming reduces tooling lead time to 8 weeks versus 18 weeks for injection molds, aiding faster platform launches. China’s New Energy Vehicle mandate, which targets 40% electrified sales by 2030, boosts demand for UL 94 V-0 thermoformed battery covers. In-mold decorated panels eliminate secondary painting and cut volatile organic compound emissions by 90%.
Rapid E-Commerce Growth Driving Impact-Resistant Shipment Inserts
North American parcel volumes climbed 18% year-on-year to 9.2 billion in 2025, expanding demand for HDPE protective inserts that lower electronics damage rates from 4.3% to 1.1%. Thermoformed pulp-fiber inserts launched by DS Smith in March 2025 satisfy the UK’s full-cost Extended Producer Responsibility framework. Flipkart and Amazon India adopted polypropylene mailer inserts that reduced packaging weight by 35%, saving INR 4.20 (USD 0.05) per shipment in 2025. Cold-chain biologics shipment panels made of vacuum-insulated polyurethane now maintain 2 °C to 8 °C for 96 hours, enabling direct-to-patient delivery without dry ice.
Restraints Impact Analysis of Thermoformed Plastics Market*
| Restraints | (~) % Impact on CAGR Forecast | Geographic Relevance | Impact Timeline |
|---|---|---|---|
| Single-use-plastic bans and taxes | -0.8% | EU, UK, California, Canada | Short term (≤2 years) |
| Crude-linked feedstock price volatility | -0.6% | Europe and North America | Short term (≤2 years) |
| PFAS / micro-plastic contamination directives | -0.4% | Denmark, Netherlands, United States | Medium term (2-4 years) |
| Source: Mordor Intelligence | |||
Stringent Worldwide Single-Use-Plastic Regulations and Bans
The EU Single-Use Plastics Directive, fully enforced since July 2024, bars oxo-degradable resins and restricts polystyrene foodware, forcing restaurants to convert to polypropylene or PLA alternatives that cost 18% more. Canada’s Prohibition Regulations, effective December 2024, removed 42,000 tonnes of annual thermoformed polystyrene demand. California’s SB 54 sets a USD 500 million annual producer fee from 2027, penalizing multilayer trays that contaminate recycling streams. The UK Plastic Packaging Tax of GBP 210.82 per tonne on items with under 30% recycled content, in force since April 2025, eroded converters’ margins by 14%. India’s 2024 Plastic Waste Management rules ban thin plates and bowls below 50 microns, switching demand toward 120-micron PLA that composts within 180 days.
Volatility of Crude-Linked Polymer Feed-Stock Prices
Brent crude averaged USD 82 per barrel in 1H 2025, lifting European polypropylene contracts by 14% quarter-on-quarter to EUR 1,420 per ton. PET resin prices in North America whipsawed between USD 1,180 and USD 1,540 per tonne during 2024 as Gulf Coast force majeures disrupted supply. China’s domestic propylene additions cut import dependence by 8% in 2024, yet spot prices still swung 12% month-to-month due to coal-to-olefin outages. Sealed Air revealed raw-material inflation shaved USD 47 million off adjusted EBITDA by Q3 2024, prompting new quarterly pass-through clauses. Bio-based PLA continues to price at a 35% premium to virgin polypropylene, curbing substitution in cost-sensitive cutlery applications.
*Our forecasts treat driver/restraint impacts as directional, not additive. The impact forecasts reflect baseline growth, mix effects, and variable interactions.
Thermoformed Plastics Market Segment Analysis
By Polymer Type:
Bio-Degradable Resins Gain Despite Cost PenaltyPolypropylene retained a 35.67% share of the thermoformed plastics market in 2025 thanks to its low 0.90 g/cm³ density and 1,600 MPa flexural modulus that enable lightweight yet stiff food clamshells and automotive liners. Bio-degradable polymers such as polylactic acid and polyhydroxyalkanoates are forecast to grow at a 6.82% CAGR to 2031, outpacing the broader thermoformed plastics market because EU PPWR and California SB 54 favor compostable packaging for take-away applications. Recycled-content polyethylene terephthalate (rPET) is also expanding as Amcor lifted rPET containers to 22% of rigid-packaging sales in fiscal 2025. Polystyrene demand is eroding following the EU Single-Use Plastics Directive ban on expanded formats in July 2024. Polymethyl methacrylate and polycarbonate hold niche roles in 5G radome housings and electric-vehicle battery covers, where UV stability and UL 94 V-0 ratings outweigh higher material cost.
PET trays for fresh produce now incorporate 25% post-consumer resin on average, a figure expected to hit 40% by 2030 as bottle-to-tray recycling becomes mainstream across Germany, France, and the United Kingdom. Polyvinyl chloride remains concentrated in blister packs complying with ISO 15378; however, pharmaceutical brand owners are piloting PET-G alternatives to sidestep chlorine-content disposal hurdles. Polyamide and glass-fiber-reinforced polypropylene appear in structural thermoformed parts for battery-electric vehicles where metal substitution reduces weight by up to 45% and improves corrosion resistance over 10-year duty cycles.

By Thermoforming Process:
Plug-Assist Gains on Tight TolerancesVacuum forming contributed 42.29% of the thermoformed plastics market share in 2025 because its USD 8,000–15,000 mold investments suit high-volume clamshells and produce trays. Plug-assist forming, however, is expected to register the quickest 6.17% CAGR through 2031 as automakers and medical-device manufacturers demand ±0.15 mm tolerances for complex geometries. Plug-assist reduces corner thinning from 35% to 12% by mechanically stretching the sheet before vacuum application, enabling draw ratios exceeding 3:1 for deep medical trays. Thin-gauge thermoforming (≤1.5 mm) commands 68% unit volume because lightweight single-use foodware prioritizes material cost. Thick-gauge methods occupy automotive and industrial niches where impact requirements exceed 30 kJ/m².
Pressure forming applies up to 100 psi compressed air, achieving sub-0.05 mm surface detail resolution suited for instrument-panel fascias that integrate functional buttons without assembly labor. Hybrid infrared-heated rotary systems now deliver 18-second cycle times, boosting overall equipment effectiveness to 87% in North American food-tray facilities. Converters are coupling inline trim-and-stack robots to slash scrap rates below 2%. Digital twins model sheet sag profiles to optimize oven zoning, saving 6% energy per cycle while meeting corporate carbon-reduction targets.
By End-User Industry:
Healthcare Outpaces Packaging GrowthPackaging dominated demand with a 51.08% share in 2025, buoyed by e-commerce parcel growth and quick-service restaurant sustainability pledges. Yet, healthcare applications are poised for a 6.25% CAGR to 2031 as single-use sterile trays displace stainless-steel counterparts across ambulatory surgery centers, aligning with updated CDC disinfection guidance. Automotive interiors will extend the adoption of glass-fiber-reinforced polypropylene door panels to satisfy the 2025 EU emissions caps, while electric-vehicle battery covers create fresh volumes for flame-retardant polycarbonate.
Electrical and electronics applications gain from Asia-Pacific semiconductor investments that require electrostatic-discharge trays rated below 10¹¹ ohms-per-square. Construction uses—ABS skylights and insulated wall panels—benefit from retrofit energy-efficiency mandates in Europe, though volumes remain modest. Aerospace and defense remain niche but profitable, demanding polycarbonate radomes tested per MIL-STD-810 for −55 °C to +85 °C cycling. Agricultural seedling trays continue expanding in China, which planted over 128 million hectares in 2024, leveraging thin-gauge polypropylene that withstands 500 wash cycles.
Geography Analysis
APAC Thermoformed Plastics Market
Asia-Pacific controlled 39.96% of the thermoformed plastics market in 2025 and will post the fastest 5.94% CAGR through 2031. Growth stems from China’s 12 GW solar-module additions that require polypropylene junction-box housings and India’s INR 34 billion (USD 408 million) Production-Linked Incentive, fueling medical-device trays. Japan’s auto exports of 3.2 million units in 2024 demanded lightweight interior panels to meet 25.4 km/L fuel norms. South Korea’s DRAM dominance drives electrostatic-discharge trays in semiconductor fabs, while Thailand and Indonesia collectively added 180,000 tonnes of food-packaging capacity to serve 4,200 new quick-service restaurants.
North America Thermoformed Plastics Market
North America captured a significant revenue share in 2025, with e-commerce parcels topping 9.2 billion and sparking demand for protective inserts. The United States represented over half of regional consumption, aided by FDA clearance of 38 Class II devices using thermoformed housings in 2025. Canada’s ban on foamed polystyrene cutlery redirected converters toward polypropylene and PLA alternatives. Mexico’s 3.1 million vehicle assemblies leveraged domestic door-panel suppliers under USMCA local-content rules exceeding 75%.
Europe Thermoformed Plastics Market
The thermoformed plastics consumption in Europe is governed by stringent regulations. The PPWR enforces 10–30% recycled-content thresholds by 2030, encouraging Huhtamaki’s EUR 50 million Polish recycling line. Germany’s 3.6 million passenger-car output increasingly favors thermoformed glass-fiber trunk liners that save 1.2 grams CO₂ per km over vehicle lifecycles. The UK’s GBP 210.82 per-ton tax on low-recycled-content plastics shaved 14% off converter margins. Russia expanded domestic PET capacity by 65,000 tonnes during 2024 to replace imports constrained by sanctions.
South America and Middle East Thermoformed Plastics Market
South America and the Middle East are witnessing rapidly growing demand for thermoformed plastics. Brazil’s 14.8 million-ton poultry sector relies on RFID-enabled feed trays to meet export bio-security audits. Argentina’s recycled-content packaging supports beef and wine exports to the EU. Saudi Arabia’s Vision 2030 funnels SAR 12 billion (USD 3.2 billion) into a 120,000-tonne polypropylene thermoforming facility due online in 2026. The UAE’s tourism-driven food-service market still imports 82% of clamshells, signaling room for domestic capacity.
Regulatory Landscape
Regulation is increasingly centered on packaging circularity, recycled-content verification, and chemical safety for food-contact applications, which affects thermoformed trays, clamshells, blisters, and overwrap structures. In the European Union, the Packaging and Packaging Waste Regulation, Regulation (EU) 2025/40, entered into force on 11 February 2025 and becomes generally applicable on 12 August 2026, replacing Directive 94/62/EC and tightening market-access requirements through design-for-recycling expectations, documentation, and substance limits relevant to thermoformed formats.
Food-contact compliance is also tightening through updated recycled-plastics rules and post-market chemical scrutiny. Commission Regulation (EU) 2025/351 amends key EU food-contact frameworks for recycled plastic materials, with a transition pathway allowing plastic materials first placed on the market before 16 September 2026 to remain compliant until stocks are exhausted. In the United States, the FDA finalized a systematic post-market assessment process for chemicals in food in May 2026, expanding attention to legacy additives used in food-contact substances and increasing the need for robust compliance dossiers across resin, additive, and converter supply chains.
Value Chain Analysis
The thermoformed plastics value chain begins with upstream feedstocks (PP, PET, PS, PVC, PE, and bio-based resins) sourced from petrochemical and biopolymer producers, followed by sheet and film extrusion, thermoforming conversion (vacuum, pressure, plug-assist, thin- and thick-gauge), and downstream finishing such as trimming, stacking, printing, or in-mold decoration and assembly for end users in packaging, healthcare, automotive, and electronics. A circular sub-chain is increasingly important, moving from municipal and commercial recovery facilities supplying bottle bales to recyclers producing food-grade flakes and pellets, and then to converters integrating recycled content into thermoformed products. This integration supports brand-owner recycled-content commitments and rising documentation requirements for packaging placed on the market.
Operational performance and quality assurance shape conversion economics, with heating and trimming as common production bottlenecks, alongside extruder jams and mechanical issues such as chain rail faults. As SKU proliferation increases changeovers and process variability, converters are adding more instrumentation and monitoring to reduce scrap and downtime; data from real-time monitoring in packaging operations indicates controllable issues such as jams and minor sensor faults account for 31.7% of downtime. Standards and safety requirements also influence equipment selection and plant practices, with the Plastics Industry Association (PLASTICS) maintaining ANSI-accredited machinery safety standards (including ANSI/PLASTICS B151 series) that affect procurement, training, and compliance across thermoforming lines.
Competitive Landscape
The thermoformed plastics market remains moderately fragmented. Major leading players in the market are engaged in capacity expansion and supply agreements with larger end-user industries. Smaller converters compete on process agility. Plug-assist forming with inline trim-and-stack robotics lets mid-tier firms deliver ±0.15 mm tolerances at cycle times under 20 seconds, appealing to cardiac-device original equipment manufacturers requiring ISO 11607 compliance. In-mold decoration eliminated secondary painting on Peugeot 3008 panels, reducing volatile organic compound emissions by 90% and saving USD 1.20 per part. Process automation, digital-twin oven control, and recycled-resin dosing systems now differentiate bids, enabling 2% scrap rates versus 6% three years ago.
Thermoformed Plastics Industry Leaders
-
Sealed Air
-
Amcor plc
-
Pactiv Evergreen Inc.
-
Huhtamaki Oyj
-
TOPPAN Packaging Americas Holdings, Inc.
- *Disclaimer: Major Players sorted in no particular order
Thermoformed Plastics Market Companies Covered in this Report
- Amcor plc
- Anchor Packaging LLC
- Brentwood Industries, Inc.
- D&W Fine Pack LLC
- Dart Container Corporation
- Display Pack
- Dongguan Ditai Plastic Products Co., Ltd.
- DS Smith plc
- Genpak, LLC
- Greiner Packaging
- Huhtamaki Oyj
- Pactiv Evergreen Inc.
- Peninsula Packaging
- Placon
- Sabert Corporation
- Sealed Air
- Silgan Holdings Inc.
- SPENCER INDUSTRIES INCORPORATED
- TOPPAN Packaging Americas Holdings, Inc.
- TriEnda Holdings, LLC
- Visipak
- Winpak Ltd.
Market Opportunities and Future Outlook
Compliance-driven material redesign and circular feedstock integration are creating whitespace in recycle-ready mono-material structures, more traceable recycled-content supply, and food-contact-compliant rPET and PP thermoforms. In Europe, Regulation (EU) 2025/40 applies from 12 August 2026, and early-2026 work on Design for Recycling standards by CEN supports standardized recyclability assessments and documentation for thermoformed formats. Industry reporting highlights a gap between collection improvements and recycled-content incorporation in new thermoforms, with PET thermoform recovery at 264 million pounds in 2024 and post-consumer rPET content in new thermoforms dropping from 18% to 12%, pointing to demand for improved sorting, higher-quality reclaim streams, and tighter converter-recycler partnerships.
Product and process innovation is also opening incremental demand pockets where thermoforming supports weight, cycle-time, and design advantages, including heavy-gauge parts for EV-related protective packaging and battery-area components, alongside downgauged packaging that reduces resin use under cost pressure. On materials, bio-based and compostable options are moving closer to direct substitution in select use cases; in July 2026, TotalEnergies Corbion commercialized Luminy Foam 50F, a high-melt strength PLA positioned as a drop-in alternative to XPS foam for food packaging, which can support thermoformed structures designed around compostability requirements. On manufacturing efficiency, new servo-driven forming systems introduced in 2026 that report 15-25% film consumption reduction provide a concrete pathway for converters to protect margins and meet lightweighting targets while maintaining the thickness uniformity required in medical and premium food applications.
Recent Industry Developments in Thermoformed Plastics Market
- February 2026: TOPPAN announced a partnership with PureCycle Technologies to deliver packaging solutions using recycled content, including thermoformed applications. The collaboration links access to recycled resin with packaging converting capabilities, supporting brand-owner recycled-content commitments and helping converters secure more consistent reclaimed feedstock quality.
- June 2025: Amcor partnered with Cofigeo to develop a mono-material polypropylene thermoformed three-compartment ready meal tray designed for convenience and improved recyclability. The partnership reinforces the shift toward mono-material thermoforms that align with design-for-recycling requirements while maintaining performance in microwaveable and prepared-food applications.
- January 2024: Amcor announced an expansion of thermoforming capacity at its Oshkosh, Wisconsin site, adding state-of-the-art equipment in a Class 7 cleanroom. This strengthens North American supply for regulated healthcare and medical packaging applications where cleanroom manufacturing and validated processes are required.
Thermoformed Plastics Market Report Scope and Research Methodology
Market Definition and Coverage
For this methodology, the thermoformed plastic market is defined as the revenue generated from plastic sheets and films that are heated, formed into a shape (using thermoforming processes), and supplied as finished parts or packaging for end-use customers across industries.
Scope exclusions: We exclude injection molded, blow molded, and rotomolded plastic products that are not formed from sheet-based thermoforming.
Segments Covered in This Report
- By Polymer Type
- Polypropylene (PP)
- Polyethylene (PE)
- Polystyrene (PS)
- Polyethylene Terephthalate (PET)
- Polyvinyl Chloride (PVC)
- Polymethyl Methacrylate (PMMA)
- Bio-degradable Polymers
- Other Polymer Types (Polycarbonate, Polyamide, etc.)
- By Thermoforming Process
- Vacuum Forming
- Plug Assist Forming
- Thin Gauge Thermoforming
- Thick Gauge Thermoforming
- By End-User Industry
- Packaging
- Healthcare and Medical Devices
- Automotive
- Electrical and Electronics
- Construction and Building
- Consumer Goods and Appliances
- Other End-User Industries (Aerospace and Defense, Agriculture, etc.)
- By Geography
- Asia-Pacific
- China
- India
- Japan
- South Korea
- ASEAN Countries
- Rest of Asia-Pacific
- North America
- United States
- Canada
- Mexico
- Europe
- Germany
- United Kingdom
- Italy
- France
- Russia
- Rest of Europe
- South America
- Brazil
- Argentina
- Rest of South America
- Middle East
- Saudi Arabia
- United Arab Emirates (UAE)
- South Africa
- Egypt
- Rest of Middle-East and Africa
- Asia-Pacific
Data Sources, Market Sizing, and Validation
Desk Research
Desk research was used to set the market boundary, build initial demand indicators, and cross-check directional trends by resin and end-use pull. We relied on publicly available sources such as the US Census Bureau manufacturing data, US International Trade Commission trade statistics, Eurostat manufacturing and trade tables, UN Comtrade import-export data, and PlasticsEurope publications for plastics production and recycling context.
We also reviewed company annual reports, investor presentations, earnings call transcripts, and press coverage to understand capacity additions, plant utilization commentary, and end-market exposure, especially in packaging and automotive. Where it helped quantify gaps, we used paid subscriptions for company financials and intelligence, an import-export shipment-level database for trade pattern checks, and patent databases to track activity around recyclable mono-material structures and barrier performance. These examples are not exhaustive, and many other sources were also referenced for data collection, validation, and research clarification.
Primary Interviews and Surveys
Primary work focused on validating what drives revenue in this market, including sheet-to-part conversion economics, typical selling-price movement, and the share of thermoforming within broader plastic converting. We spoke with executives, product managers, and operations leaders across resin suppliers, sheet extruders, thermoformers, and downstream buyers in packaging, healthcare, and automotive. Coverage was balanced across major regions so assumptions did not over-index on a single geography.
Distribution of primary research fieldwork respondents
| Company type | Respondent position | Region |
|---|---|---|
| Top tier: 28% | CXOs: 12% | APAC: 46% |
| Mid tier: 54% | Functional/Unit leaders: 34% | EMEA: 35% |
| Smaller Players: 18% | Managers: 54% | Americas: 19% |
Market-Sizing & Forecasting
Market sizing starts with a top-down build where production, converting activity, and trade signals are reconstructed into an addressable thermoformed plastic revenue pool, and then filtered by the portion realistically used for thermoforming outcomes. Once that frame is set, we corroborate results with selective bottom-up approximations such as sampled supplier roll-ups, channel checks, and volume by end use multiplied by observed average selling prices, which are then used to adjust outliers.
Key inputs used in the model include resin mix shifts across PP, PET, PS, PVC, and other polymers, changes in packaging demand (food, medical, and consumer), thin-gauge versus thick-gauge processing mix, and the pace of lightweighting and recycled-content adoption that can influence material substitution and pricing. For forecasting, scenario analysis is applied so short-term packaging swings and longer-cycle automotive and construction demand can be handled separately, then brought back into one consolidated outlook. Where bottom-up visibility is weaker in smaller countries, gaps are handled through proxy indicators such as per-capita packaging consumption, import dependency, and regional capacity presence, followed by expert validation.
Data Validation & Update Cycle
Model outputs are checked against independent signals such as trade balances for key polymers, announced capacity expansions, and reported end-use demand changes, before numbers are finalized. If a region shows a sharp jump that is not supported by demand indicators, the assumptions are revisited and primary contacts are re-engaged to confirm whether it is a timing issue, a price effect, or a scope mismatch.
Reviews happen in multiple steps, including peer checks on conversion logic and a variance scan versus historical patterns. Reports are refreshed annually, and interim updates are made when material events occur, such as major regulatory actions affecting packaging formats or notable capacity changes. Before delivery, a final analyst pass is completed so the client receives the latest updated view.
Mordor Intelligence's Thermoformed Plastic Market Size Versus Other Published Estimates
Published market values for thermoformed plastic often differ because the counted scope can shift between finished thermoformed products, broader thermoforming activity, or even the larger plastics converting space. Differences also come from whether pricing is treated as resin-linked or as a more stable conversion margin, and from how frequently the model is refreshed when packaging demand changes.
By tracking resin mix, process split, and end-use demand checks, Mordor Intelligence keeps the total tied to thermoformed plastics revenue only, instead of mixing in adjacent molded products or generalized plastics conversion value. Some estimates also rely on one reference year or a single long-range CAGR, which can miss near-term price cycles and the impact of recycled-content and design-for-recycling shifts on realized selling prices.
Benchmark comparison
| Source | Market Size | Gaps in Research Methodology |
|---|---|---|
| Mordor Intelligence | USD 15.94 B (2025) | |
| Industry Publisher A | USD 16.15 B (2024) | Uses a different base year and a broad segment frame (by product, process, and application) that may include neighboring thermoforming-related items, while price progression is not clearly tied to resin-linked movements. |
| Trade Release B | USD 15.16 B (2025) | Narrative focuses heavily on packaging-led demand and can undercount non-packaging end uses, and the long horizon to 2035 may smooth near-term cycles that affect revenue in the forecast start years. |
The comparison shows that the spread is mainly explained by boundary choices, base-year timing, and how pricing and end-use coverage are handled. Our approach stays traceable to clear inputs like resin mix, process mix, and end-market pull, which helps keep the estimate repeatable when assumptions are updated.
Key Questions Answered in the Report
What is the current size of the thermoformed plastics market and how fast will it grow?
The market generated USD 16.84 billion in 2026 and is projected to reach USD 22.13 billion by 2031, reflecting a 5.62% CAGR over the forecast period.
Which polymer currently dominates demand in thermoformed plastics?
Polypropylene led in 2025 with a 35.67% share thanks to its low density, stiffness, and suitability for food clamshells and automotive liners.
How are new packaging regulations influencing thermoformed plastics adoption?
The EU PPWR and California’s SB 54 impose recycled-content and recyclability targets, prompting brand owners to shift toward recycled-PET and compostable trays, thereby supporting steady demand even when resin prices fluctuate.
Why is healthcare the fastest growing end-user segment?
Ambulatory surgery centers are switching from reusable metal to sterile single-use thermoformed trays in line with updated CDC disinfection guidance, driving a 6.25% CAGR for healthcare applications through 2031.
What advantages do thermoformed plastics offer to automakers?
Glass-fiber-reinforced polypropylene trunk liners and battery covers cut part weight by up to 40%, aiding compliance with 2025 EU fleet-average CO₂ limits while reducing tooling lead times versus injection molding.