Market Overview
| Study Period | 2020 - 2031 |
|---|---|
| Forecast Data Period | 2026 - 2031 |
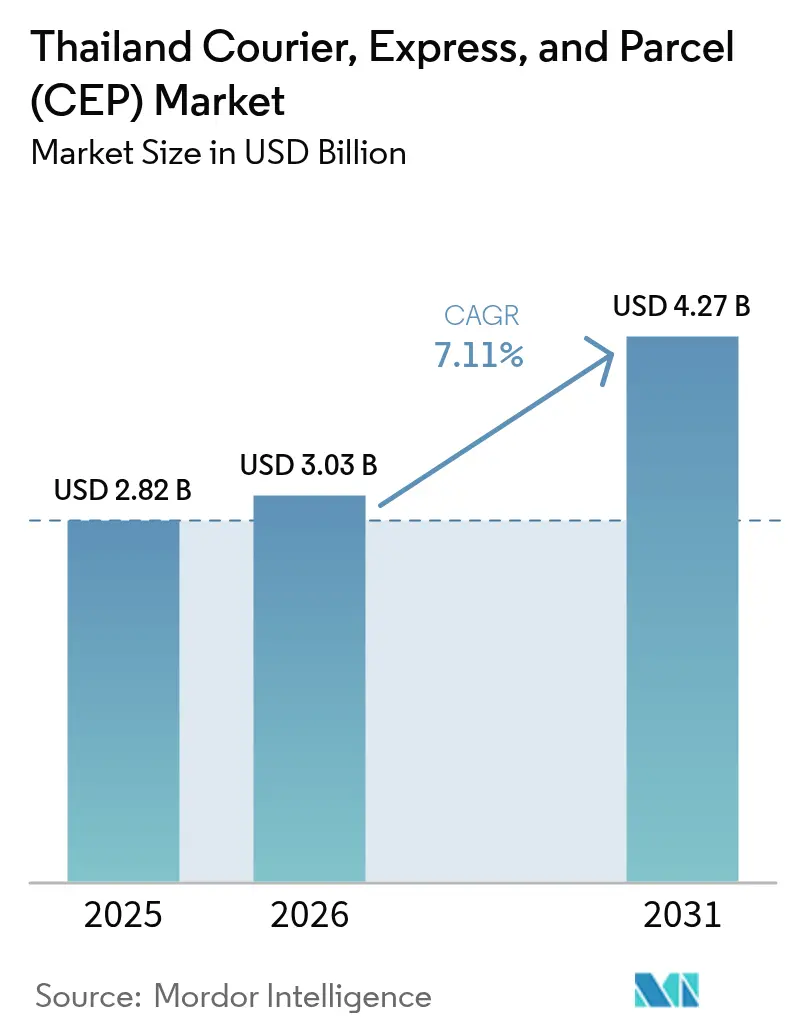
| Base Year Market Size (2025) | USD 2.82 Billion |
| Market Size (2026) | USD 3.03 Billion |
| Market Size (2031) | USD 4.27 Billion |
| Growth Rate (2026 - 2031) | 7.11% CAGR |
| Market Concentration | Medium |
Major Players *Disclaimer: Major Players sorted in no particular order Image © Mordor Intelligence. Reuse requires attribution under CC BY 4.0. | |
Thailand Courier, Express, And Parcel (CEP) Market Analysis by Mordor Intelligence
The Thailand courier, express, and parcel (CEP) market size is projected to be USD 2.82 billion in 2025 and USD 3.03 billion in 2026, and reach USD 4.27 billion by 2031, growing at a CAGR of 7.11% from 2026 to 2031.
Strong social-commerce adoption, government investment in artificial-intelligence infrastructure, and bonded e-commerce zones inside the Eastern Economic Corridor converge to reshape shipment flows, spur automation investment, and expand cross-border opportunities. Live-streaming commerce on TikTok Shop and Shopee Live fragments order baskets into high-frequency micro-shipments that strain hub-and-spoke networks while rewarding operators deploying modular sortation and real-time inventory visibility. Express operators exploit Thailand’s 70,000-kilometer highway network, but high-speed rail and expanded air-cargo capacity deepen multimodal options that shorten transit times for international sellers. Nationwide 5G rollout, cloud adoption, and the Ministry of Digital Economy and Society’s AI strategy nurture data-driven route optimization that trims last-mile costs by 15-20% in dense corridors. Meanwhile, gig-economy labor rules, free-shipping subsidies, and limited rural cold-chain coverage temper operating margins and service reach.
Key Report Takeaways
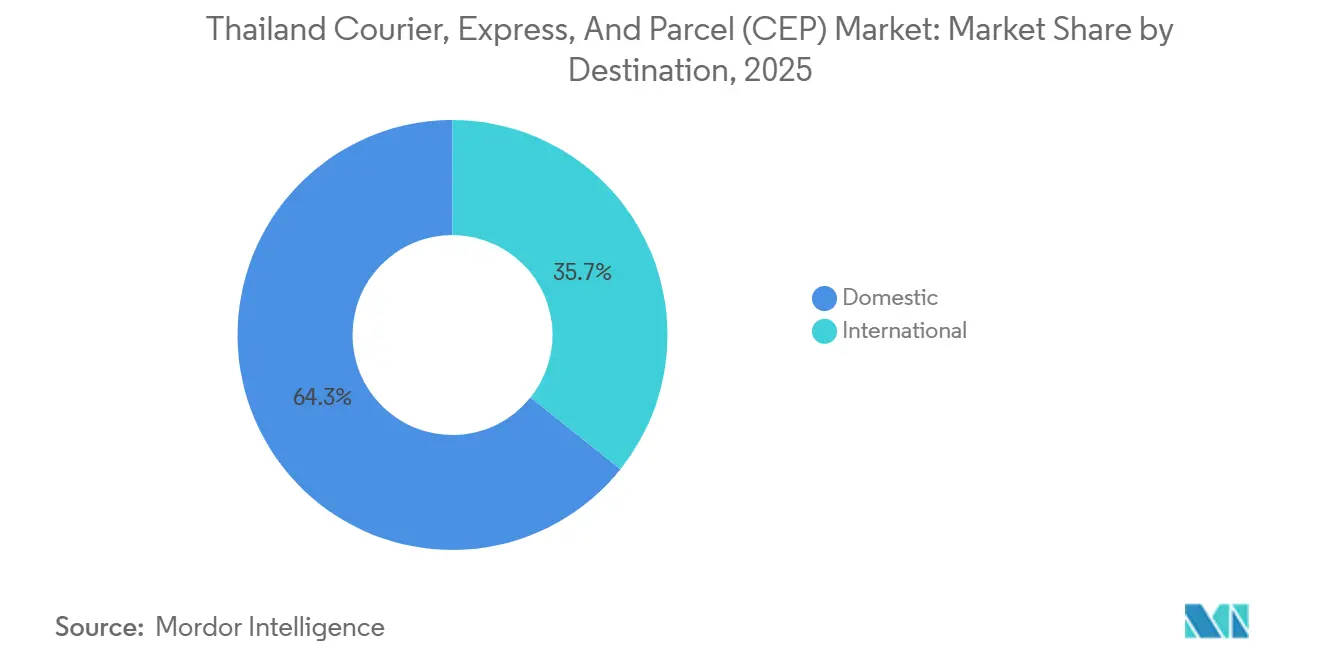
- By destination, domestic services held 64.26% of the Thailand courier express parcel (CEP) market share in 2025, whereas international parcels are projected to expand at a 7.72% CAGR through 2031.
- By speed of delivery, non-express shipments held 76.49% of the Thailand courier express parcel (CEP) market share in 2025, whereas express services are advancing at an 8.07% CAGR through 2031.
- By business model, B2C flows commanded 61.14% share of the Thailand courier express parcel (CEP) market size in 2025, but C2C transactions are projected to expand at an 8.39% CAGR between 2026 and 2031.
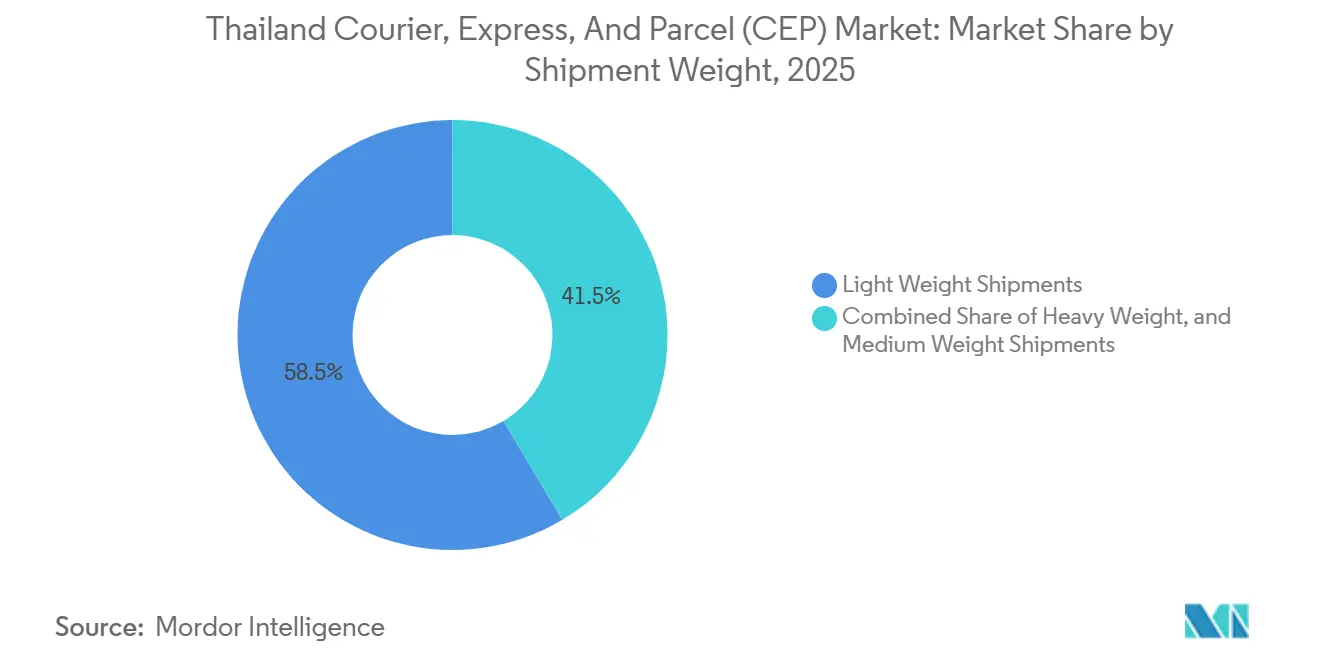
- By shipment weight, light parcels commanded a 58.53% market share in the Thailand courier, express, and parcel (CEP) market in 2025, whereas heavy-weight parcels are projected to grow at a 7.53% CAGR between 2026 and 2031.
- By mode of transport, road captured 56.95% of the Thailand courier express parcel (CEP) market share in 2025, while air freight is projected to grow at a 7.82% CAGR from 2026-2031.
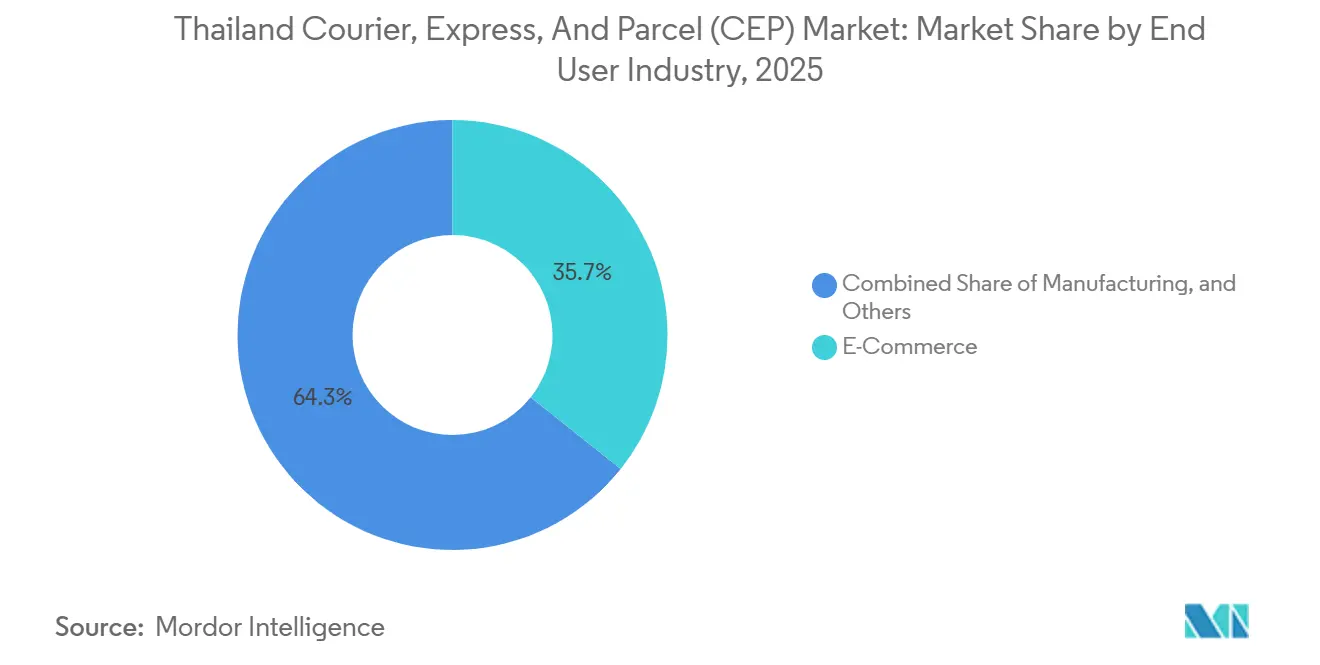
- By end-user, e-commerce led with 35.71% revenue share in 2025; healthcare is forecast to post the fastest 8.48% CAGR to 2031.
Note: Market size and forecast figures in this report are generated using Mordor Intelligence’s proprietary estimation framework, updated with the latest available data and insights as of 2026.
Thailand Courier, Express, And Parcel (CEP) Market Trends and Insights
Drivers Impact Analysis*
| Driver | (~) % Impact on CAGR Forecast | Geographic Relevance | Impact Timeline |
|---|---|---|---|
| Social-commerce live-stream boom inflating small-parcel traffic | +1.9% | Bangkok, Chiang Mai, Phuket | Short term (≤ 2 years) |
| Consumer demand for sub-two-hour delivery windows | +1.6% | Bangkok metro and provincial capitals | Medium term (2-4 years) |
| Government-sponsored bonded e-commerce zones in EEC | +1.2% | Chonburi, Rayong, Chachoengsao | Long term (≥ 4 years) |
| Nationwide rollout of smart parcel lockers and PUDO networks | +0.9% | National, urban focus | Medium term (2-4 years) |
| Cross-border parcel growth via regional marketplaces | +1.4% | Northern corridor, Bangkok | Long term (≥ 4 years) |
| Uptake of AI-powered route optimisation | +1.1% | Dense urban corridors | Medium term (2-4 years) |
| Source: Mordor Intelligence | |||


Social-Commerce Live-Stream Boom Inflating Small-Parcel Traffic
TikTok Shop integrations with influencers generate impulse purchases of only 2-3 items per order, splintering consolidated loads and lifting per-parcel handling costs by 25-30%. Shopee Live evening sessions create two-to-three-hour surges that flood sortation centers, so couriers deploy surge staffing and elastic automation to keep dwell times under 90 minutes. Thailand Post’s alliances with eBay and Amazon push micro-fulfillment nodes inside five-kilometer urban radii, exchanging long-haul trunking for dense last-mile routing. Digital-trade incentives entice SMEs onto live-stream channels yet leave couriers navigating evolving return-management and consumer-protection mandates[1]“Thailand Post warns of US tariff threat,” Bangkok Post, bangkokpost.com .
Consumer Demand for Sub-Two-Hour Delivery Windows
Affluent Bangkok households pay 50-100 baht premiums for guaranteed two-hour slots, forcing couriers to place forward inventory in neighborhood dark stores and optimize routes with real-time traffic data. Grab and Foodpanda extend quick-commerce models beyond food, capturing personal-care and pharma categories across 25 Bangkok districts. J&T Express couples HSBC fintech tools to shrink cash-on-delivery settlement cycles from seven days to 24 hours, easing merchant liquidity. National instant-payment rails process 14 billion transactions yearly and underpin real-time order confirmation, yet raise cybersecurity requirements for proof-of-delivery systems[2]“5G & IoT Success Stories,” AIS, ais.co.th .
Government-Sponsored Bonded E-Commerce Zones in the Eastern Economic Corridor
Twelve bonded facilities totaling 180,000 sqm let operators defer duties and cut customs clearance from 48 hours to under 12 hours, slashing merchants’ working-capital needs by up to 40%. WHA’s 200,000 sqm expansion adds temperature-controlled zones and direct port links, accelerating import-to-delivery cycles for time-sensitive goods. Thailand Customs’ National Single Window integrates with courier TMS, lowering compliance costs by 15-20%. Bangkok-based sellers, however, face 24-48 hour transfers to EEC facilities, diluting benefits outside the corridor.
Nationwide Roll-Out of Smart Parcel Lockers and PUDO Networks
Thailand Post’s 250 smart lockers inside BTS and MRT stations cut failed deliveries below 5% and save 30-40 baht per parcel in redelivery cost. Over 15,000 7-Eleven, FamilyMart, and Lotus’s stores provide PUDO points within 500 m for 80% of urban residents, although space and staffing constraints limit uptake to one-quarter of eligible parcels. 5G-enabled sensors reduce locker downtime to under 3% and supply heat-map data that guides new deployments. Rural provinces with sparse retail grids still rely on costlier home delivery.
Restraints Impact Analysis*
| Restraint | (~) % Impact on CAGR Forecast | Geographic Relevance | Impact Timeline |
|---|---|---|---|
| Free-shipping price wars compressing margins | -1.4% | Nationwide | Short term (≤ 2 years) |
| Legal ambiguity over gig-rider classification | -0.7% | Urban centers | Medium term (2-4 years) |
| Limited refrigerated last-mile coverage | -0.5% | Non-tier-1 cities | Medium term (2-4 years) |
| Urban depot congestion during festival spikes | -0.8% | Bangkok, major hubs | Short term (≤ 2 years) |
| Source: Mordor Intelligence | |||
Free-Shipping Price Wars Compressing Operator Margins
Shopee, Lazada, and TikTok Shop subsidize delivery at 3-5% of GMV, pushing couriers to accept 15-25 baht fees when full cost sits near 30 baht. BEST Inc.’s FY 2023 Thailand losses illustrate unsustainable economics. Thailand Post offsets e-commerce losses with postal and government contracts, posting 227% net-profit growth in Q1 2025. Couriers increasingly hawk packaging, insurance, and returns management to add 5-10 baht per shipment[3]“Laos and Thailand Agreements,” US-ASEAN Business Council, usasean.org.
Legal Ambiguity over Gig-Rider Labor Classification
Gig riders play a pivotal role, with operators designating 60-70% as contractors. Proposed amendments to the Labour Protection Act could increase labor costs by up to 30% and force fleet reductions. Rider churn remains high at 40-50% annually, driving up onboarding and training expenses while causing service disruptions during peak demand. However, the contractor model allows operators to scale capacity by 200–300% during festivals without fixed payroll liabilities. Legal uncertainties and high volatility continue to challenge the sector's operational stability.[4]“Thai-Chinese High-Speed Railway Project,” Thailand PRD, thailand.prd.go.th.
*Our forecasts treat driver/restraint impacts as directional, not additive. The impact forecasts reflect baseline growth, mix effects, and variable interactions.
Segment Analysis
By End-User Industry: Healthcare Outpaces All Segments
Healthcare parcels will register an 8.48% CAGR to 2031, driven by vaccine and pharma distribution under universal-coverage expansion. E-commerce remained at 35.71% share in 2025 but wrestles with cost pressures from free shipping. Cold-chain gaps outside tier-1 cities slow healthcare penetration; only 15-20% of provincial demand sees compliant 2-8 °C service.
Financial, manufacturing, and wholesale verticals post steady shipments tied to supply-chain diversification and the Ministry of Industry’s cluster incentives.


By Destination: International Momentum Driven by SME Exports
International parcels captured 35.74% of the Thailand courier express parcel market size in 2025 and will rise at a 7.72% CAGR as SMEs exploit bonded zones and ASEAN marketplace logistics. Deferred duty payment within EEC warehouses frees up 30-40% working capital, while Laos rail corridors shave two-week ocean transits to under one week. Domestic traffic, still 64.26% in 2025, benefits from live-streaming micro-shipments clustered around Bangkok and secondary cities.
Courier networks fine-tune international documentation via blockchain pilots under KEX-SF Express to reduce customs errors and attract exporters wary of retaliatory United States tariffs that could raise landed costs 25%. Yet geographic concentration of bonded benefits inside Chonburi-Rayong-Chachoengsao skews access for upcountry merchants.
By Speed of Delivery: Express Services Outpace Baseline Growth
Express parcels accounted for 23.51% market share in 2025 and are on track for an 8.07% CAGR, fueled by two-hour service in affluent urban districts. Non-express volumes dominate but face fee compression as platforms press for 15-25 baht rates. Quick-commerce leaders leverage electric moto fleets and micro-fulfillment nodes to sustain 45-minute grocery delivery, pressuring traditional couriers’ infrastructure budgets.
Fintech-enabled 24-hour payment settlement attracts small merchants to express tiers, while 5G telemetry halves vehicle downtime and supports narrow delivery windows. Rural express economics remain challenging where drop density is thin and average ticket sizes cannot absorb premium fees.
By Shipment Weight: Light Parcels Dominate Social-Commerce
Light parcels retained 58.53% market share in 2025, propelled by apparel, cosmetics, and personal electronics boxes under 2 kg. Automated sorters calibrated for small cartons achieve 12,000-parcel-per-hour throughput and 0.5% error rates. Medium freight serves home-appliance demand, while heavy parcels, though smaller in count, post 7.53% CAGR on industrial component flows into EEC factories.
Specialized heavy-haul fleets cost THB 10-20 million (USD 321-643 thousand) per truck, limiting competition and sustaining THB 60-80 (USD 1.84-2.45) rates. CJ Logistics’ aerospace project for the Royal Thai Air Force showcased its capacity to handle outsized freight and won further defense-logistics contracts.
By Mode of Transport: Road Leads, Air Accelerates
Road accounted for 56.95% market share in 2025 as the Thailand courier express parcel market leverages an extensive highway grid for last-mile reach. Air will expand at a 7.82% CAGR as express and cross-border sellers pay for speed. Cabinet-approved THB 520 billion (USD 16.51 billion) high-speed rail aims for a 2030 Bangkok-Kunming connection, opening a mid-range modal option faster than road yet cheaper than air.
UPS, FedEx, and DHL add intra-Asia frequencies and automate Bangkok cargo hubs, while domestic fleets electrify last-mile vans to meet looming carbon-tax compliance.
By Business Model: C2C Ecosystem Rapidly Expands
B2C held 61.14% of Thailand courier express parcel market share in 2025, yet C2C is the faster lane at 8.39% CAGR as Facebook Marketplace and Carousell make individual selling frictionless. C2C parcels need on-demand pickups and granular tracking, accelerating vertical integration by platform logistics arms. Temu’s July 2024 entry drew aggressive subsidy tactics that escalate competitive acquisition costs.
Industrial B2B demand upticks inside the EEC as automotive and electronics suppliers lean on just-in-time flows. Warehouse developers such as WHA secure long-term leases with 3PLs keen to align with bonded-zone privileges.
Geography Analysis
Bangkok produces nearly half of the national parcel volume, supported by 8,000 convenience stores doubling as PUDO sites and smart lockers that trim failed deliveries below 5%. Secondary cities, Chiang Mai, Phuket, and EEC provinces benefit from THB 1.7 trillion (USD 53.97 billion) infrastructure programs that elevate industrial activity and tourist parcel demand.
Northern gateways Chiang Rai and Nong Khai pivot to rail-enabled trade with Laos and China, enhancing SME export agility. Conversely, rural districts with sub-100-person-per-km² density require price surcharges of 50-80 baht to stay profitable. Digital-infrastructure investments widen 5G coverage and cloud adoption, giving operators the data backbone to refine rural routing.
EEC bonded zones centralize customs advantages in Chonburi-Rayong-Chachoengsao, attracting multinational 3PLs but leaving central and northern merchants reliant on longer drayage legs. High-speed rail completion by 2030 will bridge Bangkok to Nong Khai in under three hours, further redistributing parcel flows northward.
Competitive Landscape
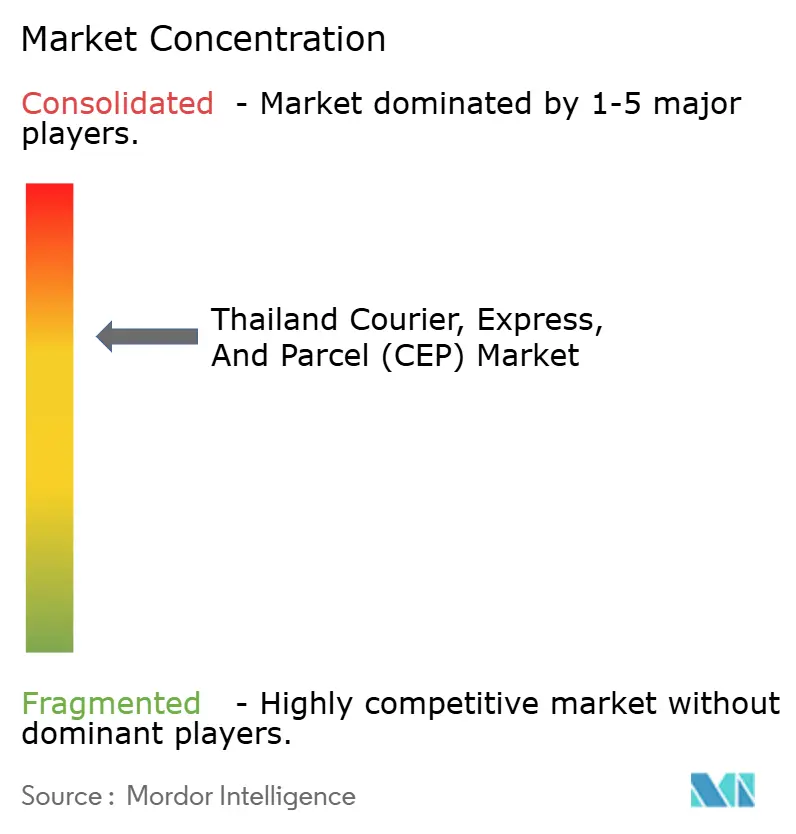
The Thailand courier express parcel market remains moderately fragmented, with the top five providers commanding a majority of the market share. However, they face competition from platform logistics arms that leverage free shipping as a strategy to build customer loyalty. KEX's collaboration with SF Express introduces blockchain documentation and AI sortation, alongside access to the China-ASEAN lane, making it particularly attractive to exporters. Meanwhile, both Flash Express and Thailand Post harness AI and automation, boosting their processing throughput by 50% and significantly reducing mis-sorts.
Potential growth areas include urban deliveries in under two hours, smart-locker networks in rural areas, and an expansion of cold-chain services in provinces. A potential reclassification of gig workers looms on the horizon, with estimates suggesting a 20-30% increase in personnel costs. This shift could favor operators that are capital-intensive and heavily automated.
As a 200-baht-per-ton carbon tax comes into play, fleet electrification is gaining momentum. This move is set to align the total cost of ownership between electric vans and their diesel counterparts by 2029.
Thailand Courier, Express, And Parcel (CEP) Industry Leaders
DHL Group
Flash Express
J&T Express
SF Express (KEX-SF)
Thailand Post
- *Disclaimer: Major Players sorted in no particular order

Recent Industry Developments
- March 2025: Thailand Post reported Q1 2025 revenue of THB 5.9 billion (USD 187.34 million), up 11.8% year over year, and expanded cross-border warehousing with eBay and Amazon.
- February 2025: Thailand and Laos signed rail accords supporting USD 11 billion bilateral-trade target and second-phase high-speed line funding.
- August 2024: KEX rebranded and welcomed SF Express as shareholder, unlocking AI sortation and blockchain documentation tech.
- July 2024: Temu launched Thailand operations with large subsidy budgets that intensified delivery-cost competition.


Thailand Courier, Express, And Parcel (CEP) Market Report Scope
By Destination
| Domestic |
| International |
By Speed of Delivery
| Express |
| Non-Express |
By Business Model
| Business-to-Business (B2B) |
| Business-to-Consumer (B2C) |
| Consumer-to-Consumer (C2C) |
By Shipment Weight
| Heavy Weight Shipments |
| Light Weight Shipments |
| Medium Weight Shipments |
By Mode of Transport
| Air |
| Road |
| Others |
By End User Industry
| E-Commerce |
| Financial Services (BFSI) |
| Healthcare |
| Manufacturing |
| Primary Industry |
| Wholesale and Retail Trade (Offline) |
| Others |
| By Destination | Domestic |
| International | |
| By Speed of Delivery | Express |
| Non-Express | |
| By Business Model | Business-to-Business (B2B) |
| Business-to-Consumer (B2C) | |
| Consumer-to-Consumer (C2C) | |
| By Shipment Weight | Heavy Weight Shipments |
| Light Weight Shipments | |
| Medium Weight Shipments | |
| By Mode of Transport | Air |
| Road | |
| Others | |
| By End User Industry | E-Commerce |
| Financial Services (BFSI) | |
| Healthcare | |
| Manufacturing | |
| Primary Industry | |
| Wholesale and Retail Trade (Offline) | |
| Others |


Market Definition
- Courier, Express, and Parcel - The Courier, Express, and Parcel services, often called as CEP Market, refers to the logistics and postal service providers which specialize in moving small goods (parcels/packages). It captures the overall market size (USD) and market volume (number of parcels) of (1) the shipments/parcels/packages which are under 70kgs/ 154lbs weight, (2) Business Customer packages viz. Business-to-Business (B2B) & Business-to-Consumer (B2C) as well as private customer packages (C2C), (3) non-express parcel delivery services (Standard and Deferred) as well as express parcel delivery services (Day-Definite-Express and Time-Definite-Express), (4) domestic as well as international shipments.
- Demographics - To analyse total addressable market demand, population growth & forecasts have been studied and presented in this industry trend. It represents population distribution across categories like gender (male/female), development area (urban/rural), major cities among other key parameters like population density and final consumption expenditure (growth and share % of GDP). This data has been used for assessing the fluctations in demand & consumption expenditure, and the major hotspots (cities) of potential demand.
- Domestic Courier Market - Domestic Courier Market refers to the CEP shipments wherein the origin and destination is within the boundary of the geography studied (country or region as per the scope of report). It captures the market size (USD) and market volume (number of parcels) of (1) the shipments/parcels/packages which are under 70kgs/ 154lbs weight, including light weight shipments, medium weight shipments and heavy weight shipments (2) Business Customer packages viz. Business-to-Business (B2B) & Business-to-Consumer (B2C) as well as private customer packages (C2C), (3) non-express parcel delivery services (Standard and Deferred) as well as express parcel delivery services (Day-Definite-Express and Time-Definite-Express).
- E-Commerce - This end user industry segment captures the external (outsourced) logistics expenditure incurred by the e-tailers, through online sales channel, on Courier, Express, and Parcel (CEP) services. The scope includes (i) the supply chain of a company's online customer orders being fulfilled, (ii) the process of getting a product from the point of manufacturing to the point at which it is delivered to consumers. It involves managing inventory (deferred as well as time critical), shipping, and distribution.
- Export Trends and Import Trends - Overall logistics performance of an economy is positively and significantly (statistically) correlated to its trade performance (exports and imports). Hence, in this industry trend, total value of trade, major commodities/ commodity groups and the major trade partners, for the studied geography (country or region as per the scope of report) have been analysed alongside the impact of major trade/logistics infrastructure investments & regulatory environment.
- Financial Services (BFSI) - This end user industry segment captures the external (outsourced) logistics expenditure incurred by the BFSI players, on Courier, Express, and Parcel (CEP) services. CEP is important to the financial services industry in shipping of confidential documents and files. The establishments in this sector are engaged in (i) financial transactions (that is, transactions involving the creation, liquidation, or change in ownership of financial assets) or in facilitating financial transactions, (ii) financial intermediation, (iii) the pooling of risk by underwriting annuities and insurance, (iv) providing specialized services that facilitate or support financial intermediation, insurance and employee benefit programs, and (v) monetary control - the monetary authorities.
- Fuel Price - Fuel price spikes can cause delays and diruption for logistics service providers (LSPs), while drops in the same can result in higher short-term profitability and increased market rivalry to offer consumers with the best deals. Hence, the fuel price variations have been studied over the review period and presented along with the causes as well as market impacts.
- GDP Distribution by Economic Activity - Nominal Gross Domestic Product and distribution of the same, across major economic sectors in the geography studied (country or region as per scope of the report) have been studied and presented in this industry trend. As GDP is positively related to the profitability and growth of logistics industry, this data has been used in adjunction to the input-output tables/ supply-use tables for analyzing the potential major contributing sectors towards the logistics demand.
- GDP Growth by Economic Activity - Growth of Nominal Gross Domestic Product across major economic sectors, for the geography studied (country or region as per scope of the report) have been presented in this industry trend. This data has been utilized for assessing the growth of logistics demand from all the market end users (economic sectors considered here).
- Healthcare - This end user industry segment captures the external (outsourced) logistics expenditure incurred by the Healthcare players (Hospitals, clinics, mrdical centres) , on Courier, Express, and Parcel (CEP) services. The scope includes CEP services involved in the defrerred as well time critical movement of medical goods & supplies (surgical supplies and instruments, including gloves, masks, syringes, equipment). The establishments in this sector (i) include the ones providing medical care exclusively (ii) deliver services by trained professionals (iii) involve processes, including labor inputs of health practitioners with the requisite expertise (iv) are defined based on the educational degree held by the practitioners included in the industry.
- Inflation - Variations in both Wholesale Price Inflation (YoY change in producer price index) and Consumer Price Inflation have been presented in this industry trend. This data has been used to assess the inflationary environment as it plays a vital role in smooth functioning of the supply chain, directly impacting the logistics operational cost components e.g., pricing of tyres, driver wages & benefits, energy/fuel prices, maintenace costs, toll charges, warehousing rents, custom brokerage, forwarding rates, courier rates etc. hence impacting the overall freight and logistics market.
- Infrastructure - As infrastructure plays a vital role in an economy's logistics performance, variables like length of roads, distribution of road length by surface category (paved v/s unpaved), distribution of road length by road classification (expressways v/s highways v/s other roads), rail length, volume of containers handled by major ports and tonnage handled by major airports have been analysed and presented in this industry trend.
- International Express Service Market - International Express Service Market refers to the CEP shipments wherein the origin or destination is not within the boundary of the geography studied (country or region as per the scope of report). It captures the market size (USD) and market volume (number of parcels) of (1) the shipments/parcels/packages which are under 70kgs/ 154lbs weight, including light weight shipments, medium weight shipments and heavy weight shipments (ii) Inter-Region as well as Intra-Region Shipments
- Key Industry Trends - The report section named "Key Industry Trends" include all the key variables/parameters studied to better analyze the market size estimates and forecasts. All the trends have been presented in the form of data points (time series or latest available data points) along with analysis of the paramter in the form of concise market relevant commentary, for the geography studied (country or region as per the scope of report).
- Key Strategic Moves - The action taken by a company to differentiate from its competitor or used as a general strategy is referred to as a key strategic move (KSM). This includes (1) Agreements (2) Expansions (3) Financial Restructuring (4) Mergers and Acquisitions (5) Partnerships, and (6) Product Innovations. Key players (Logistics Service Providers, LSPs) in the market have been shortlisted, their KSM have been studied and presented in this section.
- Logistics Performance - Logistics Performance and Logistics Costs are the backbone of trade, and influences trade costs, making countries compete globally. Logistics performance is influenced by market wide adopted supply chain management strategies, government services, investments & policies, fuel/ energy costs, inflationary environment etc. Hence, in this industry trend, the logistics performance of the geography studied (country/ region as per the scope of report) has been analysed and presented over the review period.
- Manufacturing - This end user industry segment captures the external (outsourced) logistics expenditure incurred by the Manufacturing industry (including Hi-Tech/Technology) players, on Courier, Express, and Parcel (CEP) services. The end user players considered are the establishments primarily engaged in the chemical, mechanical or physical transformation of materials or substances into new products. Logistics Service Providers (LSPs) play a crucial role in maintaining a smooth flow of raw materials across the supply chain, enabling timely delivery of finished goods to distributors or end customers and storing & supplying the raw materials to clients for just-in-time manufacturing.
- Other End Users - Other end user segment captures the external (outsourced) logistics expenditure incurred by the construction, real estate, educational services, and professional services (administrative, waste management, legal, architectural, engineering, design, consulting, scientific R&D), on Courier, Express, and Parcel (CEP) services. Logistics Service Providers (LSPs) plays a crucial role in the reliable movement of time critical supplies and documents to/from these industries such as transporting any equipment or resources required, shipping confidential documents and files.
- Primary Industry - This end user industry segment captures the external (outsourced) logistics expenditure incurred by the AFF (Agriculture, Fishing, and Forestry) and Extraction indsutry (Oil &Gas, Quarrying and Mining) players, on Courier, Express, and Parcel (CEP) services. The end user players considered are the establishments (i) primarily engaged in growing crops, raising animals, harvesting timber, harvesting fish & other animals from their natural habitats and providing related support activities; (ii) that extract naturally occurring mineral solids, such as coal and ores; liquid minerals, such as crude petroleum; and gases, such as natural gas. Herein, Logistics Service Providers (LSPs) (i) play a crucial role in acquisition, storage, handling, transportation, and distribution activities for the optimal & continuous flow of inputs (seeds, pesticides, fertilizers, equipment, and water) from manufacturers or suppliers to the producers and smooth flow of output (produce, agro-goods) to distributors/ consumers; (ii) cover entire phases from upstream to downstream and play a crucial role in the transportation of machinery, drilling equipments, extracted minerals, crude oil & natural gas and refined/ processed products from one place to another. This includes both termperature controlled and non-temperature controlled logistics, as and when required according to the shelf life of goods being transported or stored.
- Producer Price Inflation - It indicates inflation from viewpoint of the producers viz. the average selling price received for their output over a period of time. Annual change (YoY) of producer price index is reported as wholesale price inflation in the "Inflation" industry trend. As WPI captures dynamic price movements in most comprehensive way, it is widely used by governments, banks, industry, business circles and is deemed important in formulation of trade, fiscal and other economic policies. The data has been used in adjunction to consumer price inflation for better understanding the inflationary environment.
- Segmental Revenue - Segmental Revenue has been triangulated or computed and presented for all the major players in the market. It refers to the courier, express, and parcel (CEP) market specific revenue earned by the company, over the base year of study, in the geography studied (country or region as per the scope of report). It is computed through the study and analysis of major parameters like financials, service portfolio, employee strength, fleet size, investments, number of countries present in, major economies of concern, etc. that have been reported by the company in its annual reports, webpage. For companies having scarce financial disclosures, paid databases like D&B Hoovers, Dow Jones Factiva have been resorted to and verified through industry/expert interactions.
- Transport and Storage Sector GDP - Value and growth of Transport and Storage Sector GDP has a direct relation to the freight and logistics market size. Hence, this variable has been studied and presented over the review period, in value terms (USD) and as share % of total GDP, in this industry trend. The data has been supported by concise and relevant commentary around the investments, developments, and current market scenario.
- Trends in E-Commerce Industry - Enhanced internet connectivity and boom in smartphone penetration, coupled with increasing disposable incomes, has led to a phenomenal growth in the e-commerce market globally. Online shoppers require fast and efficient delivery of their orders leading to an increase in the demand for logistics services especially e-commerce fulfilment services. Hence, the Gross Merchandise Value (GMV), historial and projected growth, breakup of major commodity groups in e-commerce industry for the studied geography (country or region as per scope of the report) have been analysed and presented in this industry trend.
- Trends in Manufacturing Industry - Manufacturing industry involves the transformation of raw materials into finished products, while logistics industry ensures the efficient flow of raw materials to the factory, and the transport of manufactured products to the distributors & consumers. Demand-Supply of both industries are highly cross-linked and critical for a seamless supply chain. Hence, the Gross Value Added (GVA), breakup of GVA into major manufacturing sectors, and growth of manufacturing industry over the review period have been analysed and presented, in this industry trend.
- Wholesale and Retail Trade (Offline) - This end user industry segment captures the external (outsourced) logistics expenditure incurred by the wholesalers and retailers, through offline sales channel, on Courier, Express, and Parcel (CEP) services. The end user players considered are the establishments primarily engaged in wholesaling or retailing merchandise, generally without transformation, and rendering services incidental to the sale of merchandise. Logistics Service Providers (LSPs) plays a crucial role in the reliable movement of supplies to and finished products from production houses to the distributors and finally to the end customer covering activites like material sourcing, transportation, order fulfillment, warehousing & storage, demand forecasting, inventory management etc.
| Keyword | Definition |
|---|---|
| Axle Load | The axle load refers to the total load (weight) bearing on the roadway through wheels connected to a given axle. Across the globe, there are systems in place to ensure axle load monitoring, wherein surpassing the defined limits set by the concerned regulatory authority can lead to penalty/fine. For transportation of goods via road this can be an important determinant of costs as knowledge about the axle load limits can be used to (i) load the vehicle optimally for maximizing profits (ii) avoid exceeding the same and hence the probable fines associated (iii) avoid wear and tear of the vehicle (iv) avoid damage to pavement resulting in noticeable public maintenance and repair costs (v) achieve better turnaround time. |
| Back Haul | Backhaul is the return movement of a transport vehicle from its original destination to its original point of departure, and can include full, partial, or empty truck loads (all or part of the way) depending on the visibility of the local freight ecosystem. In this regard, transportation of empty containers to the point of origin, known as deadheading is also a significant factor, considering the supply/container shortages across the geographies, resulting in cost escalation and under optimized profit potential attainment. Generally, the carriers offer discounts on the backhaul, to secure freight for the trip. |
| Bill of Lading (BOL) | A bill of lading is a legal contract document issued by a carrier to a shipper to acknowledge reception of their cargo, and is evidence for the contract of carriage between the two parties. Broadly it details the (i) type, quantity, and other specifications of the goods being carried (ii) destination, and terms & conditions of the shipment (iii) carrier and drivers with all the necessary information to process the shipment, which can be used for insurance and customs clearance purposes (iv) assurance that the consignment is damage-free and ready to be shipped to the consignee. In this regard, a house bill of lading (HBL) is a document issued by a freight forwarder or a non-vessel operating common carrier (NVOCC) to acknowledge receipt of items for shipment (to a shipper). If shipments from several shippers are involved a master bill of lading (MBL) might be involved which is a consolidated version of the same for all the shipments being taken care of by the carrier (to a common destination) and might be issued by the carrier to the freight forwarder or the shipper (depending on who books the transport). |
| Bunkering | Bunkering is the process of supplying fuel to power the propulsion system of a ship. It includes the logistics of loading and distributing the fuel among available shipboard tanks. In this regard, (i) Bunker fuel is technically any type of fuel oil used aboard ships. It gets its name from the containers on ships and in ports that it is stored in; in the days of steam they were coal bunkers but now they are bunker-fuel tanks, (ii) Bunker refers to the spaces (Tank) on board a vessel to store fuel, (iii) Bunker trader refers to a person dealing in trade of bunker (fuel), (iv) Bunker call is made when a cargo ship anchors or berths in a port to take on bunker oil or supplies, (v) Bunkering service is the supply of a requested quality and quantity of bunkers to a ship. Bunkering is signficant from point of view of freight rates applicable to the shipper as Bunker Contribution (BUC)/ Fuel Adjustment Factor (FAF)/ Bunker Adjustment Factor (BAF) are applied by shipping lines to offset the effect of fluctuations in the cost of bunkers. |
| Cabotage | Transport by a vehicle registered in a country, performed on the national territory of another country. Cabotage law may restrict domestic cargo traffic to be carried in its own nationally registered, and sometimes built and crewed vehicles, though regulations vary across industries/commodity groups/countries and sometimes specify maximum allowable percentage of cabotage that can be serviced by foreign registered fleet. |
| C-commerce | Collaborative commerce (also known as C-commerce), (i) describes electronically enabled business interactions among an enterprise’s internal personnel, business partners and customers throughout a trading community (industry, industry segment, supply chain or supply chain segment); (ii) is the optimization of supply and distribution channels to capitalize on the global economy by using new technology efficiently. Advantages of C-commerce, to detail few include (i) maximization of organization's efficiency and profitability (ii) technology integration with physical channels to allow companies to work together (iii) increased information exchange such as inventory and product specifications, using the web as an intermediary (iv) increased competitiveness by reaching a broader audience. Examples of C-commerce, also known as peer-to-peer commerce, include (i) companies that allow consumers to rent things from each other, or marketplaces, such as Meta (formerly Facebook) Marketplace, that allow the sale of used goods; (ii) DoorDash teamed up with many national brands, such as McDonald’s and Chipotle, to offer fast food delivery, building their business model on c-commerce. They have since expanded their delivery service from restaurants to retailers and even offer 'fleets' of drivers to businesses. |
| Courier | A business/company that delivers packages/parcels/shipments (upto 70 kgs) including quick door to door pickup and delivery service for goods or documents, domestically or internationally, on a commercial contract basis. Example, DHL Group, FedEx, United Parcel Service of America, Inc., USPS, International Distributions Services, J&T Express, SF Express among several others |
| Cross docking | Cross docking is a practice in logistics management that includes unloading incoming delivery vehicles and loading the materials directly into outbound delivery vehicles, omitting traditional warehouse logistical practices and saving time and money. It requires close synchronization of both inbound and outbound movements. It is highly significant in reduction of costs pertaining to warehousing & storage (and the associated Value Added Services). |
| Cross Trade | International transport between two different countries performed by a vehicle registered in a third country. A third country is a country other than the country of loading/embarkation and the country of unloading/disembarkation. Cross Trade law may restrict international cargo traffic to be carried by respective country's registered vehicles, and sometimes built and crewed vehicles, though regulations vary across industries/commodity groups/countries and sometimes specify maximum allowable percentage of cross trade that can be serviced by foreign registered fleet. |
| Customs Clearance | The process of declaring and clearing cargoes through customs. It includes the procedures involved in getting cargo released by Customs through designated formalities such as presenting import license/permit, payment of import duties and other required documentations by the nature of the cargo. In this regard, a customs broker is a person or company licensed by the respective department of the country to act on behalf of freight importers and exporters. |
| Dangerous Goods | Dangerous goods (or hazardous materials or HAZMAT) include flammable liquids/solids, gases (compressed, liquified, dissolved under pressure), corrosives, oxidising substances, explosive substances and articles, substances which on contact with water emit flammable gasses, organic peroxides, toxic substances, infectious substances, radioactive materials, miscellaneous dangerous goods and articles. |
| First mile Delivery | First mile delivery refers to the (i) first stage of the freight/shipment/cargo/courier transportation (ii) the transportation of goods from a merchant’s premises or warehouse to the next fulfillment centre/warehouse/hub from where the goods are forwarded (iii) shipping goods from local distribution centers to stores (For retailers) (iv) transportation of finished goods from a plant or a factory to a distribution center (For manufacturers), (v) pick up of goods from the end-customer’s home or store followed by movement to a warehouse or storage location (movers and packers), (vi) process where goods are picked up from a retailer and then transferred to third-party logistics providers or courier service providers to be delivered to the end-consumer (e-commerce). Once the package reaches the next warehouse or the courier’s hub, it is then sorted and transported further until it reaches the customer’s doorstep. Example, if one chooses UPS as a courier, first-mile delivery will be the product being delivered from manufacturer's/retailer's warehouse to the UPS’s warehouse/ fulfilment centre. |
| Last Mile Delivery | Last mile delivery refers to the very last step of the delivery process when a parcel is moved from a transportation hub (warehouse or a distribution center or fulfillment centre) to its final destination, which usually is a personal residence/retail store/ business, or parcel locker. It accounts for around half of the total cost involved in entire process of first mile, middle mile, and last mile delivery, though it can vary shipment to shipment, based on commodity, business model and similar factors. |
| Milkrun | A Milk Run is a delivery method used to transport mixed loads from various suppliers to one customer, using lean management principles applied to logistics. Instead of each supplier sending a truck every week to meet the needs of one customer, one truck (or vehicle) visits the suppliers to pick up the loads for that customer. This method of transport got its name from the dairy industry practice, where one tanker used to collect milk from several dairy farms for delivery to a milk processing company. A milk run can be a more efficient way to handle logistics but require proper planning. If the route involves products from different companies, there is need for an agreement about cost-sharing and other aspects of the cooperative delivery arrangement. Once the group settles these issues, this delivery method can save time and money for everyone by pooling operation costs and resources. |
| Multi country consolidation | Multi-Country Consolidation (MCC) is a cost-effective solution that consolidates one's cargo from different countries of origin to build Full Container Loads (FCL). MCC is most suitable for companies that import light volumes of goods from multiple countries but want to take advantage of the more economic FCL freight rates. Apart from costing some of the other advantages include (i) flexibility to choose suppliers from a wider range of origin countries without worrying about the logistics to final destination from each origin, (ii) ability to pick the most suitable suppliers from many different countries for one's business operations. The increase in one's sourcing options by MCC provides the kind of flexibility needed in competitive global markets. |
| Q-commerce | Q-commerce, also referred to as quick commerce, is a type of e-commerce where emphasis is on quick deliveries, typically in less than an hour. The companies providing Q-Commerce services might have vertically intergrated model or might be using third party delivery platforms (outsourced logistics). It has advantages like (i) competitve USP, (ii) potential to earn greater profit margins, (iii) better customer experience, (iv) guaranteed availability of products, (v) traceability, and (vi) scaleability. |
| ReverseLogistics | Reverse logistics is a type of supply chain management that moves goods from customers back to the sellers or manufacturers and may involve ciruclar economy principles (3Rs) viz. recycling, reuse (repurposing, reselling), reducing or repairing. In this regard, reverse commerce (or Recommerce) is the selling of previously owned items through physical or online marketplaces/distribution channels to buyers who reuse, recycle or resell them. |


Research Methodology
Mordor Intelligence follows a four-step methodology in all our reports.
- Step-1: Identify Key Variables: In order to build a robust forecasting methodology, the variables and factors identified in Step-1 are tested against available historical market numbers. Through an iterative process, the variables required for market forecast are set and the model is built on the basis of these variables.
- Step-2: Build a Market Model: Market-size estimations for the forecast years are in nominal terms. Inflation is considered to be a part of the pricing, and the average selling price (ASP) is varying throughout the forecast period for each country
- Step-3: Validate and Finalize: In this important step, all market numbers, variables and analyst calls are validated through an extensive network of primary research experts from the market studied. The respondents are selected across levels and functions to generate a holistic picture of the market studied.
- Step-4: Research Outputs: Syndicated Reports, Custom Consulting Assignments, Databases & Subscription Platforms


