Taro Market Size and Share
Taro Market Analysis by Mordor Intelligence
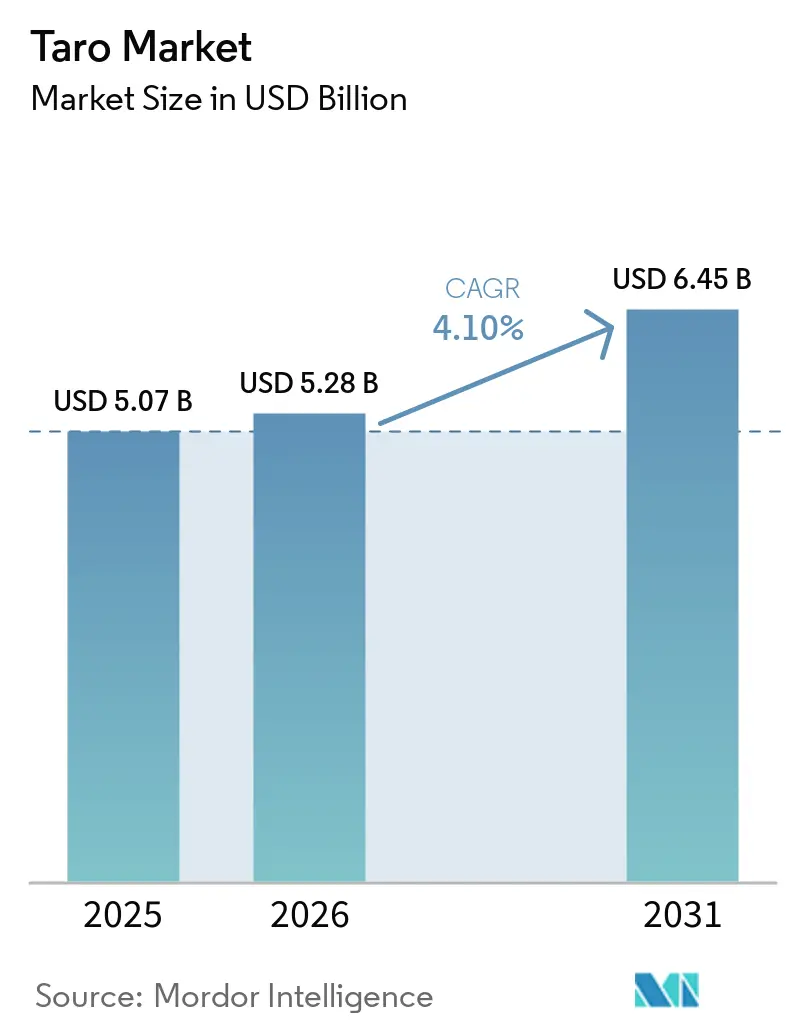
The taro market size is projected to increase from USD 5.07 billion in 2025 to USD 5.28 billion in 2026 and reach USD 6.45 billion by 2031, growing at a CAGR of 4.1% over 2026-2031. The taro market is expanding faster than broader root vegetable categories because demand is rising in import-dependent countries while supply remains concentrated in tropical smallholder systems. According to FAOSTAT, global taro production reached 18.2 million metric tons in 2024, from 17 million metric tons in 2023, which keeps the taro market exposed to a clear gap between where taro is grown and where premium trade demand is concentrated. That imbalance supports trade-led pricing, especially in markets where buyers pay more for phytosanitary compliance, reliable delivery, and uniform quality. The taro market is also benefiting from its wider use in beverages, desserts, snack foods, and health-focused food products, which has moved the crop beyond staple consumption in traditional communities.
Key Report Takeaways
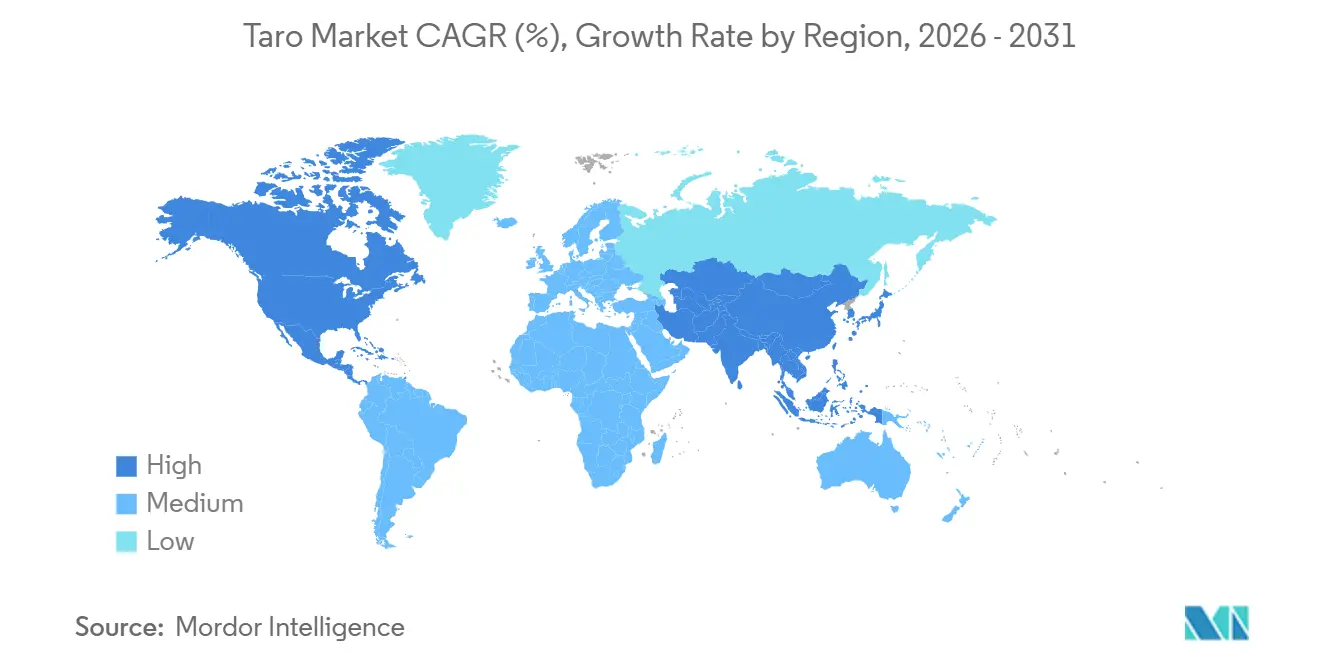
- By geography, Asia-Pacific is the largest regional market, holding 47.0% of the taro market share in 2025, while North America is projected to be the fastest-growing region, with a 5.8% CAGR from 2026 to 2031.
Note: Market size and forecast figures in this report are generated using Mordor Intelligence’s proprietary estimation framework, updated with the latest available data and insights as of January 2026.
Global Taro Market Trends and Insights
Drivers Impact Analysis*
| Driver | (~) % Impact on CAGR Forecast | Geographic Relevance | Impact Timeline |
|---|---|---|---|
| Rising vegan and plant-based diet adoption | +0.9% | North America, Europe, and Australia | Medium term (2-4 years) |
| Growing ethnic and diaspora food demand | +0.9% | North America, Oceania, and Europe | Short term (≤ 2 years) |
| Culinary versatility and product innovation | +0.6% | North America, Asia-Pacific, and Europe | Short term (≤ 2 years) |
| Strong nutritional profile and functional food positioning | +0.5% | North America, Japan, and Australia | Medium term (2-4 years) |
| Government support for cultivars, agronomy, and export readiness | +0.3% | Asia-Pacific, Oceania, and Africa | Long term (≥ 4 years) |
| Traceability, digital price signals, and better market access | +0.3% | North America, Europe, and East Asia | Medium term (2-4 years) |
| Source: Mordor Intelligence | |||
Rising Vegan and Plant-Based Diet Adoption
The taro market is benefiting from changing consumer food preferences as plant-based and vegan diets become more widely adopted in North America and Europe. Consumers seeking alternatives to wheat, potatoes, and highly processed carbohydrates are increasingly exploring root crops that align with clean-label and minimally processed food trends. Taro is gaining traction in this shift because it is naturally gluten-free and versatile across multiple food applications, including dairy alternatives, plant-based snacks, soups, and beverages. Retailers and foodservice operators are also expanding plant-based menu offerings, which is improving the visibility of taro among mainstream consumers beyond traditional ethnic communities. As vegan and flexitarian eating patterns continue to influence purchasing behavior, taro is increasingly positioned as a plant-derived carbohydrate option that supports diversified dietary preferences and specialty food demand.
Growing Ethnic and Diaspora Food Demand
Ethnic and diaspora demand remains one of the most stable foundations for taro consumption in developed markets. Taro continues to function as an everyday staple, and its import increases across Pacific Islander, Asian, African, and Caribbean communities in North America, Europe, Oceania, and selected Middle Eastern cities. According to the ITC Trade Map, Europe's imports of taro totaled 168,692 metric tons in 2025, up from 157,989 metric tons in 2024[1]Source: International Trade Centre, “Trade Map,” trademap.org. This matters because staple purchasing is tied more closely to routine food habits than to short-lived retail trends. Demand from these communities tends to support regular import flows, repeat purchases, and established wholesale networks. It also gives importers a more dependable volume base while they expand into mainstream grocery and foodservice channels. In practice, diaspora retail networks often absorb fluctuations better than newer consumer channels because taro is purchased for regular meals rather than for occasional trial
Culinary Versatility and Product Innovation
Taro has moved beyond its traditional role in household cooking and now appears in beverage, dessert, snack, and restaurant applications across several import markets. Bubble tea has been especially important because taro-flavored drinks introduced the ingredient to younger consumers with no prior connection to it. That creates a second layer of demand that does not depend solely on diaspora growth. Foodservice operators have also adopted taro in premium menus where texture, color, and novelty matter. In April 2025, KD Healthy Foods introduced premium IQF taro in multiple cuts for North American, European, and Asian buyers, showing that the commercial ecosystem around taro is becoming more sophisticated. As these adjacent formats expand, they support wider consumer awareness and reinforce upstream demand for commercial taro supply.
Strong Nutritional Profile and Functional Food Positioning
Recent academic research has strengthened taro’s positioning as a nutrient-dense root crop with functional food potential. Taro corms contain complex carbohydrates, dietary fiber, potassium, vitamin C, and folate, while also providing small starch granules that are easily digestible. Research has additionally highlighted the presence of resistant starch, flavonoids, anthocyanins, and polyphenols associated with digestive health and antioxidant properties. These nutritional characteristics are supporting the use of taro in health-focused food products, infant nutrition, and specialty diets emphasizing gut health and minimally processed ingredients. As awareness of nutrient-rich functional foods continues to increase, food manufacturers and retailers are using taro’s nutritional composition to strengthen product differentiation and premium positioning in the market.
Restraints Impact Analysis*
| Restraint | (~) % Impact on CAGR Forecast | Geographic Relevance | Impact Timeline |
|---|---|---|---|
| Short shelf life and post-harvest fragility | -0.5% | Oceania, South America, Africa, and Asia-Pacific | Short term (≤ 2 years) |
| Climate variability and yield disruption | -0.4% | Pacific Islands, Southeast Asia, and Africa | Long term (≥ 4 years) |
| High cultivation, logistics, and compliance costs | -0.5% | North America, Europe, and Japan | Medium term (2-4 years) |
| Limited consumer familiarity outside traditional communities | -0.3% | Europe, Non-coastal North America, and Middle East | Medium term (2-4 years) |
| Source: Mordor Intelligence | |||
Climate Variability and Yield Disruption
Climate pressure has become a persistent constraint in taro production, especially in Pacific and tropical smallholder systems. Field evidence showed that drought, waterlogging, pest pressure, and disease outbreaks can reduce marketable yield and disrupt harvest timing. According to FAOSTAT, globally taro yield was 7,479.6 kg/ha in 2025, which decreased from 7,515.5 kg/ha in 2024[2]Source: FAOSTAT, “Crops and Livestock Products,” Food and Agriculture Organization of the United Nations, fao.org. In Fiji, output in the Taveuni taro area fell sharply over the past decade under the combined pressure of soil degradation, higher input costs, unstable prices, and climate stress. Because several premium import markets depend on a narrow group of Pacific exporters, these disruptions carry wider trade consequences than local production losses alone might suggest. Importing countries often have limited ability to replace lost volumes quickly with equivalent quality and compliance from alternative origins.
Limited Consumer Familiarity Outside Traditional Communities
Outside established consuming communities, taro still faces a consumer education gap. Many buyers remain unfamiliar with preparation methods, taste expectations, and safe cooking practices. That makes mainstream retail expansion slower than growth in ethnic stores, specialty grocers, or bubble tea chains. Even though academic sources now support taro’s functional and nutritional value, those benefits do not translate into regular purchases unless consumers understand how to use the product. This slows rotation in general grocery settings and raises the risk of waste at retail. As a result, broader demand often follows targeted channel development rather than mass-market rollout
*Our forecasts treat driver/restraint impacts as directional, not additive. The impact forecasts reflect baseline growth, mix effects, and variable interactions.
Geography Analysis
Asia-Pacific is the largest regional market, accounting for 47.0% of the taro market in 2025. Asia-Pacific remains the core volume center of the taro market because it combines strong production with deep-rooted consumption. According to the ITC Trade Map, China is the strongest single regional contributor in the source set, exporting 45,793 thousand metric tons of taro in 2024, which increased to 55,740 thousand metric tons in 2025[3]Source: International Trade Centre, “Trade Map,” trademap.org. Japan strengthens the region’s value profile by importing USD 54,156 thousand in taro in 2025, and absorbing a significant share of Chinese shipments. This makes Asia-Pacific important not only as a producing region, but also as a trade and quality benchmark for the product. The region benefits from stronger commercial infrastructure, more experienced buyers and sellers, and a consumer base that already knows the crop well.
North America is projected to be the fastest-growing region, with a 5.8% CAGR from 2026 to 2031. North America plays a different role, acting primarily as a premium demand center rather than a large-scale commercial producer. According to the ITC Trade Map, the United States imported USD 76,556 thousand of taro in 2024, making it the largest single-country import market in the source set. Demand there is supported by diaspora grocery, expanding foodservice use, and growing interest in taro across beverage and specialty food channels. This gives North America a strong value role even though it depends heavily on external supply. In practical terms, the region rewards exporters that can deliver compliance, consistency, and year-round volumes.
Europe, South America, and the Middle East and Africa occupy more mixed positions. Europe is still a smaller destination base and remains closely tied to diaspora consumption and specialty retail. The Middle East and Africa category includes the world’s largest production base by volume, yet much of African taro remains in domestic or intra-regional use rather than entering formal premium trade. This shows that volume leadership does not automatically translate into export leadership. Commercial participation depends on infrastructure, standards, and access to export channels as much as on field output.


Competitive Landscape
The taro market involves various stakeholders, including exporters, importers, producers, and distributors. Competitive advantage in this market is driven by factors such as improved cold-chain management, consistent grading, adherence to phytosanitary standards, and access to repeat buyers in premium import markets. Companies that effectively connect smallholder supply chains with export-grade handling standards are better positioned to capture value. This dynamic keeps the market accessible to regional traders, processors, and specialized exporters, rather than being dominated solely by large multinational produce firms.
Simultaneously, increasing demand from health-conscious consumers and Asian diaspora populations in North America and Europe is elevating the importance of traceability and product differentiation. Importers are showing a preference for suppliers who can deliver standardized sizing, residue-compliant produce, and reliable year-round availability. This trend is prompting exporters to invest in integrated sourcing networks, post-harvest infrastructure, and certification programs such as GlobalG.A.P. and HACCP to enhance buyer confidence and secure long-term supply agreements.
Additionally, processing and value-added applications are opening new opportunities in the taro market beyond traditional fresh exports. Products such as frozen taro, taro flour, chips, puree, and ready-to-cook items are gaining popularity in retail and foodservice channels, particularly in urban markets where convenience is a growing priority. Companies that integrate fresh supply operations with basic processing capabilities can improve profit margins, minimize post-harvest losses, and diversify revenue streams. Consequently, competitive positioning in the market increasingly depends not only on agricultural production capacity but also on downstream handling, packaging innovation, and adaptation to market-specific product requirements.
Recent Industry Developments
- March 2025: Grow Grow Papua New Guinea (PNG) and International Food Policy Research Institute (IFPRI) conducted field work in the Markham Valley to assess climate-related production challenges for smallholder taro farmers. This is research-led rather than a formal government scheme, but it is relevant to future policy support.
- March 2024: The National Agricultural Research Institute (NARI) initiated a program to export premium taro to global markets, beginning with a shipment of 13 metric tons of high-quality Morobe taro to New Zealand. Additionally, NARI introduced seven new taro cultivars (NT1 through NT7) developed to improve yields and promote sustainable farming practices.
- January 2024: Philippine taro cultivars were identified through a research and development (R&D) program funded by the Philippine Council for Agriculture, Aquatic and Natural Resources Research and Development under the Department of Science and Technology (DOST-PCAARRD).


Global Taro Market Report Scope
Taro, also known as cocoyam, refers to the corms and tubers of various plants in the Araceae family. Among these, Colocasia esculenta (L.) Schott, commonly known as dasheen or eddo, is the most widely cultivated. In this report, taro is defined as an edible aroid found globally, with a significant presence in tropical regions. The taro market is segmented by Geography (North America, Europe, Asia-Pacific, the Middle East, and Africa). The study includes production analysis (volume), consumption analysis (value and volume), export analysis (value and volume), import analysis (value and volume), and price trend analysis. The report offers the market size and forecast in both value (USD) and volume (metric tons).
| North America | United States | Production Analysis (Area Harvested, Yield, and Production Volume) |
| Consumption Analysis (Consumption Value and Volume) | ||
| Import Market Analysis (Import Value, Volume, and Key Supplying Markets) | ||
| Export Market Analysis (Export Value, Volume, and Key Destination Markets) | ||
| Wholesale Price Trend Analysis and Forecast | ||
| Regulatory Framework | ||
| List of Key Players | ||
| Logistics and Infrastructure | ||
| Seasonality Analysis | ||
| Canada | Production Analysis (Area Harvested, Yield, and Production Volume) | |
| Consumption Analysis (Consumption Value and Volume) | ||
| Import Market Analysis (Import Value, Volume, and Key Supplying Markets) | ||
| Export Market Analysis (Export Value, Volume, and Key Destination Markets) | ||
| Wholesale Price Trend Analysis and Forecast | ||
| Regulatory Framework | ||
| List of Key Players | ||
| Logistics and Infrastructure | ||
| Seasonality Analysis | ||
| Europe | France | Production Analysis (Area Harvested, Yield, and Production Volume) |
| Consumption Analysis (Consumption Value and Volume) | ||
| Import Market Analysis (Import Value, Volume, and Key Supplying Markets) | ||
| Export Market Analysis (Export Value, Volume, and Key Destination Markets) | ||
| Wholesale Price Trend Analysis and Forecast | ||
| Regulatory Framework | ||
| List of Key Players | ||
| Logistics and Infrastructure | ||
| Seasonality Analysis | ||
| Germany | Production Analysis (Area Harvested, Yield, and Production Volume) | |
| Consumption Analysis (Consumption Value and Volume) | ||
| Import Market Analysis (Import Value, Volume, and Key Supplying Markets) | ||
| Export Market Analysis (Export Value, Volume, and Key Destination Markets) | ||
| Wholesale Price Trend Analysis and Forecast | ||
| Regulatory Framework | ||
| List of Key Players | ||
| Logistics and Infrastructure | ||
| Seasonality Analysis | ||
| Italy | Production Analysis (Area Harvested, Yield, and Production Volume) | |
| Consumption Analysis (Consumption Value and Volume) | ||
| Import Market Analysis (Import Value, Volume, and Key Supplying Markets) | ||
| Export Market Analysis (Export Value, Volume, and Key Destination Markets) | ||
| Wholesale Price Trend Analysis and Forecast | ||
| Regulatory Framework | ||
| List of Key Players | ||
| Logistics and Infrastructure | ||
| Seasonality Analysis | ||
| Russia | Production Analysis (Area Harvested, Yield, and Production Volume) | |
| Consumption Analysis (Consumption Value and Volume) | ||
| Import Market Analysis (Import Value, Volume, and Key Supplying Markets) | ||
| Export Market Analysis (Export Value, Volume, and Key Destination Markets) | ||
| Wholesale Price Trend Analysis and Forecast | ||
| Regulatory Framework | ||
| List of Key Players | ||
| Logistics and Infrastructure | ||
| Seasonality Analysis | ||
| Asia-Pacific | China | Production Analysis (Area Harvested, Yield, and Production Volume) |
| Consumption Analysis (Consumption Value and Volume) | ||
| Import Market Analysis (Import Value, Volume, and Key Supplying Markets) | ||
| Export Market Analysis (Export Value, Volume, and Key Destination Markets) | ||
| Wholesale Price Trend Analysis and Forecast | ||
| Regulatory Framework | ||
| List of Key Players | ||
| Logistics and Infrastructure | ||
| Seasonality Analysis | ||
| India | Production Analysis (Area Harvested, Yield, and Production Volume) | |
| Consumption Analysis (Consumption Value and Volume) | ||
| Import Market Analysis (Import Value, Volume, and Key Supplying Markets) | ||
| Export Market Analysis (Export Value, Volume, and Key Destination Markets) | ||
| Wholesale Price Trend Analysis and Forecast | ||
| Regulatory Framework | ||
| List of Key Players | ||
| Logistic and Infrastructure | ||
| Seasonality Analysis | ||
| Japan | Production Analysis (Area Harvested, Yield, and Production Volume) | |
| Consumption Analysis (Consumption Value and Volume) | ||
| Import Market Analysis (Import Value, Volume, and Key Supplying Markets) | ||
| Export Market Analysis (Export Value, Volume, and Key Destination Markets) | ||
| Wholesale Price Trend Analysis and Forecast | ||
| Regulatory Framework | ||
| List of Key Players | ||
| Logistics and Infrastructure | ||
| Seasonality Analysis | ||
| South America | Brazil | Production Analysis (Area Harvested, Yield, and Production Volume) |
| Consumption Analysis (Consumption Value and Volume) | ||
| Import Market Analysis (Import Value, Volume, and Key Supplying Markets) | ||
| Export Market Analysis (Export Value, Volume, and Key Destination Markets) | ||
| Wholesale Price Trend Analysis and Forecast | ||
| Regulatory Framework | ||
| List of Key Players | ||
| Logistics and Infrastructure | ||
| Seasonality Analysis | ||
| Argentina | Production Analysis (Area Harvested, Yield, and Production Volume) | |
| Consumption Analysis (Consumption Value and Volume) | ||
| Import Market Analysis (Import Value, Volume, and Key Supplying Markets) | ||
| Export Market Analysis (Export Value, Volume, and Key Destination Markets) | ||
| Wholesale Price Trend Analysis and Forecast | ||
| Regulatory Framework | ||
| List of Key Players | ||
| Logistics and Infrastructure | ||
| Seasonality Analysis | ||
| Middle East | Turkey | Production Analysis (Area Harvested, Yield, and Production Volume) |
| Consumption Analysis (Consumption Value and Volume) | ||
| Import Market Analysis (Import Value, Volume, and Key Supplying Markets) | ||
| Export Market Analysis (Export Value, Volume, and Key Destination Markets) | ||
| Wholesale Price Trend Analysis and Forecast | ||
| Regulatory Framework | ||
| List of Key Players | ||
| Logistics and Infrastructure | ||
| Seasonality Analysis | ||
| Africa | South Africa | Production Analysis (Area Harvested, Yield, and Production Volume) |
| Consumption Analysis (Consumption Value and Volume) | ||
| Import Market Analysis (Import Value, Volume, and Key Supplying Markets) | ||
| Export Market Analysis (Export Value, Volume, and Key Destination Markets) | ||
| Wholesale Price Trend Analysis and Forecast | ||
| Regulatory Framework | ||
| List of Key Players | ||
| Logistics and Infrastructure | ||
| Seasonality Analysis | ||
| By Geography | North America | United States | Production Analysis (Area Harvested, Yield, and Production Volume) |
| Consumption Analysis (Consumption Value and Volume) | |||
| Import Market Analysis (Import Value, Volume, and Key Supplying Markets) | |||
| Export Market Analysis (Export Value, Volume, and Key Destination Markets) | |||
| Wholesale Price Trend Analysis and Forecast | |||
| Regulatory Framework | |||
| List of Key Players | |||
| Logistics and Infrastructure | |||
| Seasonality Analysis | |||
| Canada | Production Analysis (Area Harvested, Yield, and Production Volume) | ||
| Consumption Analysis (Consumption Value and Volume) | |||
| Import Market Analysis (Import Value, Volume, and Key Supplying Markets) | |||
| Export Market Analysis (Export Value, Volume, and Key Destination Markets) | |||
| Wholesale Price Trend Analysis and Forecast | |||
| Regulatory Framework | |||
| List of Key Players | |||
| Logistics and Infrastructure | |||
| Seasonality Analysis | |||
| Europe | France | Production Analysis (Area Harvested, Yield, and Production Volume) | |
| Consumption Analysis (Consumption Value and Volume) | |||
| Import Market Analysis (Import Value, Volume, and Key Supplying Markets) | |||
| Export Market Analysis (Export Value, Volume, and Key Destination Markets) | |||
| Wholesale Price Trend Analysis and Forecast | |||
| Regulatory Framework | |||
| List of Key Players | |||
| Logistics and Infrastructure | |||
| Seasonality Analysis | |||
| Germany | Production Analysis (Area Harvested, Yield, and Production Volume) | ||
| Consumption Analysis (Consumption Value and Volume) | |||
| Import Market Analysis (Import Value, Volume, and Key Supplying Markets) | |||
| Export Market Analysis (Export Value, Volume, and Key Destination Markets) | |||
| Wholesale Price Trend Analysis and Forecast | |||
| Regulatory Framework | |||
| List of Key Players | |||
| Logistics and Infrastructure | |||
| Seasonality Analysis | |||
| Italy | Production Analysis (Area Harvested, Yield, and Production Volume) | ||
| Consumption Analysis (Consumption Value and Volume) | |||
| Import Market Analysis (Import Value, Volume, and Key Supplying Markets) | |||
| Export Market Analysis (Export Value, Volume, and Key Destination Markets) | |||
| Wholesale Price Trend Analysis and Forecast | |||
| Regulatory Framework | |||
| List of Key Players | |||
| Logistics and Infrastructure | |||
| Seasonality Analysis | |||
| Russia | Production Analysis (Area Harvested, Yield, and Production Volume) | ||
| Consumption Analysis (Consumption Value and Volume) | |||
| Import Market Analysis (Import Value, Volume, and Key Supplying Markets) | |||
| Export Market Analysis (Export Value, Volume, and Key Destination Markets) | |||
| Wholesale Price Trend Analysis and Forecast | |||
| Regulatory Framework | |||
| List of Key Players | |||
| Logistics and Infrastructure | |||
| Seasonality Analysis | |||
| Asia-Pacific | China | Production Analysis (Area Harvested, Yield, and Production Volume) | |
| Consumption Analysis (Consumption Value and Volume) | |||
| Import Market Analysis (Import Value, Volume, and Key Supplying Markets) | |||
| Export Market Analysis (Export Value, Volume, and Key Destination Markets) | |||
| Wholesale Price Trend Analysis and Forecast | |||
| Regulatory Framework | |||
| List of Key Players | |||
| Logistics and Infrastructure | |||
| Seasonality Analysis | |||
| India | Production Analysis (Area Harvested, Yield, and Production Volume) | ||
| Consumption Analysis (Consumption Value and Volume) | |||
| Import Market Analysis (Import Value, Volume, and Key Supplying Markets) | |||
| Export Market Analysis (Export Value, Volume, and Key Destination Markets) | |||
| Wholesale Price Trend Analysis and Forecast | |||
| Regulatory Framework | |||
| List of Key Players | |||
| Logistic and Infrastructure | |||
| Seasonality Analysis | |||
| Japan | Production Analysis (Area Harvested, Yield, and Production Volume) | ||
| Consumption Analysis (Consumption Value and Volume) | |||
| Import Market Analysis (Import Value, Volume, and Key Supplying Markets) | |||
| Export Market Analysis (Export Value, Volume, and Key Destination Markets) | |||
| Wholesale Price Trend Analysis and Forecast | |||
| Regulatory Framework | |||
| List of Key Players | |||
| Logistics and Infrastructure | |||
| Seasonality Analysis | |||
| South America | Brazil | Production Analysis (Area Harvested, Yield, and Production Volume) | |
| Consumption Analysis (Consumption Value and Volume) | |||
| Import Market Analysis (Import Value, Volume, and Key Supplying Markets) | |||
| Export Market Analysis (Export Value, Volume, and Key Destination Markets) | |||
| Wholesale Price Trend Analysis and Forecast | |||
| Regulatory Framework | |||
| List of Key Players | |||
| Logistics and Infrastructure | |||
| Seasonality Analysis | |||
| Argentina | Production Analysis (Area Harvested, Yield, and Production Volume) | ||
| Consumption Analysis (Consumption Value and Volume) | |||
| Import Market Analysis (Import Value, Volume, and Key Supplying Markets) | |||
| Export Market Analysis (Export Value, Volume, and Key Destination Markets) | |||
| Wholesale Price Trend Analysis and Forecast | |||
| Regulatory Framework | |||
| List of Key Players | |||
| Logistics and Infrastructure | |||
| Seasonality Analysis | |||
| Middle East | Turkey | Production Analysis (Area Harvested, Yield, and Production Volume) | |
| Consumption Analysis (Consumption Value and Volume) | |||
| Import Market Analysis (Import Value, Volume, and Key Supplying Markets) | |||
| Export Market Analysis (Export Value, Volume, and Key Destination Markets) | |||
| Wholesale Price Trend Analysis and Forecast | |||
| Regulatory Framework | |||
| List of Key Players | |||
| Logistics and Infrastructure | |||
| Seasonality Analysis | |||
| Africa | South Africa | Production Analysis (Area Harvested, Yield, and Production Volume) | |
| Consumption Analysis (Consumption Value and Volume) | |||
| Import Market Analysis (Import Value, Volume, and Key Supplying Markets) | |||
| Export Market Analysis (Export Value, Volume, and Key Destination Markets) | |||
| Wholesale Price Trend Analysis and Forecast | |||
| Regulatory Framework | |||
| List of Key Players | |||
| Logistics and Infrastructure | |||
| Seasonality Analysis | |||


Key Questions Answered in the Report
What is the 2026 to 2031 growth outlook for taro?
The taro market is projected to grow from USD 5.28 billion in 2026 to USD 6.45 billion by 2031, at a CAGR of 4.10% during 2026-2031.
Which region leads global demand and supply?
Asia-Pacific leads the taro market in 2025 because it combines large-scale production with strong established consumption, especially in China, Japan, and Southeast Asia.
Why is North America expanding faster than other regions?
North America is projected to be the fastest-growing region, driven by rising demand in the United States supported by diaspora consumption, expanding health-food retail penetration, and increasing use across foodservice and beverage applications.
What is the main supply risk for exporters and importers?
Climate variability and perishability are the biggest risks, since extreme weather can raise spoiled or unsold farm-level volume by up to 20% and fresh corm shelf life can be only 2 to 3 days under ambient conditions.
Page last updated on:


