
Market Overview
| Study Period | 2020 - 2031 |
|---|---|
| Forecast Data Period | 2026 - 2031 |
| Base Year Market Size (2025) | USD 1.29 Billion |
| Market Size (2026) | USD 1.36 Billion |
| Market Size (2031) | USD 1.75 Billion |
| Growth Rate (2026 - 2031) | 5.17 % |
| Market Concentration | Medium |
Major Players *Disclaimer: Major Players sorted in no particular order Image © Mordor Intelligence. Reuse requires attribution under CC BY 4.0. | |
Taiwan Home Furniture Market Analysis by Mordor Intelligence
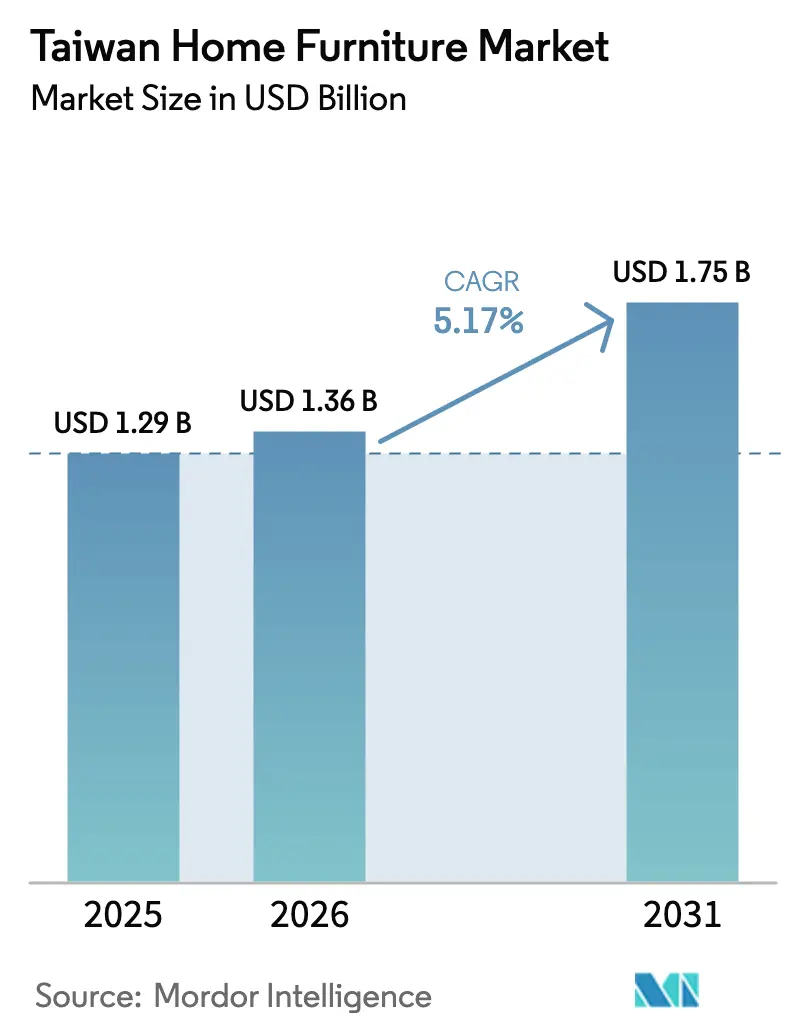
The Taiwan Home Furniture Market size is expected to grow from USD 1.29 billion in 2025 to USD 1.36 billion in 2026 and is forecast to reach USD 1.75 billion by 2031 at 5.17% CAGR over 2026-2031.
High population density in urban areas and limited living space are driving demand for compact, multifunctional, and space-efficient furniture. Rising disposable incomes and increased interest in home design have prompted consumers to prioritize furniture that combines both style and practicality. Younger urban residents and professionals are particularly drawn to modular and adaptable pieces suitable for smaller apartments or shared living arrangements. Taiwan’s urban population is approximately 18 million people, or 78% of the total population, which encourages buyers to choose convertible sofas, storage-integrated beds, and height-adjustable desks that offer higher utility and justify premium pricing[1]. E-commerce and digital channels are broadening access to a wider variety of furniture, while traditional retail stores remain important for providing hands-on experiences and customization options. Taiwan is set to become a super-aged society in 2025, with the share of residents aged 65 and above expected to exceed 20%, according to the Ministry of the Interior and the National Development Council. This designation aligns with the World Health Organization’s definition of a super-aged population. The increasing elderly population is boosting demand for ergonomic furniture and easily accessible storage solutions, with consumers willing to pay higher prices for products that enhance comfort, safety, and everyday usability[2].
Key Report Takeaways
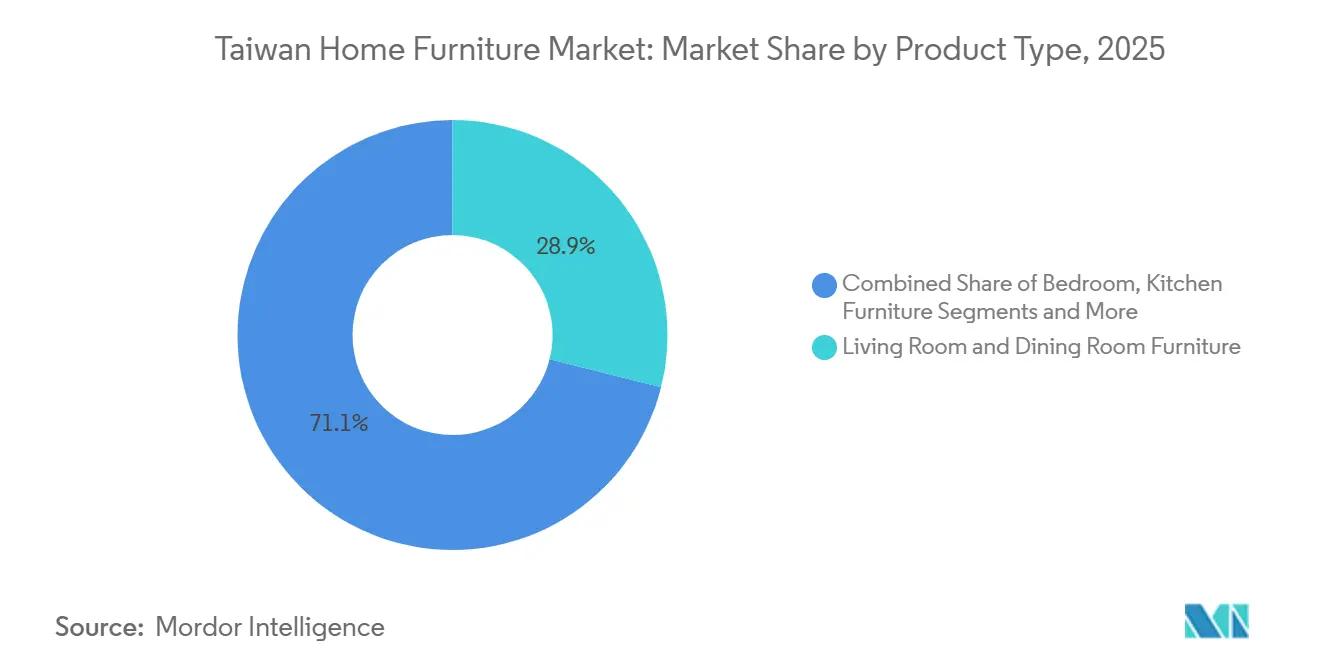
- By product type, living room and dining room furniture held 28.91% of the Taiwan home furniture market share in 2025, while home office furniture recorded the fastest trajectory with a 6.31% CAGR to 2031.
- By material, wood accounted for 47.23% of the Taiwan home furniture market share in 2025, and plastic and polymer are on track for a 5.78% CAGR through 2031.
- By price range, mid-range commanded 45.61% of the Taiwan home furniture market share in 2025, with the premium segment expected to grow at a 5.94% CAGR to 2031.
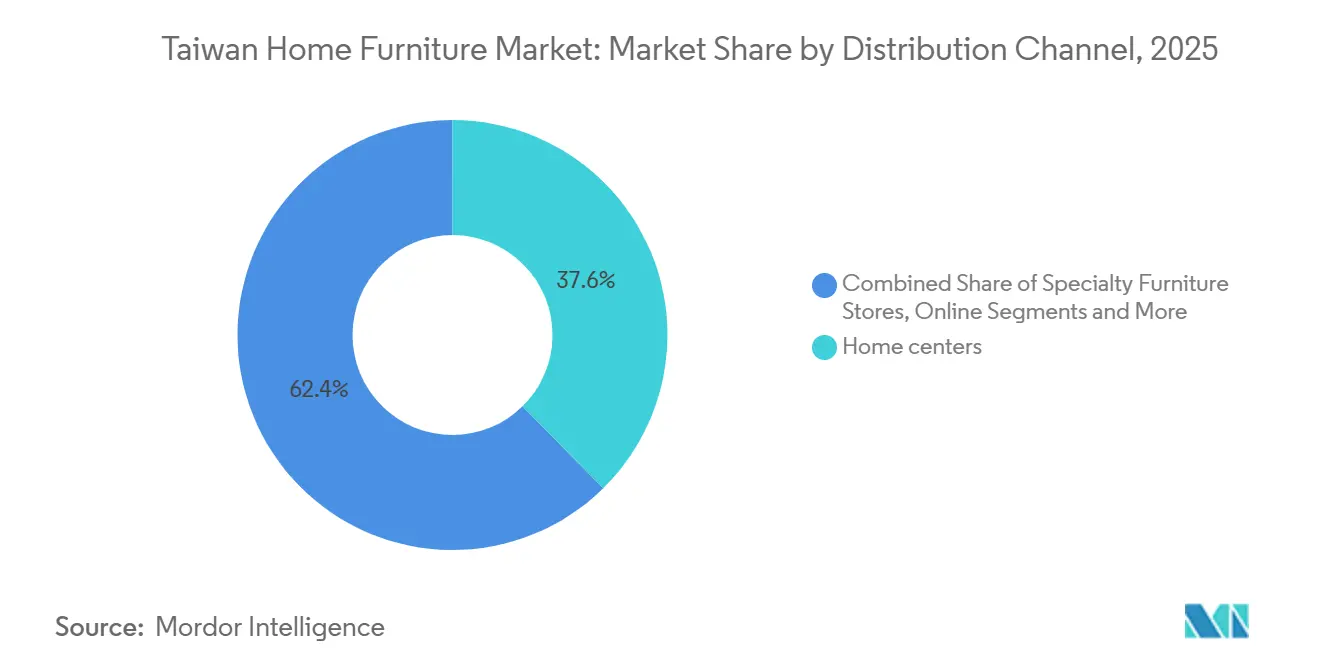
- By distribution channel, home centers led with 37.64% of the Taiwan home furniture market share in 2025, and online is poised to expand at a 6.82% CAGR to 2031.
- By geography, Northern Taiwan accounted for 35.83% of the Taiwan home furniture market share in 2025, and Southern Taiwan is projected as the fastest growing with a 6.21% CAGR through 2031.
Note: Market size and forecast figures in this report are generated using Mordor Intelligence’s proprietary estimation framework, updated with the latest available data and insights as of January 2026.
Market Trends and Insights
Drivers Impact Analysis of Taiwan Home Furniture Market*
| Driver | (~) % Impact on CAGR Forecast | Geographic Relevance | Impact Timeline |
|---|---|---|---|
| Rising demand for compact multifunctional furniture | +1.2% | Global, with the strongest concentration in Northern Taiwan (Taipei, New Taipei City) | Short term (≤ 2 years) |
| E-commerce penetration for bulky home goods | +0.9% | Global; Taiwan online retail at 25% category share | Medium term (2–4 years) |
| Housing-transaction rebound post-election | +0.6% | National, with early gains in Taoyuan, Taichung, Tainan | Short term (≤ 2 years) |
| Government subsidy for repatriated design-led manufacturing | +0.4% | National policy effect | Medium term (2–4 years) |
| Carbon-negative domestic timber initiatives | +0.3% | National, pilot in Mudan Township (Pingtung County) | Long term (≥ 4 years) |
| Factory automation is boosting local cost competitiveness | +0.8% | National; manufacturing hubs in Taichung, Tainan, Kaohsiung | Medium term (2–4 years) |
| Source: Mordor Intelligence | |||
Rising Demand for Compact Multifunctional Furniture Drives Urban Premium Segment
Shrinking household sizes and small unit footprints are reshaping purchasing decisions and lifting perceived value for multifunctional designs in the Taiwan home furniture market. Taiwan’s average household size trended lower through 2024, and the typical two-bedroom unit now fits below 30 ping, which makes storage-integrated beds, foldable desks, and modular shelving necessary choices rather than discretionary upgrades in dense districts. Central Taipei studio rents often fall in a range that nudges consumers to treat furniture as a utility investment because space efficiency offsets rent pressure in daily use[3]. The 2025 policy platform that includes a digital-nomad visa attracted professionals who often favor portable, reconfigurable setups, which reinforces demand for wall-mounted workstations and compact sofa beds that can serve as both work and leisure anchors in limited rooms. The super-aged shift, where those aged 65 years and above represent more than 20% of the population from 2025, reinforces the appeal of height-adjustable desks and ergonomic chairs that ease daily routines in small homes and reduce strain during long sitting hours[4].
E-Commerce Penetration Rewrites Distribution Economics for Bulky Home Goods
Online furniture sales in Taiwan reached NTD 30 billion (USD 916 million) in 2024, representing 25% of category revenue and a 15% annual growth rate, which confirms that even bulky goods can scale through digital channels when logistics and visualization tools are integrated end-to-end. Consumers want reliable delivery dates and convenient returns for large parcels, and service gaps in those two areas drive high abandonment, which is why parcel tracking, assembly options, and scheduled installation windows have become part of the baseline experience in the Taiwan home furniture market. Mobile payments and wallets continue to proliferate under a national target that aims at very high penetration, and that payments backbone encourages higher ticket purchases that historically remained in showrooms. Physical retailers in Taiwan lifted their online sales share of overall retail to 31% by late 2024, which shows that omnichannel adoption is now a defensive and offensive strategy for incumbents who must keep shoppers across both touchpoints for bulky goods[5]. The result is a hybrid buyer journey where 3D room planners, augmented visualization, and next-day delivery options allow consumers to complete a sofa or dining set purchase from a phone while scheduling in-home assembly and recycling in one flow.
Factory Automation Boosting Local Cost Competitiveness
Automation is moving from showcase to deployment across inbound logistics, warehouse operations, and last-mile processes that serve furniture shipments in Taiwan. A 2024 industry exhibition in Taipei featured autonomous mobile robots, AI-driven intralogistics, and computer vision that reduce picking times and tighten dispatch accuracy, which translates into fewer delivery windows missed and lower reverse-logistics costs for bulky items. Retailers that integrate computer vision and mobile self-checkout have also pointed to sharply faster checkout times and reduced staffing strain, which allows redeployment toward advisory roles in showrooms that improve the conversion of big-ticket furniture. These gains are relevant for Taiwan’s manufacturing clusters in Taichung, Tainan, and Kaohsiung, where automation can standardize repetitive elements of cabinet frames and metal fittings while freeing skilled workers to focus on finishing and customization. Over time, a denser automation layer can lift on-time delivery and quality assurance for home centers and specialty stores, which supports brand trust and higher attachment rates for assembly services within the Taiwan home furniture market. These moves also complement national priorities around smart manufacturing, since subsidies and technical programs help small and mid-sized firms pilot affordable automation without large upfront capital commitments that would otherwise be a barrier.
Carbon-Negative Domestic Timber Initiatives
Domestic timber programs are progressing with traceability and sustainability aims that can differentiate local products in a field dominated by imports. Taiwan’s Forestry and Nature Conservation Agency promotes the Taiwan Wood Mark with QR-code traceability and carbon-storage labeling, which gives buyers assurance on provenance and supports schools and public institutions that prioritize certified products. The agency reported that domestic timber self-sufficiency remains under 3% as of late 2025, although pilots continue to expand capacity and skills through machinery subsidies and workforce development. For home furniture, certified wood aligns with consumer preferences for natural aesthetics and durability under Taiwan’s humid climate, and it can command premiums where buyers value sustainability and traceable supply. Pilot projects in rural townships and under-forest economy initiatives are building case studies for scalable harvesting and processing, which may create a brand halo for Taiwanese timber in the Taiwan home furniture market. While costs remain higher than imported wood, early adopters can position certified domestic lines as long-life purchases that match design trends and meet institutional procurement needs for verified sources.
Restraints Impact Analysis of Taiwan Home Furniture Market*
| Restraint | (~) % Impact on CAGR Forecast | Geographic Relevance | Impact Timeline |
|---|---|---|---|
| Volatile housing market & high property prices | -0.8% | National; most acute in Northern Taiwan (Taipei, New Taipei City) | Short term (≤ 2 years) |
| Escalating raw-material & labor costs | -1.1% | National manufacturing base; supply-chain dependencies on Japan, China, the United States, EU | Medium term (2–4 years) |
| Strict NTD2,000 (USD 61.06) import-VAT threshold on small parcels | -0.3% | National e-commerce regulation | Short term (≤ 2 years) |
| Ageing woodworking workforce & skills gap | -0.5% | National; manufacturing clusters in Taichung, Tainan, Kaohsiung | Long term (≥ 4 years) |
| Source: Mordor Intelligence | |||
Volatile Housing Market and High Property Prices Constrain Furniture Spend
Tighter mortgage rules reduced loan-to-value ratios to near 60% in 2025, which increased presale cancellations in the six major cities and Hsinchu County and City and signaled a near-term dampener on furniture purchases that typically lag home closings by several quarters. Even as some redevelopment zones in New Taipei posted strong price gains through 2025, the broader cooling path and credit tightening increased caution among first-time buyers, who often defer higher-ticket living room purchases and focus on necessity categories like bedroom and kitchen. Transaction levels guide furniture retail cycles in Taiwan, and the recent cooling creates a timing gap that typically softens demand for non-essentials until financing conditions and sales volumes settle. At the same time, a carbon fee introduced in 2025 can nudge building costs higher in the medium term, which may lift housing prices and compress discretionary budgets despite the steady inflow of new housing stock. Retailers in the Taiwan home furniture market are therefore emphasizing lifetime utility, durability, and service packages that extend product life to defend volumes even when buyers trade down in category priorities.
Escalating Raw-Material and Labor Costs Squeeze Manufacturing Margins
Variations in wood and metal import costs increased cost pressures in 2024 and 2025, while Taiwan’s low domestic timber self-sufficiency keeps the supply chain exposed to currency and freight swings that play through finished furniture pricing. Manufacturing employment in the sector declined between October 2024 and October 2025, which underscores the demographic tightness that limits the local talent pool and raises wage bids for qualified workers. Evidence of high worker recruitment fees paid by migrants raised compliance and reputational risks and pushed some buyers to reimburse sizable amounts that add to near-term cost bases for firms with significant migrant labor. Automation and smart-manufacturing pilots can trim logistics, scrap, and rework costs and help restore margin, yet small firms must navigate upfront capital and capability barriers before benefits materialize at scale. The net effect is a cap on the pace of price reductions in the Taiwan home furniture market, which preserves value for mid-range and premium segments while pushing economy products to focus on service and availability rather than further price cuts.
*Our forecasts treat driver/restraint impacts as directional, not additive. The impact forecasts reflect baseline growth, mix effects, and variable interactions.
Taiwan Home Furniture Market Segment Analysis
By Product Type:
Hybrid Work Amplifies Home Office Demand Amid Living-Room DominanceLiving room and dining room furniture held the largest share at 28.91% in 2025, supported by open-plan layouts in new towers and a preference for sectionals and extendable tables that serve both daily living and hosting needs in the Taiwan home furniture market. The normalization of hybrid work steadily lifted demand for compact desks and ergonomic seating that fit into small rooms without sacrificing posture support or storage, which kept the category visible in showrooms and online. Digital-nomad visas and the establishment of Nvidia’s regional headquarters reinforced this pattern by bringing in professionals who prioritize flexible home-office setups in urban apartments where space is tight. Bedroom furniture benefited from the steady inflow of new housing projects, since storage beds and modular wardrobes help households use vertical space more efficiently in sub-30-ping units. Kitchen furniture purchases also reflect smaller household sizes because compact cabinetry, pull-out pantries, and multi-purpose islands can increase utility without expanding footprint in the Taiwan home furniture market.
Home office is the fastest mover with a 6.31% CAGR through 2031, which places the Taiwan home furniture market size for home office among the most resilient across product categories in the forecast window. On the margin, ergonomic upgrades tied to aging-in-place needs strengthen the case for chairs with lumbar support and height-adjustable desks that reduce fatigue during long work sessions. Bathroom and other categories trail in share but integrate accessibility features that anticipate demographic realities, including grab bars and slip-resistant components that fit compact floor plans. Retailers anchor their displays around multi-function sets and bundle assembly and recycling services, which reduce friction for buyers who lack space and transport options. These shifts keep the Taiwan home furniture market aligned with compact living needs while enabling performance features that once existed only in commercial office settings.

By Material:
Wood Retains Cultural Primacy While Plastic Gains on Budget ConstraintsWood furniture accounted for a 47.23% share in 2025, reflecting durable performance under humid conditions and a cultural preference for natural finishes that age well in the Taiwan home furniture market. The Taiwan Wood Mark provides source traceability and carbon-storage labeling, which supports institutional buyers and households seeking verified origin for major purchases. While local timber self-sufficiency remains low, official programs subsidize machinery and cultivate forestry talent to raise output toward a medium-term target. Certification and storytelling around Taiwanese species can support a premium tier that is selected not only for aesthetic reasons but also for alignment with sustainability goals in the Taiwan home furniture market. Mixed-material designs that combine wood tops with metal frames also remain popular because they deliver a warm look with lower costs than all-wood alternatives.
Plastic and polymer are projected as the fastest-growing materials with a 5.78% CAGR through 2031, driven by value-focused households and outdoor use cases in balconies and small terraces that are common in urban buildings. Lightweight construction and easy maintenance favor plastic pieces for renters who move more often or who prefer to keep budgets flexible, while improved designs expand the range of acceptable spaces for these products. Metal remains important for frames, storage systems, and office furniture, where steel and aluminum inputs create sturdy, long-lasting structures for compact rooms. The material mix also supports sustainability goals through recycled content, where companies present component-level transparency to align with ESG expectations that are rising among buyers and institutions. Over the forecast, most retailers will continue to offer cross-material combinations to balance durability, price, and design flexibility in the Taiwan home furniture market.
By Price Range:
Premium Segment Outpaces Mid-Range as Affluence RisesMid-range dominated with a 45.61% share in 2025, which reflects a large base of households that favor reliable quality and value-enhancing warranties from recognized banners. Home centers and specialty stores position mid-range assortments with clear assembly options and delivery timelines to minimize friction, which helps convert browsing traffic into purchases. In compact homes, mid-range often means a jump in utility rather than pure design, so storage and multi-function features can justify a higher ticket within tight spaces. Policies that attract international professionals and the broader hybrid-work trend provide an audience that balances budget and performance, which aligns with mid-range positioning in the Taiwan home furniture market. Retailers sequence promotions around high-demand seasons and new-home handovers to capture mid-range conversions with bundled services and extended warranties.
Premium is the fastest-growing tier with a 5.94% CAGR to 2031, supported by demand for certified timber, genuine leather, and designer collaborations that carry clear provenance and transparent pricing. Clear price-transparency campaigns and stable showroom experiences attract buyers who see long-lived products as a hedge against replacement cycles in compact homes. Smart sleep and comfort products that integrate sensors and companion apps also draw interest from tech-forward consumers who want measurable improvements in rest quality inside small bedrooms. The premium tier often features made-to-order options with certified materials, which adds lead time but provides differentiation that is hard to match with mass imports in the Taiwan home furniture market. The result is a two-track market where mid-range anchors volume and premium captures shoppers who want provenance and customization as part of the purchase.
By Distribution Channel:
Online Surges While Home Centers Defend Experiential MoatsHome centers led in 2025 with a 37.64% share, reflecting the continued need for sitting, touching, and testing before committing to high-ticket items with delivery and assembly logistics. The format offers whole-home advice, which helps buyers plan rooms and match finishes across living, dining, and bedrooms with fewer errors. Local players continue to refine store footprints that include large suburban boxes and smaller urban formats to meet dense city needs while maintaining enough display space for key categories. Store associates provide configuration guidance, which reduces returns and supports attach rates for assembly, installation, and old-furniture removal services in the Taiwan home furniture market. Demonstrations of multi-function furniture remain a traffic driver because hands-on trials validate claims on stability and ease of use before purchase.
Online is the fastest-growing channel with a 6.82% CAGR to 2031, propelled by 3D room planners, parcel tracking, and mobile payments supported by national targets. Furniture e-commerce reached NTD 30 billion (USD 916 million) in 2024 and 25% of category sales, which shows buyers are comfortable making large purchases online when delivery, assembly, and return policies are clear. Omnichannel options like online-to-store pickup and fast home delivery will keep rising as physical retailers raise their online share of overall retail activity, which reached 31% by late 2024. Specialty stores and flagship concepts add virtual showrooms and appointment bookings for design consultations, which expand reach outside metro cores and support conversions with less friction. The channel mix, therefore, blends tactile confidence from home centers with the convenience of online, which helps the Taiwan home furniture market serve buyers across preferences.
Geography Analysis
Northern Taiwan carried a 35.83% share in 2025, anchored by Taipei and New Taipei City, where density and earnings are highest, and where compact units push demand for multifunctional furniture that fits tight rooms in the Taiwan home furniture market. Renting in central Taipei often requires careful use of vertical storage and convertible pieces that allow a room to serve as both office and bedroom without sacrificing comfort. Redevelopment zones in New Taipei showed strong price movements between 2021 and 2025, which kept attention on premium imported lines and custom cabinetry for households seeking long-life investments that match new finishes. Retailers pilot varied store formats in the North to maximize coverage and convenience, including compact urban stores and curated accessory concepts that target central business district shoppers who want immediate takeaways. Specialty showrooms concentrate in key districts to offer whole-home plan reviews and material selections that allow buyers to line up furniture with renovation timelines in the Taiwan home furniture market.
Southern Taiwan is the fastest-growing region with a 6.21% CAGR to 2031 due to manufacturing-led prosperity, lower living costs, and developing housing corridors that broaden the base for full-home furnishing. Cities like Kaohsiung and Tainan act as distribution and service hubs for the South and host large-format stores that showcase wide assortments and integrated renovation services. Buyers in these cities allocate a higher share of disposable spending to home creation because rent pressure is lower than in Taipei, which supports premium purchases and large dining sets suitable for multigenerational living. Regional showrooms also use in-house design services to help buyers optimize layouts, which is valuable in homes that seek to add storage and function without major construction in the Taiwan home furniture market.
Central Taiwan balances manufacturing strength and rising middle-class demand, with Taichung acting as an innovation center for design-manufacturer partnerships that push new collections into showrooms. The region benefits from proximity to producers of chairs, tables, and office systems, which shortens development cycles for mixed-material pieces and custom variants. Eastern Taiwan maintains a smaller share due to distance and lower density, but hospitality and vacation-home use cases create a niche for resort-style designs that favor natural materials and easy maintenance. Over the forecast period, retailer footprints will continue to reflect this pattern, with more formats in the North for coverage, destination stores in the South for whole-home solutions, and targeted showrooms in Central cities to capture growing household formation in the Taiwan home furniture market.
Regulatory Landscape
Taiwan home furniture sold through retail and online channels falls within the national product safety and standards framework administered by the Bureau of Standards, Metrology and Inspection (BSMI) under the Ministry of Economic Affairs (MOEA). The Commodity Inspection Act provides the basis for commodity inspection and conformity requirements, while the Standards Act governs the creation and maintenance of Chinese National Standards (CNS) through the National Standards Review Council, shaping material, performance, and labeling expectations that affect what furniture SKUs can be imported, stocked, and promoted.
Compliance signaling is often tied to the CNS Mark (Chinese National Standards Mark) managed by BSMI, which supports procurement confidence for institutions and consumers and reinforces quality positioning for branded players. In parallel with these baseline product and standardization rules, sustainability programs facing the market (for example, IKEA Taiwan circularity initiatives) influence buyer expectations on durability, repairability, and responsible sourcing, and they can affect assortment decisions even when they are not codified as mandatory regulation across all furniture categories.
Value Chain Analysis
The Taiwan home furniture value chain begins with upstream raw materials and components (wood, metal, plastics and polymers, fittings, upholstery, and packaging), where low domestic timber self-sufficiency keeps many wood inputs import-reliant and cost-sensitive. Midstream manufacturing includes local producers and OEM/ODM suppliers clustered around industrial hubs, along with importers bringing in finished furniture; automation pilots are being adopted in logistics and repetitive fabrication steps to improve throughput consistency for bulky items.
Downstream, distribution is led by home centers and specialty furniture stores that provide testing, configuration support, and service attachment (delivery, assembly, removal), while online has become structurally important for assortment breadth and conversion at scale, supported by tracking and scheduled installation. Branded and multi-format retailers coordinate sourcing, warehousing, and last-mile operations, and players such as Scan-D (Scanteak, Scan Living) operate both wholesale and retail models. IKEA Taiwan has also pushed circular flows (repair parts availability, reuse and leasing concepts) that add a reverse-logistics layer and differentiate through lifecycle services.
Competitive Landscape
The Taiwan home furniture market in 2025 remains moderately fragmented, with the top five players holding a significant share, leaving opportunities for specialist and sustainability-focused brands. Leading companies such as IKEA Taiwan, Scan-D, Test-Rite’s HOLA and TLW, Nitori Taiwan, and Aurora Corporation dominate the branded tier with robust sourcing and store networks that set industry benchmarks. Private-label strategies within home centers aim to capture higher margins and offer exclusive designs, helping differentiate assortments and maintain pricing credibility in high-volume categories. Omnichannel investments reflect the 2024 increase in online retail share, prompting physical retailers to integrate inventory and logistics to serve customers seamlessly. Sustainability initiatives around certified wood and recycled materials are beginning to define premium offerings, as buyers increasingly demand proof of origin and durability in compact urban homes.
Test-Rite completed a capital increase and announced an IPO to expand its home improvement and furniture chains, strengthening logistics and service capabilities. Oppolia opened a showroom in New Taipei City in late 2024 to target whole-house customization with modular designs across kitchens, living rooms, bedrooms, and bathrooms, catering to dense districts. Aurora introduced circular-economy product lines using recycled PET, coffee-ground boards, and marine-recycled fabrics in August 2025, demonstrating how material innovation can extend product life and support ESG goals. Trade shows planned for 2026 emphasize the combination of craftsmanship and smart manufacturing, aligning with Taiwan’s small-batch customization model while controlling costs and stabilizing quality.
White-space opportunities remain, particularly in certified domestic timber products and AR-assisted showrooms that simplify furniture configuration in small apartments. Circular models that refurbish or resell furniture are gaining traction, responding to consumer interest in extending product life and reducing waste in line with national policy. Growing online penetration pressures local brands to offer fast delivery and transparent returns, making shared logistics and service partnerships attractive for smaller firms. As a result, competitive strategies in 2026 are centered on three key pillars: omnichannel consistency, verified sustainable materials, and service enhancements that simplify the purchase and ownership experience. These approaches allow retailers to cater to compact homes while differentiating through sustainability, convenience, and product quality.
Taiwan Home Furniture Industry Leaders
-
Scan-D Corporation (Scanteak, Scan Living)
-
IKEA Taiwan
-
Test-Rite International Co., Ltd. (HOLA, TLW)
-
Nitori Taiwan Co., Ltd.
-
Aurora Corporation Furniture
- *Disclaimer: Major Players sorted in no particular order

Taiwan Home Furniture Market Companies Covered in this Report
- Scan-D Corporation (Scanteak, Scan Living)
- IKEA Taiwan
- Test-Rite International Co., Ltd. (HOLA, TLW)
- Nitori Taiwan Co., Ltd.
- Aurora Corporation Furniture
- Lifestyle Global Enterprises Inc.
- Huei Tyng Enterprise Co., Ltd.
- PDI Taiwan Office Furniture Co., Ltd.
- Sing Bee Enterprise Co., Ltd.
- FY Group Ltd.
- Formosan United Corporation
- DFI Home Furnishings Taiwan Ltd.
- Stylution Group
- Jiant Furniture Co., Ltd.
- ElegantProducts Co.
- BAUSEN International Co., Ltd.
- HOLA Furnishing (brand chain)
- IKLOO (Huei Tyng brand)
- Woodpecker Furniture Co.
- Pou Yen Enterprise Co., Ltd.
Market Opportunities and Future Outlook
Certified and traceable wood-based premium lines remain a notable whitespace in a market where official programs emphasize provenance and carbon messaging, while domestic supply is still constrained. The Forestry and Nature Conservation Agency promotes the Taiwan Wood Mark with QR-code traceability and carbon-storage labeling, and the program had already placed nearly 8,000 sets of domestically produced school desks and chairs in schools by November 2025 under a reward measure started in June 2025. For home furniture brands and retailers, this institutional pull-through provides a tangible reference point for scaling certified assortments into residential categories where buyers pay for durability, humidity performance, and verified origin.
A second opportunity is circular and service-led business models that reduce replacement cycles and add value beyond the initial sale, particularly in compact urban housing where assembly, maintenance, and removal drive satisfaction. IKEA Taiwan has operationalized circularity through partnerships for consignment and donation (with ESG.STYLE, Tzu Chi Foundation, and Tsuei Ma Ma Foundation) in Taipei and New Taipei City, alongside repair-oriented parts inventory services and B2B furniture leasing collaborations (including Taipei 101 and Taiwan Power Company). These initiatives outline monetization paths around refurbishment, leasing, and lifecycle services that local retailers and home centers can replicate or partner into, especially as online furniture revenue has already demonstrated scale in bulky goods purchasing behavior.
Recent Industry Developments in Taiwan Home Furniture Market
- July 2026: IKEA Taiwan collaborates with Taoyuan City Environmental Protection Bureau to launch the Life Cooling Formula exhibition from July 9 to 15, 2026. The launch expands sustainability themed experiential deployment in a key market. The initiative strengthens brand equity and foot traffic through a government-endorsed energy-saving program.
- June 2026: IKEA Taiwan expands into Tainan, selecting T.S. Mall (Nan Fang Shopping Center) as the location for its first store in the city. The geographic footprint expansion enhances market penetration in a major metro area. The move increases competitive pressure in southern Taiwan.
- March 2026: Test-Rite Retail Co., Ltd. (HOLA) announces that its subsidiary Zhongxin Industrial Co., Ltd. is approved to sublease the right-of-use assets at 948 Minzu 1st Road, Zuoying District, Kaohsiung City, to HOLA Home Furnishings Co., Ltd. The arrangement realigns retail assets for a multi-brand store network. It streamlines Kaohsiung footprint and supports omnichannel store network optimization.
Taiwan Home Furniture Market Report Scope and Research Methodology
Market Definition and Coverage
For this methodology, the market covers furniture bought for home use in Taiwan, measured as revenue generated across offline and online selling channels, and reported in USD.
Scope exclusions: We exclude appliances, home textiles, decorative accessories, and building materials.
Segments Covered in This Report
- By Product
- Living Room & Dining Room Furniture
- Bedroom Furniture
- Kitchen Furniture
- Home Office Furniture
- Bathroom Furniture
- Outdoor Furniture
- Other Furniture
- By Material
- Wood
- Metal
- Plastic & Polymer
- Others
- By Price Range
- Economy
- Mid-Range
- Premium
- By Distribution Channel
- Home Centers
- Specialty Furniture Stores
- Online
- Other Distribution Channels
- By Geography
- Northern Taiwan
- Central Taiwan
- Southern Taiwan
- Eastern Taiwan
- Outlying Islands
Data Sources, Market Sizing, and Validation
Desk Research
Desk research started with public signals that help explain furniture demand and pricing in Taiwan, and then we translated those signals into market value. We focused on sources that can be checked year after year, and we used them to set realistic ranges before assumptions were finalized.
Sources used include Taiwan government statistics (national accounts, household expenditure surveys, CPI components), Taiwan customs import and export tables, UN Comtrade for cross-checking product-level trade codes, OECD macro indicators for consumer spending context, and World Bank indicators for supporting economic series. We also reviewed company filings and investor materials, reputable press coverage, and relevant association websites for channel and category trends. For hard-to-collect company financial details and patent activity related to materials and designs, we used paid databases that support company financials and patent lookups. The sources listed here are illustrative, and many other references were used to collect data, validate findings, and clarify assumptions.
Primary Interviews and Surveys
Our Taiwan fieldwork includes interviews and surveys with furniture manufacturers, retailers, distributors, online channel specialists, and purchasing managers. Respondents help clarify channel sales that are not fully visible in published data, explain price movement and product availability, and test the assumptions used in the final analysis.
Distribution of primary research fieldwork respondents
| Company type | Respondent position |
|---|---|
| Top tier: 30% | CXOs: 18% |
| Mid tier: 50% | Functional/Unit leaders: 32% |
| Smaller Players: 20% | Managers: 50% |
Market-Sizing & Forecasting
Market sizing was built using a top-down approach where household consumption capacity and housing-linked spending patterns were reconstructed into a furniture demand pool, and then allocated into product groups and selling channels. After that, we corroborated totals with selective bottom-up approximations such as sampled ASP bands multiplied by estimated unit movement for key categories, which were then adjusted using retailer and distributor checks.
Inputs that mattered most included household consumption and CPI signals for furniture-related baskets, housing completions and renovation activity as a demand trigger, import volumes and unit values as a proxy for assortment and pricing direction, online penetration trends in home goods retail, and category mix shifts across living, bedroom, kitchen, and home office furniture. Only after outliers were flagged and compared against at least two adjacent indicators did the final growth path get locked in, which reduced the chance of overreacting to short-term noise.
For forecasting, we used scenario analysis supported by exponential smoothing on stable series, and then expert feedback was used to tune turning points tied to housing cycles and sourcing-related price resets. When bottom-up checks were thinner for smaller categories, gaps were handled by applying conservative channel and price-range shares confirmed in interviews, before totals were rebalanced back to the full market.
Data Validation & Update Cycle
Validation was done by triangulating the model outputs across independent signals, and then running anomaly checks so category and channel splits remained realistic over time in Taiwan. If one segment grew much faster than housing activity or import-price movement suggested, assumptions were revisited and follow-up calls were triggered to confirm what changed.
Before sign-off, the model goes through multi-step analyst reviews, and variance checks are completed across years, channels, and price tiers so totals do not drift away from observable indicators. Reports are refreshed annually, with interim updates added when material events shift pricing, sourcing, or demand. Right before delivery, a final refresh pass is performed so clients receive the latest updated view.
Mordor Intelligence's Taiwan Home Furniture Market Sizing Compared With Other Published Estimates
Published market sizes for Taiwan home furniture can differ even when they look close, because the included product basket and the way channels are valued are not consistent across studies. Differences also show up when one estimate leans on trade value signals and another leans more on consumer spending proxies, which leads to different totals.
Some published figures fold in broader home improvement spending, including decor and certain interior fixtures, and that pushes the number up. For Mordor Intelligence, the count is limited to home furniture revenue in Taiwan and adjacent non-furniture home categories are kept out, with annual refresh checks applied to category pricing and channel mix assumptions.
Benchmark comparison
| Source | Market Size | Gaps in Research Methodology |
|---|---|---|
| Mordor Intelligence | USD 1.29 B (2025) | |
| Industry Association A | USD 1.45 B (2025) | Often includes selected home decor and furnishing items alongside furniture, and it can apply a broader home products definition that raises the total value. |
| Trade Journal B | USD 1.18 B (2025) | Commonly relies more on import value and a narrower tracked set of categories, which can undercount locally produced furniture and domestic retail markups not captured in customs values. |
The spread across sources is mostly explained by what is counted as furniture and how trade values are converted into end-market revenue. Our approach keeps the total traceable to practical demand indicators and interview checks, which makes the number easier to reproduce and compare over time.
Key Questions Answered in the Report
What is the current size and growth outlook for the Taiwan home furniture market?
The Taiwan home furniture market size is USD 1.36 billion in 2026 and is projected to reach USD 1.75 billion by 2031 at a 5.17% CAGR.
Which product categories lead, and which are growing fastest in Taiwan’s home space?
Living room and dining room furniture leads with 28.91% share, while the home office is the fastest growing at a 6.31% CAGR through 2031.
How is e-commerce changing furniture buying behavior in Taiwan?
Furniture e-commerce reached NTD30 billion (USD 916 million) in 2024 and 25% of category sales, supported by 3D planners, parcel tracking, and mobile payments.
What materials and price tiers are most preferred by households?
Wood holds a 47.23% share, and plastic and polymer grow at a 5.78% CAGR, while mid-range leads with 45.61% share, and premium grows at 5.94% CAGR.
Which regions account for the most demand and growth?
Northern Taiwan holds a 35.83% share, and Southern Taiwan records the fastest growth at a 6.21% CAGR through 2031.