Market Overview
| Study Period | 2021 - 2031 |
|---|---|
| Forecast Data Period | 2026 - 2031 |
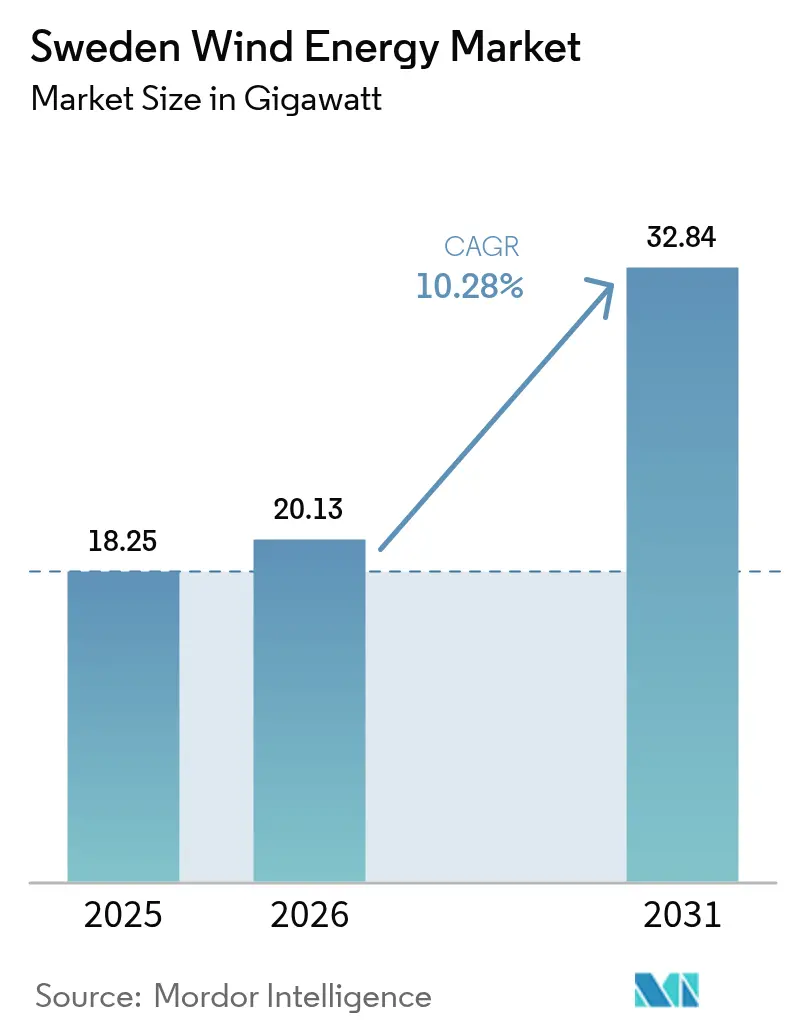
| Base Year Market Size (2025) | 18.25 gigawatt |
| Market Volume (2026) | 20.13 gigawatt |
| Market Volume (2031) | 32.84 gigawatt |
| Growth Rate (2026 - 2031) | 10.28% CAGR |
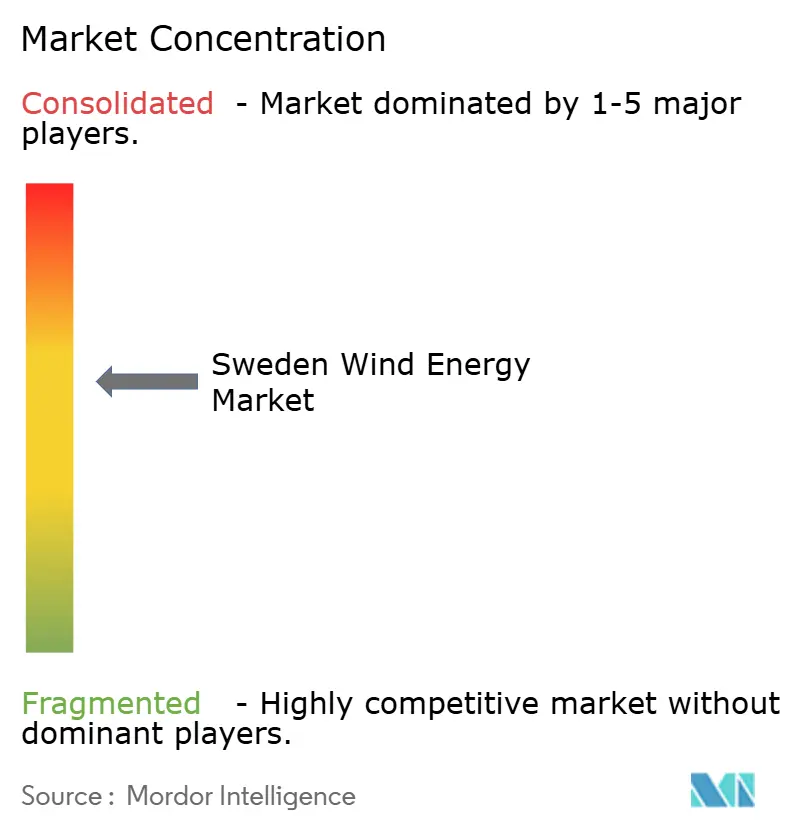
| Market Concentration | Medium |
Major Players *Disclaimer: Major Players sorted in no particular order Image © Mordor Intelligence. Reuse requires attribution under CC BY 4.0. | |
Sweden Wind Energy Market Analysis by Mordor Intelligence
The Sweden Wind Energy market size is expected to grow from 18.25 gigawatt in 2025 to 20.13 gigawatt in 2026 and is forecast to reach 32.84 gigawatt by 2031 at 10.28% CAGR over 2026-2031.
Momentum is anchored in Sweden’s legislated 100% fossil-free generation target, with capital flowing into both onshore repowering programs and Baltic Sea offshore clusters. Onshore additions remain the volume engine, yet offshore projects are scaling rapidly as grid-connection costs are socialized and 15 MW-plus turbines boost capacity factors. Corporate power-purchase agreements tied to data-center expansion and green-hydrogen electrolysis de-risk revenue streams, tightening financing spreads for developers. In parallel, battery storage co-location is emerging as a hedge against curtailment and ancillary-service volatility, improving project economics in grid-constrained northern zones.
Key Report Takeaways
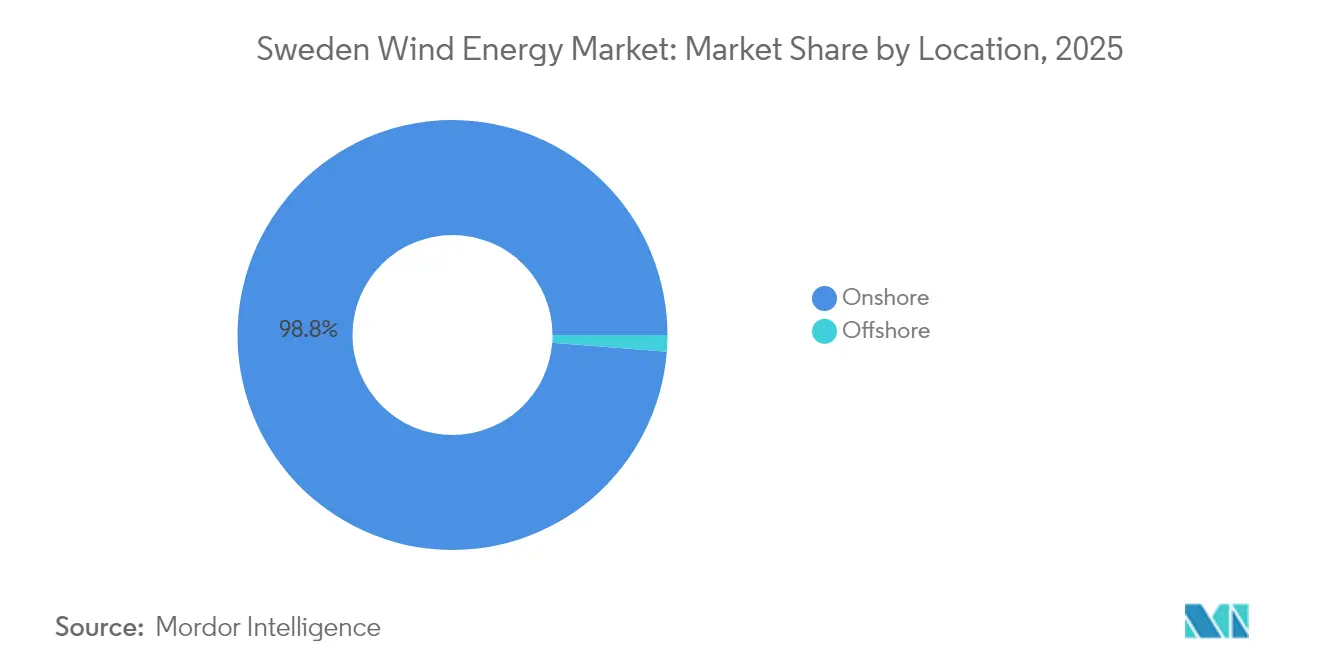
- By location, onshore wind held 98.75% of Sweden's wind energy market share in 2025, while offshore installations are projected to advance at a 42.6% CAGR through 2031.
- By turbine capacity, the 3–6 MW class commanded 48.05% of Sweden wind energy market size in 2025; turbines above 6 MW are forecast to expand at a 15.2% CAGR.
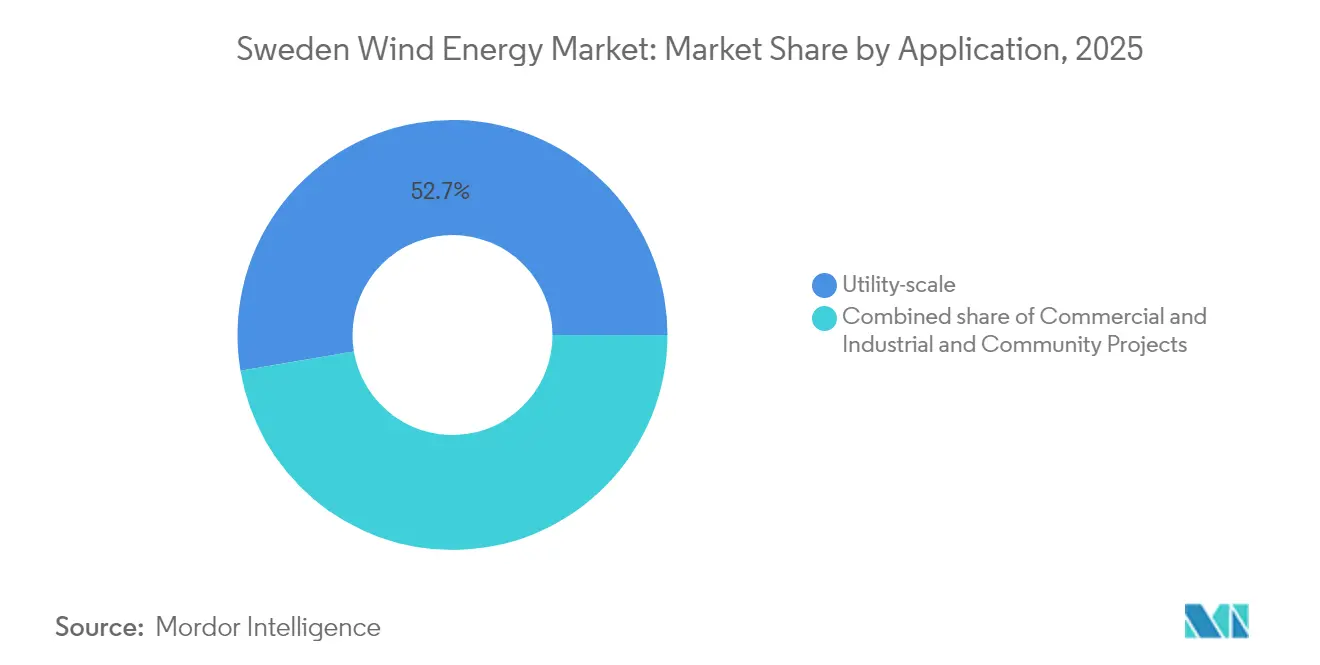
- By application, utility-scale projects accounted for 52.65% of capacity in 2025, whereas commercial and industrial offtakers are accelerating at a 13.1% CAGR.
Note: Market size and forecast figures in this report are generated using Mordor Intelligence’s proprietary estimation framework, updated with the latest available data and insights as of 2026.
Sweden Wind Energy Market Trends and Insights
Drivers Impact Analysis*
| Driver | (~) % Impact on CAGR Forecast | Geographic Relevance | Impact Timeline |
|---|---|---|---|
| Accelerated 100% renewable-electricity target by 2040 | 2.8% | National, with northern municipalities leading capacity additions | Long term (≥ 4 years) |
| Falling LCOE of onshore wind projects | 1.5% | National, concentrated in Norrland and Svealand regions | Medium term (2-4 years) |
| Baltic Sea offshore-grid build-out commitments | 2.2% | Coastal zones in southern and eastern Sweden | Long term (≥ 4 years) |
| Surge in corporate PPAs from data-centres & green-hydrogen projects | 1.9% | National, with data-centre clusters in Stockholm and Luleå | Medium term (2-4 years) |
| Fast-track environmental zoning introduced 2025 | 1.1% | National, early gains in municipalities adopting streamlined processes | Short term (≤ 2 years) |
| Utility-scale battery co-location improving grid stability | 0.9% | Northern production zones (Norrbotten, Västerbotten) | Medium term (2-4 years) |
| Source: Mordor Intelligence | |||
Accelerated 100% Renewable-Electricity Target by 2040
Sweden’s Climate Policy Framework, enacted in 2021, hard-codes a fully renewable power system by 2040, making the target a cornerstone for long-dated infrastructure finance.[1]Government Offices of Sweden, “Sweden’s Climate Policy Framework,” government.se The commitment obliges the grid to add roughly 90 TWh of new clean generation, over 60% of which is expected to come from wind. Lenders view the statute as a safeguard against policy reversal, enabling multi-decade debt tenors for offshore arrays such as the 3.1 GW Neptunus project. The International Energy Agency confirmed in 2024 that Sweden’s pledge is among the most stringent in the OECD, though it warned that 15–20 GW could slide past 2035 if municipal vetoes persist.[2]International Energy Agency, “Energy Policies of IEA Countries: Sweden 2024 Review,” iea.org Industrial electrification is reinforcing urgency; demand from steel and chemical plants alone is projected to rise by 50 TWh before 2035, creating a gap that only large-scale wind and nuclear can realistically bridge.
Falling LCOE of Onshore Wind Projects
Levelized cost of energy for onshore parks in Norrland and Svealand has dropped below EUR 30 per MWh, ranking among the lowest in Europe.[3]Svenska Kraftnät, “Kraftsystemanalys 2024,” svk.se Economies of scale in turbine logistics, higher hub heights, and learning-curve effects from Nordic cold-climate engineering shave capital outlays and boost capacity factors. Developers such as Arise and Eolus exploit modular construction techniques, trimming site work by 20% relative to 2020 baselines. Lower costs improve competitiveness against merchant power prices, allowing projects to close without state subsidies. As repowering accelerates, 5–6 MW turbines replace older 2–3 MW machines on existing foundations, lifting megawatt yield without expanding land footprints, which is politically preferable in regions sensitive to new developments.
Baltic Sea Offshore-Grid Build-Out Commitments
The government's willingness to shoulder part of the offshore grid burden has unlocked final investment decisions for a wave of Baltic Sea projects. Svenska Kraftnät committed in 2024 to extend high-voltage direct-current links to sites such as the 2.1 GW Baltic Offshore Delta North, derisking transmission for sponsors. The policy pivot shifts Sweden closer to the Danish and German model, where shared offshore hubs streamline interconnections. Offshore turbines enjoy 45–50% capacity factors, outpacing onshore averages and stabilizing output profiles critical for industrial offtakers. The European Commission's Joint Research Centre cautions, however, that naval corridors and shipping lanes may delay cable routing, an issue now integrated into early-stage feasibility models.[4]European Commission Joint Research Centre, “Offshore Grid Infrastructure in the Baltic Sea,” ec.europa.eu
Surge in Corporate PPAs from Data Centers & Green Hydrogen
Corporate demand is reshaping revenue structures across the Sweden wind energy market, with hyperscalers' front-loading offtake to lock in stable pricing. Microsoft's 2024 agreement for 500 MW of dedicated capacity to power Stockholm and Gävle facilities exemplifies the trend. Wind-to-hydrogen models follow suit. OX2 and partners are developing a 300 MW electrolyzer at the Marktjärn site, pairing secured wind output with hydrogen sales contracts. These structures compress financing costs by up to 100 basis points as bankers underwrite cash flows from investment-grade counterparts, accelerating project timetables.
Restraints Impact Analysis*
| Restraint | (~) % Impact on CAGR Forecast | Geographic Relevance | Impact Timeline |
|---|---|---|---|
| Lengthy permitting & local opposition | -1.6% | National, acute in municipalities with tourism or reindeer-herding interests | Medium term (2-4 years) |
| Grid congestion in north-to-south transmission corridors | -1.3% | Northern production zones to southern consumption centers | Medium term (2-4 years) |
| Rising day-rate of Nordic offshore-installation vessels | -0.7% | Baltic Sea offshore development zones | Short term (≤ 2 years) |
| Rare-earth dependency risk for direct-drive turbines | -0.5% | National, affecting turbine procurement strategies | Long term (≥ 4 years) |
| Source: Mordor Intelligence | |||
Lengthy Permitting & Local Opposition
Municipal veto power remains a formidable hurdle, blocking or delaying an estimated 20 GW of wind since 2020. In November 2024, the government rejected 13 offshore projects totaling 32 GW on defense grounds, underscoring jurisdictional friction. Onshore parks face pushback from communities concerned about visual impact, noise, and Sami reindeer migration routes. A fast-track zoning scheme introduced in 2025 earmarks priority areas where local discretion is narrowed, cutting approval timelines to 18–24 months. Still, only 15% of land is covered, so most proposals navigate the legacy five-to-seven-year path, increasing carrying costs and sapping developer appetite for speculative site acquisition.
Grid Congestion in North-to-South Transmission Corridors
Seventy percent of generation sits in the north, while major loads cluster in Stockholm, Malmö, and Gothenburg. Transmission deficits on the 1,000-kilometer SE1–SE4 spine forced more than 1 TWh of wind curtailment in 2024, roughly 5% of northern output SVK.SE. Price spreads averaged 20–30% between zones, denting revenue certainty and complicating merchant-exposed financial models. Svenska Kraftnät has allocated SEK 100 billion (USD 9.5 billion) for upgrades, but milestone energization dates begin only in 2028, leaving a multi-year cash-flow gap. Developers are responding with behind-the-meter electrolyzers and data centers to absorb local surpluses, yet these workarounds add complexity and capital cost.
*Our forecasts treat driver/restraint impacts as directional, not additive. The impact forecasts reflect baseline growth, mix effects, and variable interactions.
Segment Analysis
By Location: Offshore Poised for Exponential Expansion
The Sweden wind energy market size was overwhelmingly onshore in 2025, with onshore farms delivering 98.75% of installed capacity. Cost advantages, faster permits, and established logistics corridors anchored this dominance. Northern municipalities with average 8 m/s wind speeds championed new parks, leveraging cooperative landowners and proximity to hydro reservoirs that backstop frequency regulation. Even so, grid bottlenecks and rising local resistance constrain further northbound build, nudging developers toward coastal waters. Offshore arrays in the Baltic Sea carry higher capital intensity, yet they unlock 45–50% capacity factors and larger 15 MW turbines, which compress levelized costs despite deeper foundations. The offshore segment is therefore forecast to run at a 42.6% CAGR to 2031, lifting its Sweden wind energy market share sharply from a low base as multi-gigawatt projects such as Fyrskeppet and Neptunus reach financial close.
Capital inflows mirror this shift. Statkraft, OX2, and Skyborn Renewables have each secured seabed rights exceeding 2 GW per site, underpinning a combined USD 10 billion investment pipeline. Grid-connection socialization reduces developer risk, while export cabling to southern load pockets alleviates price cannibalization seen in the north. Floating-platform pilots covering 18.65 GW position Sweden as a laboratory for deep-water engineering, with Hexicon targeting 50–150 meter depths. Offshore expansion will gradually rebalance the geographic production map, mitigating north-south congestion and aligning renewable generation with industrial demand centers.


By Turbine Capacity: Shift Toward Multi-Megawatt Platforms
Machines in the 3–6 MW class accounted for 48.05% of 2025 installations, reflecting peak onshore build cycles from 2018 to 2023. These turbines, led by Vestas V150 and Siemens Gamesa SG 5.0, provided a cost-effective fit for mid-wind-resource sites. Advances in blade aerodynamics and ice-mitigation coatings sustain their relevance, yet repowering strategies increasingly favor larger rotors on the same pads, raising site yields without elongating payback. Orders for Salsjöhöjden in 2024 featured 62 V162-6.0 MW units optimized for sub-zero resilience.
Above 6 MW, platforms are scaling quickly, buoyed by offshore demand where 15 MW nacelles are standard. The Sweden wind energy market size for this segment is projected to grow at a 15.2% CAGR, aided by reduced balance-of-plant cost per megawatt. Port infrastructure upgrades, including SEK 500 million invested by the Port of Gothenburg, enable handling of 115-meter blades and 1,000-ton nacelles. Supply chains adapt by dedicating rail and roll-on roll-off modules for the oversized cargo, while component suppliers localize cold-weather composites to mitigate thermal stress.
By Application: Industrial Offtakers Accelerate Deployment
Utility-scale projects remained the anchor in 2025, carrying 52.65% of installed capacity and supplying pooled power to Nord Pool markets through Vattenfall and other state-linked entities. Stable credit profiles and access to high-voltage infrastructure underpin large-ticket financing. Yet a vibrant commercial and industrial track is gaining momentum at a 13.1% CAGR as data centers and hydrogen electrolysers seek certainty over Scope 2 emissions. The 15-year, inflation-linked PPA that Microsoft inked in 2024 secures 500 MW of dedicated generation, exemplifying how big-tech appetite catalyzes incremental capacity.
Community wind, while modest at under 5% of new builds, maintains political goodwill. Cooperative share offerings allow citizens to earn dividends, though higher per-megawatt capex and limited access to wholesale lenders cap growth. Future policy tweaks, such as tax credits for locally owned arrays, could lubricate project pipelines, yet no such incentives exist as of 2025. Hybrid business models further blur lines: OX2’s wind-plus-hydrogen facility marries merchant power with industrial gas sales, delivering dual revenue stacks that insulate cash flow against wholesale price swings.
Geography Analysis
Northern regions, Norrbotten, Västerbotten, and Jämtland, host roughly 70% of current wind generation, leveraging large tracts of low-population land and synchronous hydro resources for balancing services. Average capacity factors reach 40% onshore thanks to steady 8 m/s wind speeds, yet curtailment persists when route capacity to the south saturates. Svenska Kraftnät logged more than 1 TWh of cut output in 2024, equal to 5% of northern generation, and price spreads of 20–30% emerged between SE1/SE2 and SE3/SE4 zones.
Southern coastal areas are now prioritized to close the demand-supply gap. Projects such as the 2.8 GW Fyrskeppet farm, approved in April 2025 off Gotland, align output with heavy industrial loads in Gothenburg’s steel, chemical, and automotive clusters. Government cost-sharing on export cabling improves bankability, while proximity to consumption centers dilutes curtailment risk. Municipal behaviors diverge: tourism-centric Dalarna and Värmland often veto new towers, whereas economically challenged northern communities actively court developers with property-tax abatements. Skellefteå, for instance, cleared more than 1 GW of capacity since 2020, positioning itself for a green-hydrogen and battery manufacturing ecosystem.
Deep-water zones in the Baltic carry additional promise, particularly for floating technologies that sidestep fixed-foundation constraints. Sweden’s 18.65 GW floating pipeline sits mainly in 50–150 meter depths, where wind speeds are unchecked by onshore turbulence. Successful deployment would anchor a new export segment for Swedish engineering talent, mirroring Norway’s early role in floating offshore oil platforms. In sum, geographic diversification is steadily rebalancing the Sweden wind energy market, easing north-to-south congestion and aligning renewable output with concentrated industrial demand.
Regulatory Landscape
Sweden’s wind project approvals sit at the intersection of municipal planning decisions under the Planning and Building Act (PBL) and environmental permitting under the Environmental Code (miljobalken), with land and environment courts central to the permit track. For offshore projects in Swedish territorial waters and the economic zone, permitting and consultation steps involve state authorities alongside the government decision process, and defense and maritime-use considerations have recently been decisive (for example, the government rejection of multiple offshore proposals on defense grounds in November 2024).
In 2026, the policy mix further strengthened local acceptance mechanisms. Energimyndigheten advanced municipality-facing economic support for wind power, with SEK 340 million allocated for 2025 and SEK 370 million for 2026, reinforcing incentives for local approvals and planning capacity. The government also moved to mandatory revenue sharing for owners of new wind power plants, giving residents living within nine turbine-heights of a project a right to a portion of annual income. This complements earlier measures such as the 2025 fast-track zoning approach aimed at shortening permitting timelines in designated priority areas.
Competitive Landscape
Market structure varies sharply by segment. Offshore development is moderately consolidated; Vattenfall, OX2, and Statkraft control the largest lease positions and command strong relations with grid and maritime regulators, granting them scheduling advantages for scarce jack-up vessels. Consortium models prevail, OX2 teams with Ingka Investments on the 3.1 GW Neptunus array, spreading capital burden and political risk. High entry costs and multiyear permitting cycles restrict smaller players.
Onshore competition remains fragmented. More than 50 developers operate regionally, with Arise, Eolus, and Rabbalshede Kraft leveraging local stakeholder networks to secure municipal approval for 200–400 MW clusters. Capital intensity is 30–40% lower per MW than offshore, allowing mid-tier balance sheets to participate. The turbine OEM arena is an oligopoly: Vestas and Siemens Gamesa supply most orders, differentiating through cold-climate reliability packages and digital twin analytics that raise availability toward 98%. Nordex and Enercon maintain niche offerings for community and distributed projects but face shrinking order books.
Strategic white spaces revolve around hybridization. Wind-plus-storage and wind-to-hydrogen ventures mitigate curtailment, unlock ancillary-service revenue, and foster co-location with electro-intensive industries. Early movers include Vattenfall, which installed a 20 MW/40 MWh battery at Bruzaholm in 2024 to capture frequency-regulation fees. Floating platforms are another frontier where Swedish innovators such as Hexicon target deep Baltic sites, positioning the market to export design and assembly know-how across Europe once commercial scale is proven.
Sweden Wind Energy Industry Leaders
Vattenfall AB
OX2 AB
Statkraft AS
Arise AB
Eolus Vind AB
- *Disclaimer: Major Players sorted in no particular order

Market Opportunities and Future Outlook
Grid expansion and hybridization create the most actionable whitespace in Sweden’s wind build-out, particularly along the north-to-south corridor that has contributed to curtailment and zonal price spreads. Svenska kraftnat is raising the pace of construction investment, with annual investment expenditure in construction projects increasing from SEK 9 billion in 2025 to SEK 20 billion by 2026 and 2027, and a stated plan to invest SEK 70 billion during 2027-2029. The program includes reinforcement between SE2 and SE3 under the NordSyd program and broader system modernization. This pipeline connects with developer needs for firmer transmission capacity and with offtaker demand in SE3 and SE4, where industrial electrification and corporate procurement structures are shaping bankability.
A second opportunity set is flexibility solutions attached to wind assets, supported by visible project execution and operating learnings. In 2026, hybrid configurations moved from concept to deployment milestones, including Vattenfall’s Bruzaholm commissioning, which paired a 139 MW wind farm with a 38 MW battery system, and OX2’s investment in a 50 MW/209 MWh battery at the Fagerasen site. On the demand side, corporate PPAs and wind-to-hydrogen configurations continue to provide contracting pathways, while the government’s push for local revenue sharing and Energimyndigheten’s municipal support mechanisms add tools to reduce local opposition risk, an identified bottleneck for new onshore and offshore pipelines.
Recent Industry Developments
- July 2026: OX2 invested in a 50 MW/209 MWh battery energy storage system co-located with the Fagerasen wind farm site in Malung-Salen municipality. The investment expands hybrid wind-plus-storage capability, supporting improved dispatchability and adding a flexibility-services revenue stream in a grid-constrained market.
- May 2026: Vattenfall inaugurated the 139 MW Bruzaholm onshore wind farm in Eksjo municipality, built with 21 Siemens Gamesa turbines and complemented by a 38 MW Fluence battery system. The project shows how large developers are pairing wind with storage to manage price volatility, curtailment exposure, and ancillary service needs.
- December 2024: OX2 acquired the Bursjoliden wind farm, expanding its portfolio in northern Sweden. The deal strengthened OX2’s operating base in a region with strong wind resources while developers continue to work around north-south transmission constraints through portfolio optimization and grid-aligned development.


Research Methodology Framework and Report Scope
Market Definition and Coverage
For this study, the Sweden wind energy market is sized as the installed wind power capacity connected to the Swedish grid, expressed in gigawatts, and tracked across new additions and the total operating base.
Scope exclusions: We exclude power trading revenues, grid transmission investments, and non-wind renewable capacity that sits outside wind power plants.
Segmentation Overview
- By Location
- Onshore
- Offshore
- By Turbine Capacity
- Up to 3 MW
- 3 to 6 MW
- Above 6 MW
- By Application
- Utility-scale
- Commercial and Industrial
- Community Projects
- By Component (Qualitative Analysis)
- Nacelle/Turbine
- Blade
- Tower
- Generator and Gearbox
- Balance-of-System
Data Sources, Market Sizing, and Validation
Desk Research
Desk research was used to map the latest capacity totals, annual additions, and the project pipeline, and then to translate that into a consistent installed base series by year. We referenced public power and energy statistics such as those from the Swedish Energy Agency, the national grid operator publications, and international sources such as IEA Wind and IRENA, which helped keep definitions consistent.
To cross-check what is happening on the ground, we also reviewed permitting and grid connection updates, association briefings such as Swedish Wind Energy, and disclosures found in company annual reports and investor presentations. For tougher gaps, such as ownership changes or repowering timelines, we used a paid subscription for company financials and a patents database to understand technology shifts without over-interpreting marketing claims. The sources listed above are illustrative only, and many other public documents and datasets were also used during data collection, validation, and clarification.
Primary Interviews and Surveys
Primary work focused on validating the installed base math and the near-term commissioning outlook, since public project lists can lag real commissioning dates. We spoke with stakeholders across developers, EPC and service firms, turbine and component suppliers, utilities, and financing and advisory participants, and then reconciled inputs across Sweden to remove one-off views.
Where responses differed, we re-checked assumptions on repowering, curtailment risk, and grid queue timing, and then adjusted the annual additions trajectory only after consistent feedback was received across the respondent mix.
Distribution of primary research fieldwork respondents
| Company type | Respondent position | Region |
|---|---|---|
| Top tier: 37% | CXOs: 17% | |
| Mid tier: 44% | Functional/Unit leaders: 26% | |
| Smaller Players: 19% | Managers: 57% |
Market-Sizing & Forecasting
Sizing starts from a top-down reconstruction of Sweden's wind installed base, where national capacity totals and grid-connected additions by year are used to build the historical series and the starting point for the forecast. This is then corroborated with selective bottom-up approximations, such as rolling up a sample of commissioned projects, checking typical turbine nameplate ratings by age, and sanity-checking the pace of repowering and retirements so the end totals stay realistic.
Key model inputs include annual capacity additions, the active and permitted pipeline, grid connection lead times, average turbine size progression (as newer projects tend to use larger machines), and the split between onshore and offshore commissioning expectations. To avoid overstating the market, gaps in project-level visibility were handled through conservative probability weights by stage (permitted, under construction, late-stage development), and those weights were adjusted only when interview feedback pointed to a consistent change in realization rates.
For forecasting, scenario analysis was used because wind build-out in Sweden is sensitive to permitting outcomes, grid availability, and pricing signals, which do not move in a straight line year to year. In practice, we model a base case and then stress it with faster or slower grid connection timing, followed by a final view that is aligned to what most experts described as the most likely commissioning path.
Data Validation & Update Cycle
Outputs are validated through triangulation across independent signals such as official capacity statistics, grid connection announcements, and the implied annual additions needed to reach the projected installed base. When an outlier shows up, for example a year that implies unusually high additions or an abrupt slowdown, the drivers are reviewed, the underlying assumptions are rechecked, and targeted re-contacts are triggered with relevant respondents.
Before sign-off, the model and calculations go through multiple analyst reviews so definition drift and unit issues are caught early. The report is refreshed annually, and interim updates are made when there are material changes such as policy shifts, major permitting reversals, or large project cancellations. Right before delivery, a fresh pass is completed so clients receive the latest updated view.
Mordor Intelligence's Sweden Wind Energy Market Size Compared With Other Published Estimates
Published market sizes for Sweden wind energy often do not match because they are not always measuring the same thing, and the units can look similar at first glance. Differences usually come from whether the estimate is built on installed capacity, project investment value, or yearly spend, and also from how repowering and partially commissioned projects are treated.
The main gap drivers here are scope and timing, where some sources express the market in USD spend or multi-year investment totals, while others report the operating base in GW at year end. Another common split comes from whether the model counts only grid-connected capacity, or includes projects that are permitted or under construction as already in the total, plus currency conversion and inflation handling when USD is used. To keep the comparison practical, we treated the market as installed capacity and anchored year-to-year movement to commissioning and retirements, an approach applied consistently by Mordor Intelligence.
Benchmark comparison
| Source | Market Size | Gaps in Research Methodology |
|---|---|---|
| Mordor Intelligence | USD 18.25 B (2025) | |
| Industry Program Report A | USD 16.80 B (2024) | Expresses the market as net installed capacity at end-2024, which is one year earlier than the baseline and can also differ in whether repowered sites are treated as net-new capacity. |
| Global Publisher B | USD 4.80 B (2026) | Reports a USD value for 2026 that likely reflects yearly spending and services tied to installations, which is not directly comparable to an installed base measured in GW. |
The table shows that the spread is mostly explained by unit choice and timing rather than arithmetic mistakes. Once the same unit is enforced and year alignment is applied, the remaining difference usually comes from how uncertain pipeline capacity is treated before grid connection and how repowering offsets retirements, which makes the final number easier to trace and repeat.


Key Questions Answered in the Report
How large is the Sweden wind energy market in 2026?
Installed capacity reaches 20.13 GW in 2026, and the Sweden wind energy market size is projected to climb to 32.84 GW by 2031.
What is the expected growth rate of Swedish wind power?
Capacity is on course for a 10.28% CAGR between 2026 and 2031, driven by policy targets and corporate power-purchase agreements.
Which segment is growing fastest within Swedish wind?
Offshore wind leads with a 42.6% CAGR through 2031 because of Baltic Sea grid commitments and adoption of 15 MW turbines.
What barriers slow Swedish wind deployment?
Lengthy municipal permitting and north-south grid congestion cut into the pipeline, trimming the forecast CAGR by roughly 3%.
Why are corporate PPAs important for new projects?
Long-term PPAs with data centers and hydrogen plants stabilize cash flow, lower financing costs, and shorten time to financial close.
Which companies dominate Swedish offshore wind?
Vattenfall, OX2, and Statkraft control the largest seabed leases and collectively anchor more than half of the offshore pipeline.
Page last updated on:


