
Structured Finance Market Size and Share
Market Overview
| Study Period | 2020 - 2031 |
|---|---|
| Market Size (2026) | USD 1.96 Trillion |
| Market Size (2031) | USD 2.66 Trillion |
| Growth Rate (2026 - 2031) | 6.30 % |
| Fastest Growing Market | Asia-Pacific |
| Largest Market | North America |
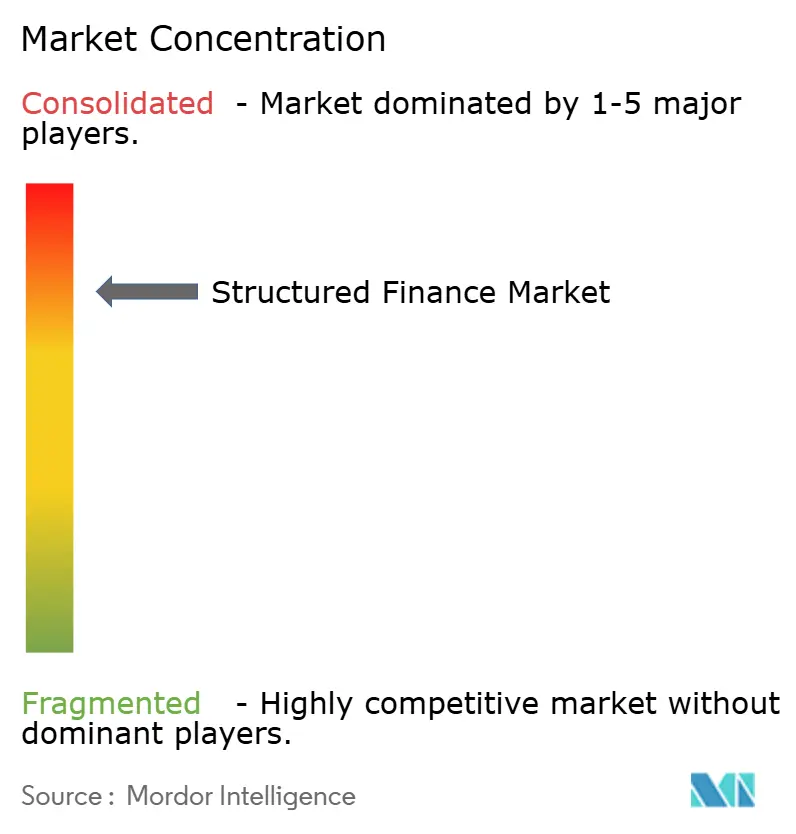
| Market Concentration | High |
Major Players *Disclaimer: Major Players sorted in no particular order Image © Mordor Intelligence. Reuse requires attribution under CC BY 4.0. | |
Structured Finance Market Analysis by Mordor Intelligence
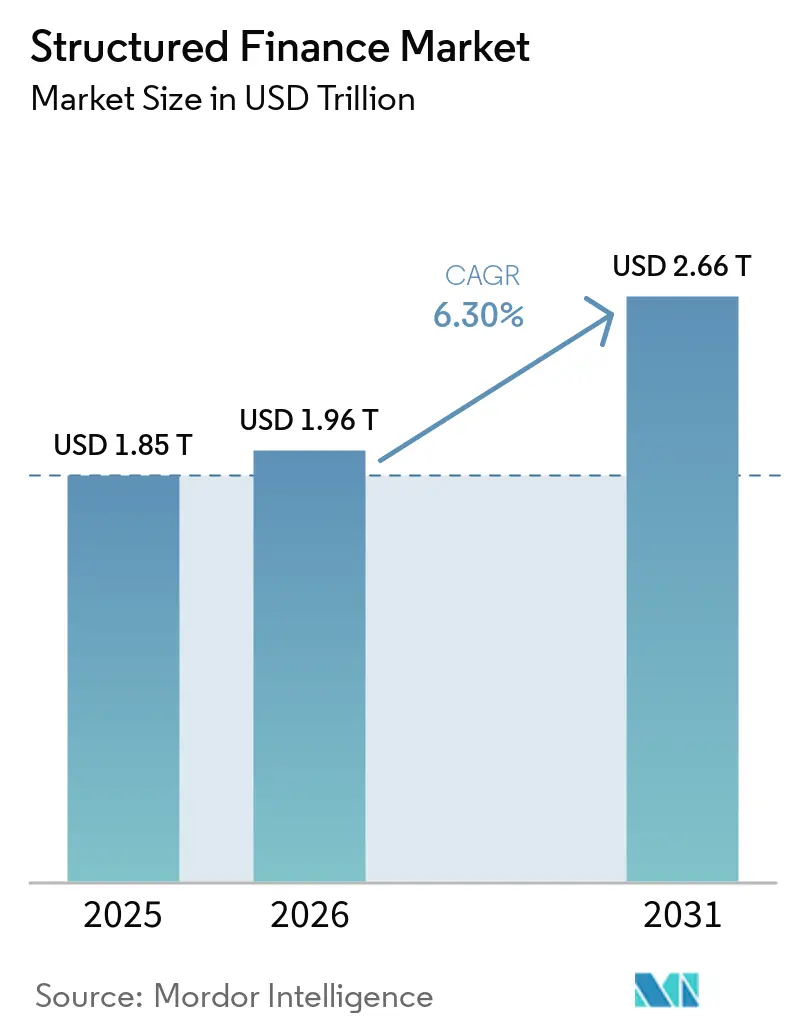
The Structured Finance Market size is expected to increase from USD 1.85 trillion in 2025 to USD 1.96 trillion in 2026 and reach USD 2.66 trillion by 2031, growing at a CAGR of 6.30% over 2026-2031.
The structured finance market is expanding as private credit managers create larger pools of loans that can be financed through securitization. Digital infrastructure is also widening the asset base, particularly for data centers, fiber networks, and communications towers. Moody’s projected that global private credit assets under management will exceed USD 2 trillion in 2026 and approach USD 4 trillion by 2030, providing a growing collateral base for the USD 1.96 trillion structured finance market in 2026. The market is moving beyond its traditional mortgage focus, although mortgage-backed securities remain central to issuance and liquidity. Regulatory rules, uneven collateral performance, and limited data for newer assets continue to shape how issuers, investors, and rating agencies assess transactions.
Key Report Takeaways
- By security type, mortgage-backed securities captured 48.12% of the structured finance market share in 2025, while Collateralized Loan Obligations (CLOs) are projected to grow at an 9.19% CAGR through 2031.
- By underlying asset class, residential mortgages held 42.32% of the structured finance market size in 2025, while specialty and esoteric assets are forecast to grow at a 10.72% CAGR through 2031.
- By issuer type, government, agency, and government-sponsored issuers accounted for 42.63% of the structured finance market share in 2025, while non-bank financial institutions and specialty lenders are projected to grow at an 9.78% CAGR through 2031.
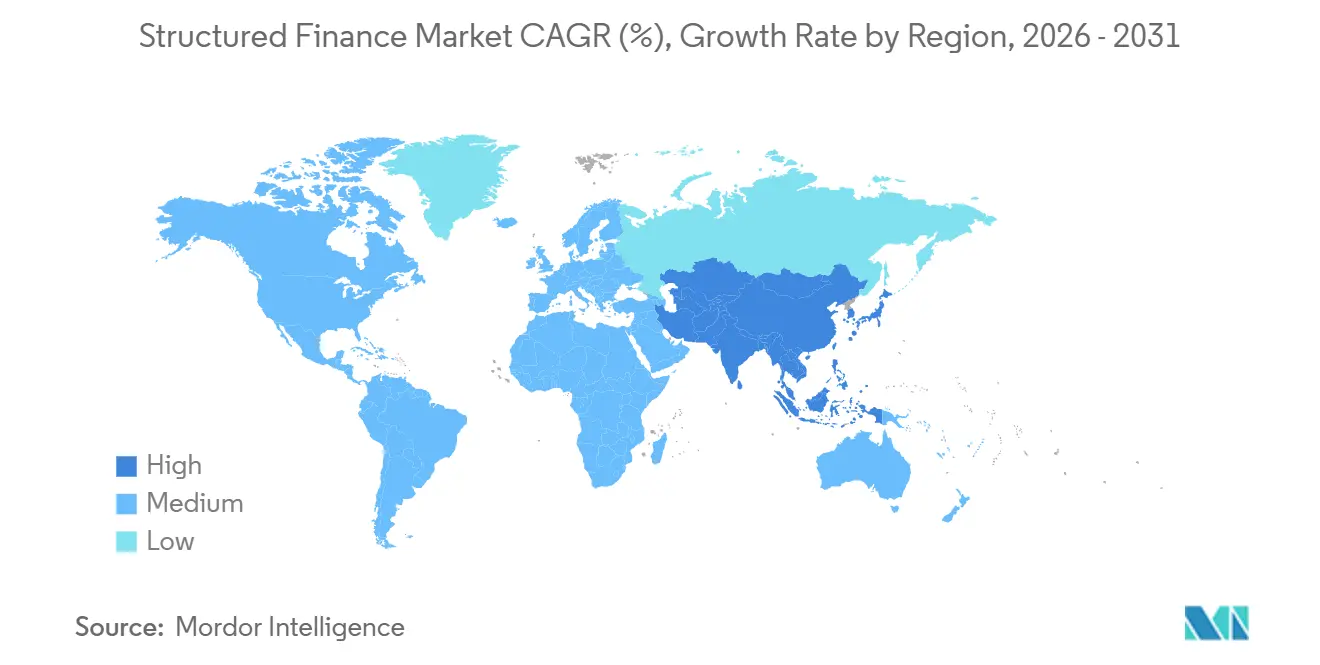
- By geography, North America accounted for 68.87% of the structured finance market share in 2025, while Asia-Pacific is projected to grow at a 8.82% CAGR through 2031.
Note: Market size and forecast figures in this report are generated using Mordor Intelligence’s proprietary estimation framework, updated with the latest available data and insights as of January 2026.
Market Trends and Insights
Drivers Impact Analysis of Structured Finance Market*
| Driver | (~) % Impact on CAGR Forecast | Geographic Relevance | Impact Timeline |
|---|---|---|---|
| Private Credit And Non-Bank Lending Expanding Collateral Pools | +1.5% | Global, with the strongest activity in North America and expanding activity in Europe, the Middle East, and Africa and Asia-Pacific | Medium term (2-4 years) |
| Institutional Demand For Risk-Adjusted Yield And Diversification | +1.2% | Global, with insurance capital most active in North America and the European Union | Medium term (2-4 years) |
| Digital Infrastructure And Technology-Linked Assets | +1% | North America is primary, Europe is secondary, and Asia-Pacific is early stage | Short term (≤ 2 years) |
| CLO Refinancing And Reset Cycles | +0.8% | North America and Europe | Short term (≤ 2 years) |
| Specialty And Esoteric Assets Broadening Collateral | +0.7% | North America is primary and Asia-Pacific is emerging | Long term (≥ 4 years) |
| Transparency And Standardization Supporting Participation | +0.5% | Global, with regulatory influence most visible in the European Union and United Kingdom | Medium term (2-4 years) |
| Source: Mordor Intelligence | |||
Expansion of Private Credit and Non-Bank Lending Creating New Securitizable Collateral Pools
Private credit represents a major source of new collateral for the structured finance market. Direct lending, asset-based finance, and fund finance generate loan pools that managers can securitize through private credit CLOs and warehouse structures. These structures enable capital recycling and support additional origination across consumer credit, digital infrastructure credit, and health care receivables. The Financial Stability Board reported in May 2026 that private credit CLOs have grown materially and that banks provide up to 90% of commitments to business development companies through credit lines[1]. This interconnectedness can transmit credit stress more rapidly than headline private credit asset values may indicate. The expanding range of private credit assets also provides the structured finance market with additional issuance channels when spreads tighten in established collateral classes.
Institutional Demand for Higher Risk-Adjusted Yield and Portfolio Diversification
Insurers, pension funds, and sovereign wealth funds are increasing allocations to structured credit to seek yield without taking equivalent duration risk. Janus Henderson stated that 65% of a typical securitized transaction carries a AAA rating, which supports demand from regulated insurers[2]. Senior tranches can offer short-duration exposure that aligns with solvency capital management. Demand for those tranches can push other investors toward mezzanine and equity positions. This can concentrate risk among investors that face fewer solvency constraints and may respond differently during market stress. Canyon ABF Partners launched in June 2026 with permanent insurance capital anchors, showing how alternative managers are building insurance-supported origination platforms[3].
Growth in Digital Infrastructure and Technology-Linked Assets Expanding Structured Financing Opportunities
Digital infrastructure is creating a distinct growth channel for the structured finance market. Combined ABS and CMBS issuance by data center operators reached USD 26 billion in 2025, more than 10 times the 2020 volume. Annual issuance is projected at USD 40 billion to USD 50 billion in 2026 and could represent up to 10% of total United States ABS issuance[4]. The SEC Office of Structured Finance confirmed on July 29, 2026, that securities from certain data center securitizations fall outside the asset-backed security definition in Section 3(a)(79) of the Securities Exchange Act. The guidance removes mandatory risk-retention and Regulation AB disclosure obligations for the covered structures. NVIDIA’s August 2026 partnerships with Apollo, BlackRock, Blackstone, Brookfield, Goldman Sachs, and KKR aim to mobilize more than USD 500 billion for AI infrastructure, reinforcing the financing demand behind this asset category.
CLO Refinancing and Reset Cycles Increasing Structured Finance Transaction Activity
CLO refinancing and reset activity can maintain transaction volumes in the structured finance market even when new loan origination slows. United States CLO issuance, including new deals and refinancings, exceeded USD 200 billion in 2024. A large group of 2023-vintage transactions approaches its non-call period during 2026 and 2027, which creates a pipeline of potential refinancings. The floating-rate structure of CLO liabilities and leveraged loans can limit exposure to interest rate volatility. This structure has supported investor demand even as fixed-income valuations changed. Specialty and esoteric assets also expand the collateral universe over a longer period, while clearer reporting and common transaction standards can support broader investor participation in the structured finance market.
Restraints Impact Analysis of Structured Finance Market*
| Restraint | (~) % Impact on CAGR Forecast | Geographic Relevance | Impact Timeline |
|---|---|---|---|
| Regulatory, Capital, And Disclosure Requirements | -1.2% | Global, with the European Union, United Kingdom, and United States most affected | Medium term (2-4 years) |
| Divergent Collateral Performance And Tranche Loss Uncertainty | -0.8% | Global, with commercial real estate stress most acute in North America and auto ABS pressure in Japan | Short term (≤ 2 years) |
| Limited Data And Transparency For Specialized Assets | -0.6% | Global, especially for digital infrastructure, data ABS, and ESG-linked structures | Long term (≥ 4 years) |
| Structural And Execution Complexity In Bespoke Transactions | -0.5% | North America and Europe | Medium term (2-4 years) |
| Source: Mordor Intelligence | |||
Regulatory, Capital and Disclosure Requirements Increasing Transaction Structuring Costs
Regulatory requirements are increasing across the main structured finance jurisdictions. EU Regulation 2024/3172 became effective on January 1, 2025, and established Basel III-aligned disclosure templates for capital adequacy, credit risk, market risk, and ESG exposures. SEC Rule 192 applies to covered ABS transactions closing from June 9, 2025, and prohibits material conflicts of interest. The SEC also published a September 2025 concept release on potential changes to asset-level disclosures for residential mortgage-backed securities. These requirements can raise compliance costs for first-time issuers and platforms using nontraditional collateral. Limited historical data for digital infrastructure, data ABS, and ESG-linked structures adds to this burden because investors require more detailed analysis before providing capital to the structured finance market.
Divergent Collateral Performance Increasing Credit and Tranche Loss Uncertainty
Collateral performance differs widely across asset types and regions, which increases uncertainty for investors in the structured finance market. United States commercial real estate delinquency rates remained elevated, while Japanese auto ABS performance softened in late 2025 under continued inflation pressure. Private credit CLO equity tranches typically represent 25% to 30% of deal size, compared with 10% to 12% for broadly syndicated CLOs. These tranches absorb initial losses and reflect the higher-risk profile of middle-market collateral. Investors, therefore, need pool-level diligence rather than sole reliance on senior tranche ratings. Synthetic, hybrid, and bespoke transactions can further increase execution complexity, especially when the collateral or legal structure has limited precedent.
*Our forecasts treat driver/restraint impacts as directional, not additive. The impact forecasts reflect baseline growth, mix effects, and variable interactions.
Structured Finance Market Segment Analysis
By Security Type:
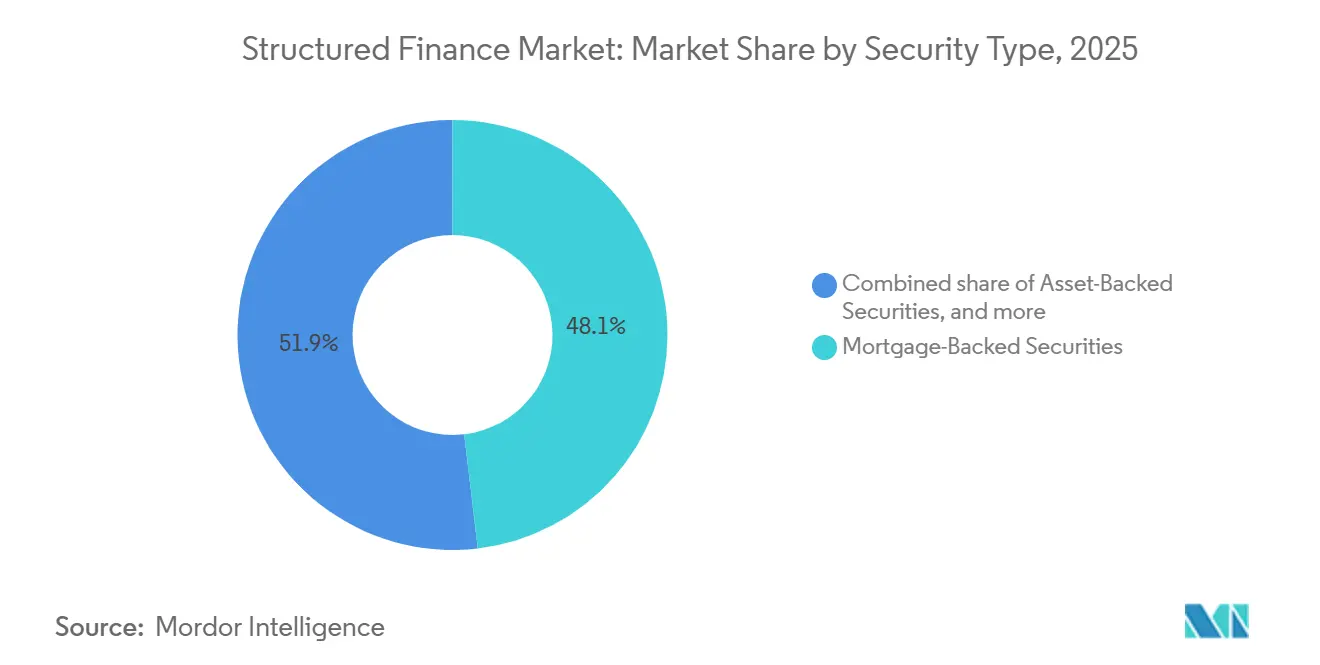
Agency MBS Anchors Market While CLOs Define the Growth FrontierMortgage-backed securities captured 48.12% of the structured finance market share in 2025, supported by the United States government-sponsored enterprise infrastructure and comparable government-backed programs in Europe and Japan. These programs provide established issuance channels, deep investor participation, and consistent pricing references. The Federal Housing Finance Agency directed Fannie Mae and Freddie Mac to purchase up to USD 200 billion in agency MBS in 2026, which compressed spreads and encouraged non-agency originators to pursue differentiated structures. United States ABS issuance reached USD 137 billion in the first half of 2026, up 22% year over year, while CMBS issuance reached USD 99 billion, up 33%, led by digital infrastructure and non-GSE loan types. The structured finance industry continues to rely on agency MBS for scale and liquidity.
CLOs are projected to grow at an 9.19% CAGR from 2026 to 2031, making them the fastest-growing security type. Private credit managers use rated CLO structures to distribute direct lending exposure to a broader institutional investor base. CDOs, hybrid structures, and other security types continue to serve narrower requirements for bespoke credit exposures and balance-sheet risk management. CVC Credit priced its USD 550 million Apidos LVIII CLO in 2026, while Canyon Partners managed USD 13 billion in CLO assets by mid-2026. Proposed changes to the European Union and United Kingdom securitization frameworks could reduce reporting requirements and lower structuring costs.
By Underlying Asset Class:
Esoteric Assets Redefine What Can Be SecuritizedResidential mortgages held 42.32% of the structured finance market size in 2025 because origination systems and investor familiarity remain well established across North America, Europe, and parts of Asia-Pacific. Commercial mortgages, consumer loans, credit card receivables, auto loans, corporate and leveraged loans, and trade receivables also support established issuance programs. Goldman Sachs Mortgage Company remained active in 2026 with USD 305 million of closed-end second-lien mortgages in GSMBS 2026-CES2 and USD 301.8 million of debt-service coverage ratio rental property mortgages in GSMBS 2026-DSC1. These transactions show that residential mortgage collateral includes more than conventional owner-occupied lending. The large mortgage base still provides a reference point for pricing and structural design across the structured finance market.
Specialty and esoteric assets are projected to grow at a 10.72% CAGR from 2026 to 2031, the highest rate among underlying asset classes. This category includes digital infrastructure cash flows, music royalties, aviation loans, data asset receivables, and microfinance pools. HALO AirFinance priced a USD 390.2 million inaugural aviation loan ABS in August 2026, and the transaction was more than four times oversubscribed. China recorded more than 60 data asset ABS applications at the Shanghai and Shenzhen exchanges, with declared issuance exceeding CNY 129.3 billion, equivalent to USD 17.8 billion, by mid-2026. These assets expand the securitizable universe and require new rating practices and legal precedents in each jurisdiction.
By Issuer Type:
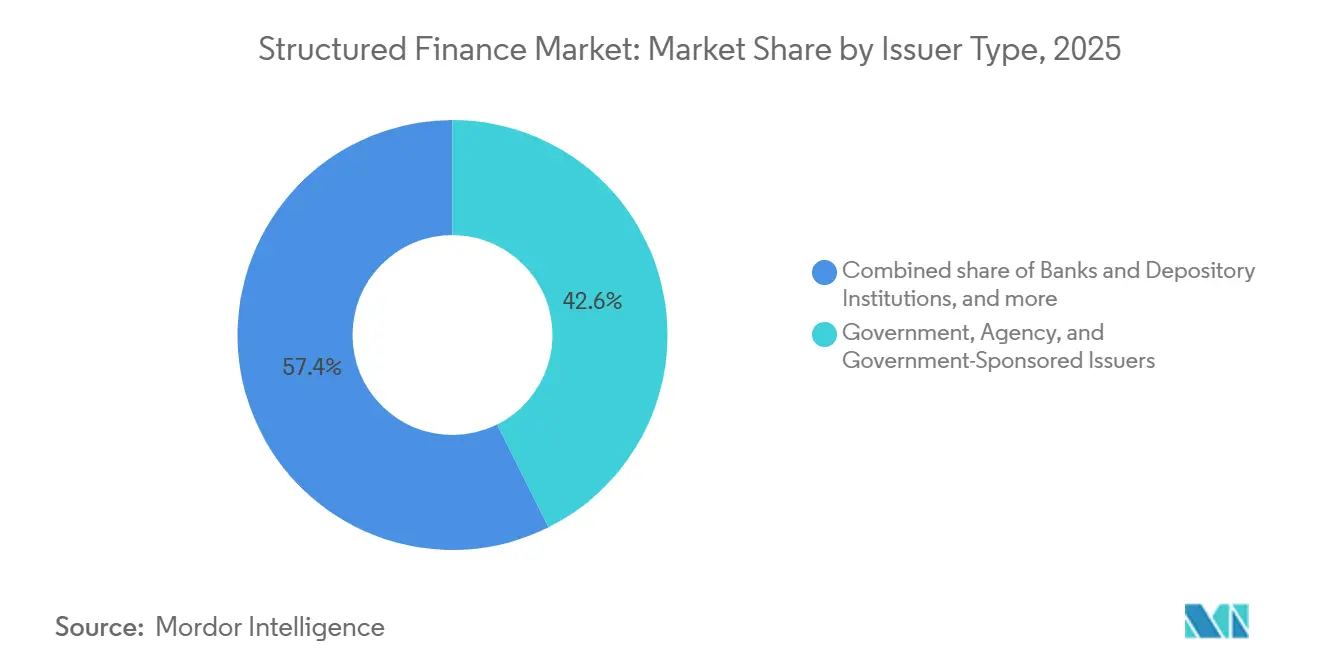
Non-Bank Platforms Gain Share as Private Capital Reshapes OriginationGovernment, agency, and government-sponsored issuers accounted for 42.63% of the structured finance market share in 2025. Their sovereign credit support can reduce funding costs and establish pricing benchmarks for other issuers. Banks and depository institutions remain active in credit card, auto, and equipment ABS. JPMorgan Chase completed USD 1.5 billion of credit card ABS in July 2025, and USD 1.25 billion in June 2026, with each transaction rated AAA by Fitch and S&P. Corporate and captive finance issuers support auto ABS and trade receivables, while other issuers address niche and government-adjacent structures.
Non-bank financial institutions and specialty lenders are projected to grow at a 9.78% CAGR from 2026 to 2031. Apollo completed a USD 1.765 billion ABS for Concord in July 2025 that was more than three times oversubscribed. Canyon ABF Partners targets more than USD 5 billion in annual originations across residential, consumer, equipment, and specialty assets. Government-related issuers retain scale, but non-bank platforms are building greater capacity to originate, structure, and distribute specialized transactions. This shift increases the importance of proprietary investor access and underwriting capabilities as the structured finance market size expands.
Geography Analysis
North America Structured Finance Market
North America accounted for 68.87% of the global structured finance market share in 2025, supported by the deepest MBS and CLO infrastructure. United States issuance in the first half of 2026 included USD 137 billion of ABS, USD 99 billion of CMBS, and USD 82 billion of RMBS, with year-over-year increases of 22%, 33%, and 22%, respectively. Canada contributes through active RMBS and CLO origination, while Mexico is developing through non-bank financial institution-led consumer ABS. The USD 200 billion agency MBS purchase backstop can narrow senior spreads and encourage non-agency issuers to develop more complex products. SEC guidance on data center securitizations established a separate United States origination channel that could change the issuance mix by 2027.
APAC Structured Finance Market
Asia-Pacific is projected to grow at an 8.82% CAGR from 2026 to 2031, making it the fastest-growing region in the structured finance market. China issued CNY 2.28 trillion (USD 317 billion) of ABS in 2025, up 15.3% year over year. Issuance reached CNY 1.165 trillion (USD 161 billion) in the first half of 2026, an additional 19% year-over-year increase. India, Japan, and Southeast Asia have distinct sources of expansion in securitization activity. India’s GIFT City reforms and China’s 15th Five-Year Plan commitment to normalize REIT issuance are strengthening the region’s market infrastructure.
EMEA and South America Structured Finance Market
Europe recorded securitization issuance of EUR 275 billion (USD 323.48 billion) in 2025, matching the post-global financial crisis high reported for 2021. Issuance was forecast to increase 4.4% to EUR 287 billion (USD 316 billion) in 2026, led by United Kingdom RMBS, renewables-linked securitizations, and data center CMBS. European Union and United Kingdom frameworks remain under review, with proposed changes intended to reduce reporting obligations and clarify risk-retention definitions. South America is centered on Brazil’s FIDC credit-rights fund activity and selected consumer ABS. At the same time, the Middle East and Africa rely mainly on sovereign-backed infrastructure ABS in Saudi Arabia and the United Arab Emirates.
Competitive Landscape
The structured finance market has a two-tier competitive structure led in underwriting and warehousing by global investment banks, including JPMorgan Chase, Goldman Sachs, Barclays, BNP Paribas, and Deutsche Bank. Alternative managers, including Apollo, Blackstone, and KKR, compete through origination, structuring, and proprietary investor access. Apollo formalized trading and syndication arrangements with JPMorgan Chase and Goldman Sachs in May 2025 to distribute investment-grade private credit through institutional channels, blurring the distinction between alternative asset management and traditional investment banking. Compliance with the European Union Securitization Regulation and SEC Rule 192 favors established platforms with extensive legal, compliance, and distribution resources. These conditions reinforce the position of platforms that combine origination, execution, and investor access.
Smaller regional and mid-market structures in the structured finance market remain an opportunity where large banks may not pursue lower-value transactions. Castlelake priced a USD 261.3 million inaugural residential transition loan RMBS in August 2026, marking its entry into the non-agency RMBS market. Gordon Brothers completed a USD 265 million inaugural commercial equipment ABS within 13 months of launch, showing continued activity among first-time issuers. NVIDIA’s financing partnerships with 6 alternative asset managers and investment banks show a further link between technology infrastructure, private credit, and structured financing. The strategic opportunity differs by region because regulatory clarity, investor relationships, and collateral availability are not uniform.
India, Japan, and Europe offer potential for early entrants as their regulatory settings develop. India’s GIFT City reforms, Japan’s changing interest-rate environment, and Europe’s regulatory review affect issuer and investor participation. Managers who establish origination and investor relationships early may gain an advantage in these locations. The structured finance market remains concentrated among large underwriting and alternative management platforms, while specialized issuers compete through transaction design and asset access.
Structured Finance Industry Leaders
-
JPMorgan Chase and Co.
-
Goldman Sachs Group Inc.
-
Citigroup Inc.
-
Bank of America Corporation
-
Morgan Stanley
- *Disclaimer: Major Players sorted in no particular order
Structured Finance Market Companies Covered in this Report
- JPMorgan Chase & Co.
- Bank of America Corporation
- Citigroup Inc.
- Goldman Sachs Group, Inc.
- Morgan Stanley
- Barclays PLC
- Deutsche Bank AG
- BNP Paribas S.A.
- Wells Fargo & Company
- HSBC Holdings plc
- Société Générale S.A.
- Crédit Agricole S.A.
- Mizuho Financial Group, Inc.
- Jefferies Financial Group Inc.
- UBS Group AG
- Nomura Holdings, Inc.
- Royal Bank of Canada
- TD Bank Group
- Blackstone Inc.
- Apollo Global Management, Inc.
Recent Industry Developments in Structured Finance Market
- August 2026: NVIDIA announced partnerships with Apollo, BlackRock, Blackstone, Brookfield, Goldman Sachs, and KKR to mobilize over USD 500 billion for AI infrastructure, establishing compute-financing platforms at a global scale and creating a new category of technology-linked structured credit.
- August 2026: HALO AirFinance, GA Telesis, and Tokyo Century Corporation, priced HALOAN 2026-1, a USD 390.2 million inaugural aviation loan ABS, more than 4 times oversubscribed and achieving the tightest spread for an AA-rated senior tranche from a first-time aviation loan ABS issuer.
- August 2026: Castlelake priced CLRES 2026-RTL1, a USD 261.3 million residential transition loan RMBS, making its first entry into the non-agency RMBS market.
- June 2026: Canyon Partners launched Canyon ABF Partners with Daiichi Life Insurance and Korea Investment Holdings as anchor investors, targeting more than USD 5 billion in annual origination across residential, consumer, equipment, transport, and specialty assets.
Global Structured Finance Market Report Scope
Segmentation Overview
| Asset-Backed Securities |
| Mortgage-Backed Securities |
| Collateralized Loan Obligations (CLOs) / Structured Credit |
| Other Security Types |
| Residential Mortgages |
| Commercial Mortgages and Commercial Real Estate Loans |
| Consumer Loans and Credit Card Receivables |
| Auto Loans and Leases |
| Corporate and Leveraged Loans |
| Trade Receivables |
| Other Specialty and Esoteric Assets |
| Banks and Depository Institutions |
| Non-Bank Financial Institutions and Specialty Lenders |
| Corporate and Captive Finance Issuers |
| Government, Agency, and Government-Sponsored Issuers |
| Other Issuer Types |
| North America | United States |
| Canada | |
| Mexico | |
| South America | Brazil |
| Argentina | |
| Rest of South America | |
| Europe | United Kingdom |
| Germany | |
| France | |
| Italy | |
| Spain | |
| Rest of Europe | |
| Asia-Pacific | China |
| Japan | |
| India | |
| South Korea | |
| Australia | |
| Indonesia | |
| Thailand | |
| Malaysia | |
| Singapore | |
| Vietnam | |
| Rest of Asia-Pacific | |
| Middle East and Africa | Saudi Arabia |
| United Arab Emirates | |
| Turkey | |
| South Africa | |
| Egypt | |
| Rest of Middle East and Africa |
| By Security Type | Asset-Backed Securities | |
| Mortgage-Backed Securities | ||
| Collateralized Loan Obligations (CLOs) / Structured Credit | ||
| Other Security Types | ||
| By Underlying Asset Class | Residential Mortgages | |
| Commercial Mortgages and Commercial Real Estate Loans | ||
| Consumer Loans and Credit Card Receivables | ||
| Auto Loans and Leases | ||
| Corporate and Leveraged Loans | ||
| Trade Receivables | ||
| Other Specialty and Esoteric Assets | ||
| By Issuer Type | Banks and Depository Institutions | |
| Non-Bank Financial Institutions and Specialty Lenders | ||
| Corporate and Captive Finance Issuers | ||
| Government, Agency, and Government-Sponsored Issuers | ||
| Other Issuer Types | ||
| By Geography | North America | United States |
| Canada | ||
| Mexico | ||
| South America | Brazil | |
| Argentina | ||
| Rest of South America | ||
| Europe | United Kingdom | |
| Germany | ||
| France | ||
| Italy | ||
| Spain | ||
| Rest of Europe | ||
| Asia-Pacific | China | |
| Japan | ||
| India | ||
| South Korea | ||
| Australia | ||
| Indonesia | ||
| Thailand | ||
| Malaysia | ||
| Singapore | ||
| Vietnam | ||
| Rest of Asia-Pacific | ||
| Middle East and Africa | Saudi Arabia | |
| United Arab Emirates | ||
| Turkey | ||
| South Africa | ||
| Egypt | ||
| Rest of Middle East and Africa | ||
Key Questions Answered in the Report
What is the projected value of structured finance by 2031?
The structured finance market is forecast to reach USD 2.66 trillion by 2031, growing at a 6.3% CAGR from 2026.
Which security type is growing fastest in structured finance?
CLOs are projected to grow at an 9.19% CAGR between 2026 and 2031, supported by private credit securitization.
Which underlying assets are expanding fastest?
Specialty and esoteric assets are forecast to grow at a 10.72% CAGR, supported by digital infrastructure, music royalties, aviation loans, data assets, and microfinance pools.
Why are data centers important for securitization?
Data center ABS and CMBS issuance reached USD 26 billion in 2025, and the SEC provided guidance for certain data center securitizations in July 2026.
Which region will grow fastest through 2031?
Asia-Pacific is projected to grow at an 8.82% CAGR from 2026 to 2031, led by activity in China, India, Japan, and Southeast Asia.
What are the main risks for structured credit investors?
Key risks include tighter disclosure and capital requirements, uneven collateral performance, limited data for new assets, and complex bespoke structures.