Steam Turbine Market Size and Share
Market Overview
| Study Period | 2021 - 2031 |
|---|---|
| Market Size (2026) | USD 19.33 Billion |
| Market Size (2031) | USD 22.48 Billion |
| Growth Rate (2026 - 2031) | 3.07% CAGR |
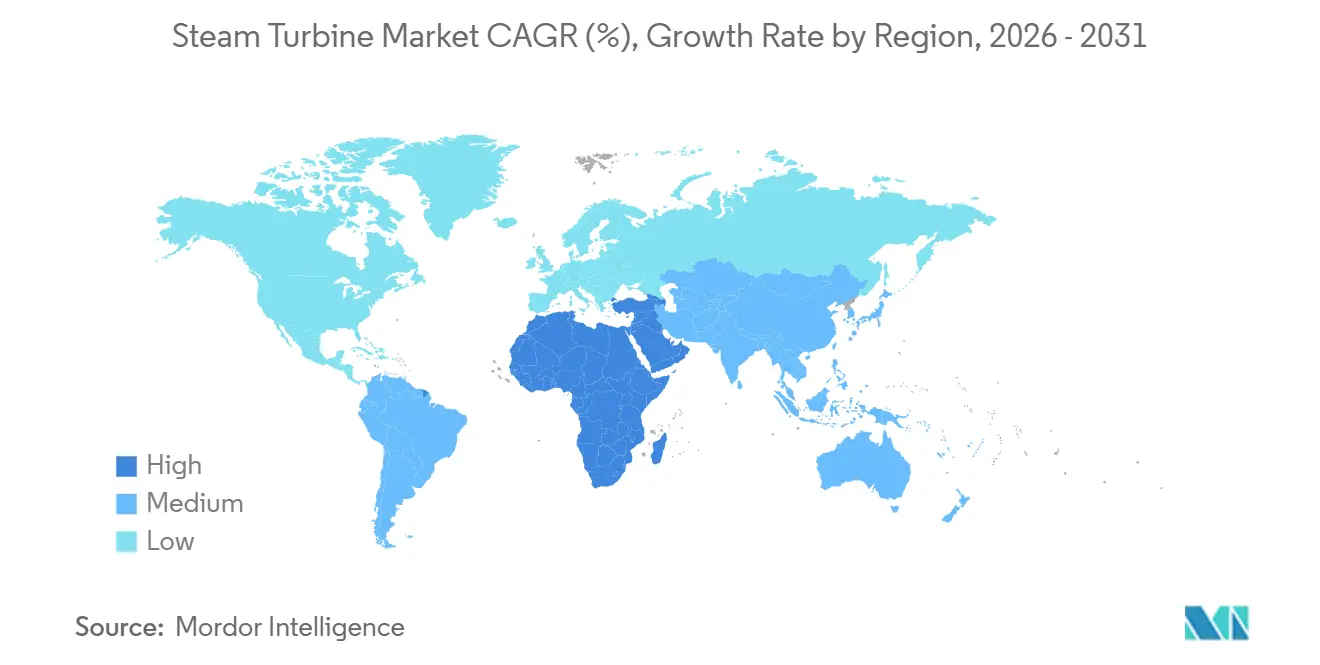
| Fastest Growing Market | Middle East and Africa |
| Largest Market | Asia-Pacific |
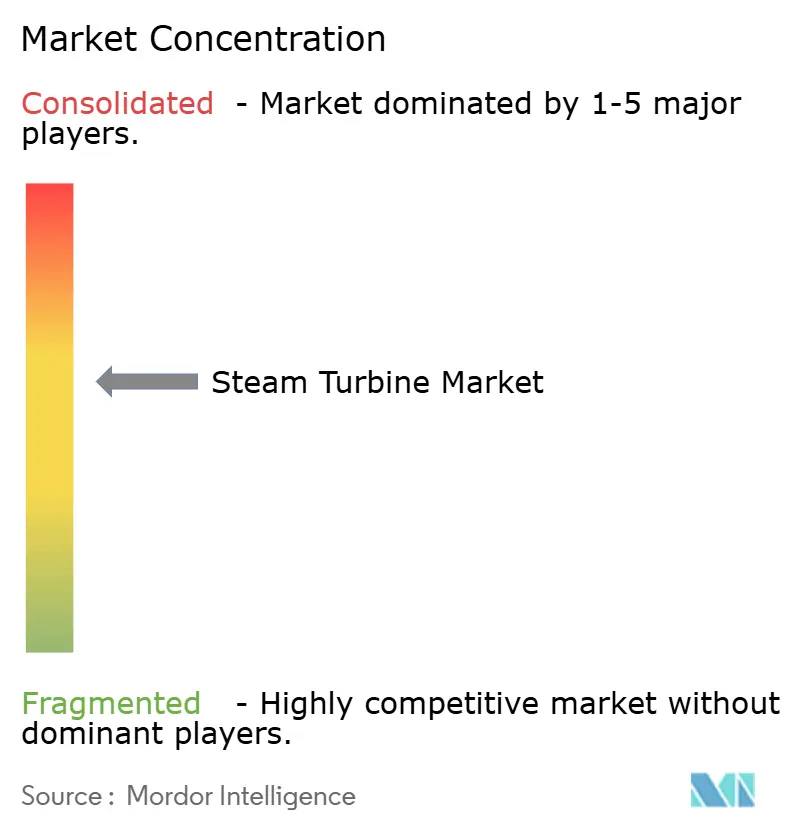
| Market Concentration | Medium |
Major Players *Disclaimer: Major Players sorted in no particular order Image © Mordor Intelligence. Reuse requires attribution under CC BY 4.0. | |
Steam Turbine Market Analysis by Mordor Intelligence
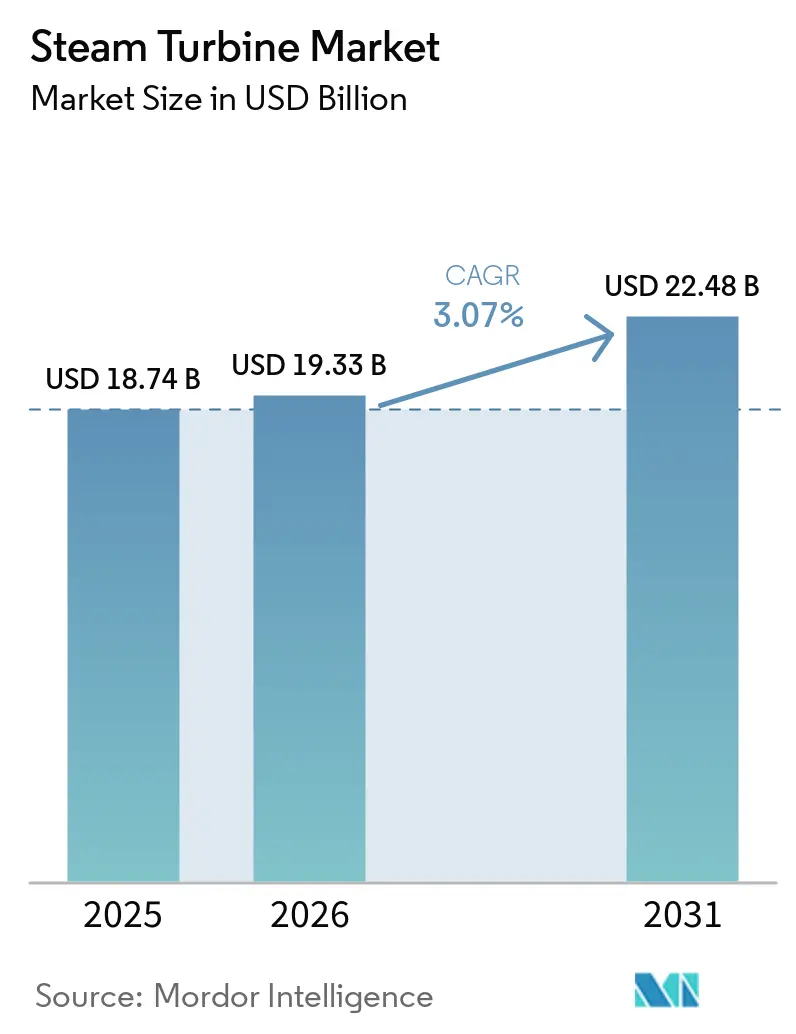
The Steam Turbine Market size is expected to grow from USD 18.74 billion in 2025 to USD 19.33 billion in 2026 and is forecast to reach USD 22.48 billion by 2031 at 3.07% CAGR over 2026-2031.
Demand resilience stems from repowering coal retirements, hybridizing with renewables, and industrial cogeneration that favors sub-300 MW units for on-site power and process steam.[1]GE Vernova Inc., “HA Technology,” gevernova.com Utilities in North America and Europe are investing in hydrogen-ready combined-cycle plants that ramp in under 30 minutes, preserving synchronous inertia while meeting carbon targets.[2]Federal Energy Regulatory Commission, “Order 841 Electric Storage Participation,” ferc.gov In Asia-Pacific, continuing coal-fleet modernization in China, India’s dual coal-and-nuclear build-out, and Southeast Asia’s manufacturing boom collectively anchor almost half of 2025 revenue. Technology differentiation now pivots on digital-twin predictive maintenance, single-crystal blading that withstands cycling fatigue, and combustor retrofits that allow up to 50% hydrogen by volume without derating.
Key Report Takeaways
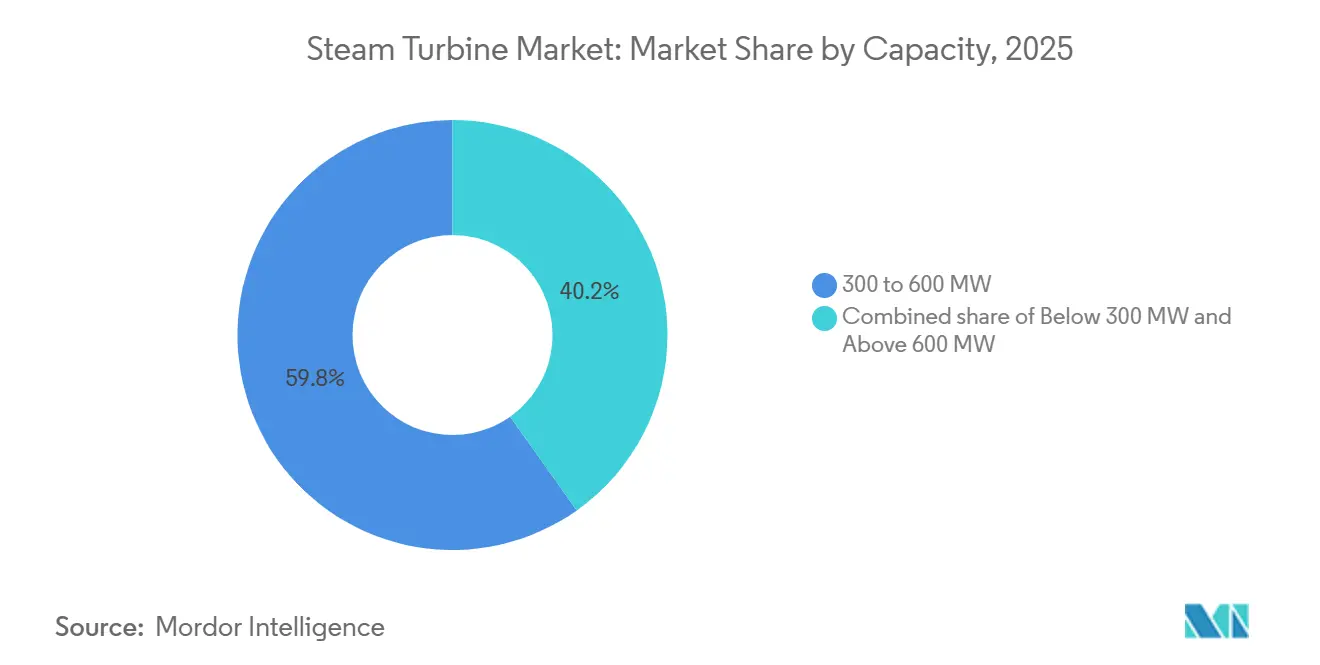
- By capacity, the 300 to 600 MW bracket commanded 59.8% of the steam turbine market share in 2025, and below-300 MW units are forecast to expand at a 4.8% CAGR through 2031.
- By plant fuel, the coal segment accounted for 58.5% steam turbine market size in 2025, while the biomass and waste-to-energy segment is projected to rise at a 5.1% CAGR to 2031.
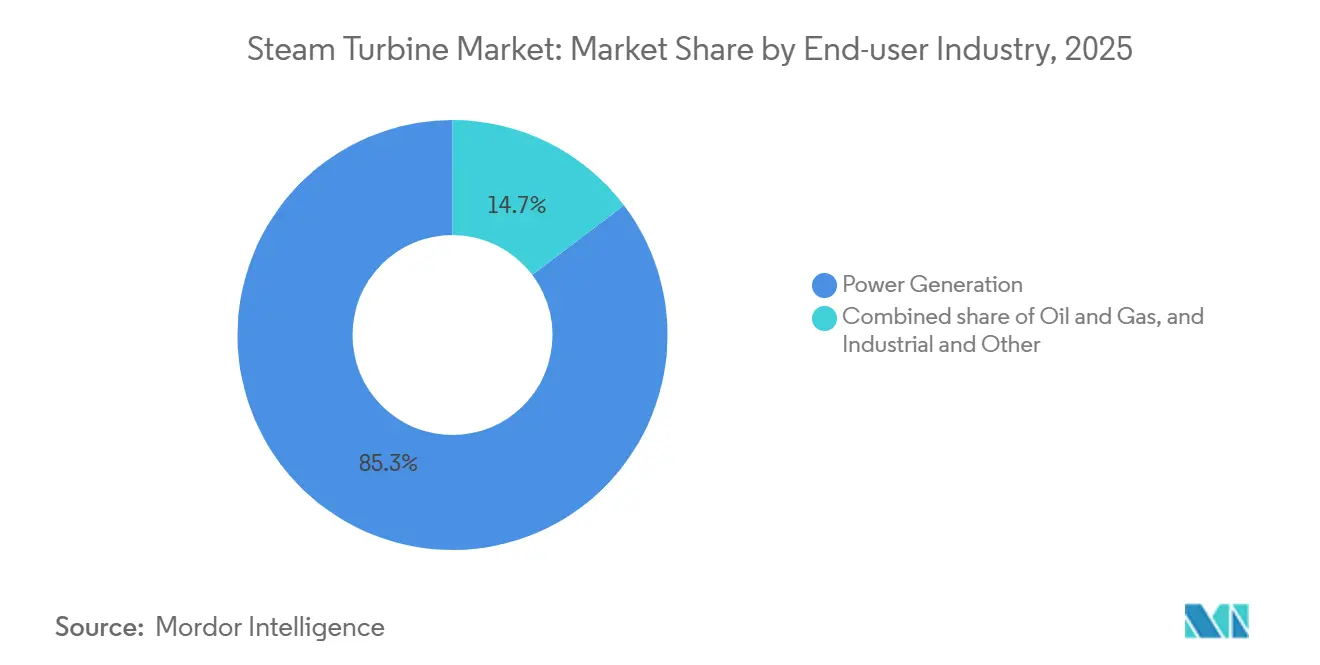
- By end-user industry, power generation held 85.3% of the 2025 market, and the same is expected to post a 3.5% CAGR by 2031.
- By geography, Asia-Pacific led with 47.6% revenue share in 2025; the Middle East and Africa region is anticipated to grow at 5.3% through 2031.
Note: Market size and forecast figures in this report are generated using Mordor Intelligence’s proprietary estimation framework, updated with the latest available data and insights as of 2026.
Global Steam Turbine Market Trends and Insights
Drivers Impact Analysis*
| Driver | (~) % Impact on CAGR Forecast | Geographic Relevance | Impact Timeline |
|---|---|---|---|
| Surging demand for flexible baseload capacity in coal-retiring grids | 0.80% | North America, Europe, selected APAC markets | Medium term (2-4 years) |
| Repowering of ageing combined-cycle plants with advanced-class steam turbines | 0.60% | Global, concentrated in North America and Western Europe | Short term (≤ 2 years) |
| Post-inflation industrial CAPEX boom in South-East Asia | 0.50% | ASEAN core states and India | Short term (≤ 2 years) |
| Hydrogen-ready turbine upgrades unlocking future revenue streams | 0.70% | Europe, Japan, South Korea, pilot sites in Middle East | Long term (≥ 4 years) |
| Government-led nuclear new-build programs in emerging markets | 0.50% | Middle East and South Asia | Long term (≥ 4 years) |
| Decarbonized district-heating schemes using extraction-condensing units | 0.40% | Nordic region, Germany, Russia, China | Medium term (2-4 years) |
| Source: Mordor Intelligence | |||
Surging Demand for Flexible Baseload Capacity in Coal-Retiring Grids
Steam turbines equipped with fast-start and low-turn-down features are being retained as synchronous condensers to supply inertia in grids where wind and solar penetration already exceeds 40%.[3]IEEE Power & Energy Society, “Grid Stability and Renewable Integration,” ieee-pes.org U.S. utilities that decommissioned older subcritical coal units are now repowering interconnection rights with hydrogen-ready combined-cycle blocks that synchronize within 30 minutes, a requirement spelled out in several Midcontinent ISO capacity auctions.[4]Federal Energy Regulatory Commission, “Order 841 Electric Storage Participation,” ferc.gov German operators delaying lignite closures until 2030 are ordering single-crystal bladed turbines that can cycle twice daily without creep damage. These installations provide voltage support during evening demand ramps longer than four-hour battery limits, offsetting curtailment penalties levied on renewables. Consequently, steam turbine market participants offering enhanced cycling capability and synthetic inertia packages are commanding 8% to 12% equipment price premiums over legacy designs.
Repowering of Ageing Combined-Cycle Plants with Advanced Class Steam Turbines
Roughly 120 GW of F-class gas plants installed between 2000 and 2010 are reaching design life, driving a repowering cycle that replaces aging steam trains with H- or J-class equipment. A typical 500 MW uprate boosts net efficiency by 2-3 percentage points and extends asset life 20 years at 40%-50% of greenfield capex, yielding paybacks under seven years at USD 4 per MMBtu gas prices. European Union carbon-intensity rules encourage utilities to retrofit rather than build new, preserving existing grid permits and water rights. Vendors supplying modular turbine trains that fit within existing foundations have shortened outage windows from 16 weeks to 10, reducing lost-revenue risk for merchant plants. Hydrogen co-firing tolerance up to 30% by volume is now a bid prerequisite in several U.K. capacity-market tenders, further stimulating repower demand.
Post-Inflation Industrial CAPEX Boom in South-East Asia
Delayed investments from 2023 inflation spikes were uncorked in 2025 as petrochemical, textile, and food-processing firms raced to restore capacity. Indonesia’s Tuban and Balongan refinery expansions alone booked more than 600 MW of extraction-condensing turbine orders, allowing simultaneous process steam at 40-60 bar and power export. Vietnam’s textile clusters added 350 MW of biomass-and-gas cogeneration to hedge against grid-tariff volatility. Thailand’s Eastern Economic Corridor attracted automotive and electronics plants demanding dual-fuel turbines to manage pending carbon-border tariffs. These projects favor sub-300 MW trains that ship in modular skids, compressing construction cycles and qualifying for local-content incentives, thereby lifting the steam turbine market across ASEAN.
Hydrogen-Ready Turbine Upgrades Unlocking Future Revenue Streams
OEMs are offering combustor retrofits priced near 10% of the original turbine cost that enable 30%-50% hydrogen firing, deferring full fleet replacement. Europe’s Fit-for-55 package classifies hydrogen-ready assets as sustainable under the EU taxonomy, improving project finance rates by up to 100 basis points. Japan’s national program targets ammonia blends by 2028, funding burner development for existing coal plants. Pilot units in the Netherlands and South Korea logged over 6,000 fired hours on 30% hydrogen without measurable blade distress, convincing insurers to lower premium surcharges. As hydrogen supply networks mature near ports and chemical clusters, turbine retrofits provide a bridge revenue stream, guaranteeing parts and service contracts over the next decade and sustaining the steam turbine market through energy-transition volatility.
Restraints Impact Analysis*
| Restraint | (~) % Impact on CAGR Forecast | Geographic Relevance | Impact Timeline |
|---|---|---|---|
| Aggressive LCOE decline of utility-scale solar-plus-storage | –0.9% | High-insolation regions worldwide | Short term (≤ 2 years) |
| Water-stress regulations curbing once-through cooling permits | –0.4% | U.S. Southwest, North China Plain, Middle East, Southern Africa | Medium term (2-4 years) |
| Slow EPC execution cycles inflating project IRRs | –0.3% | Global, acute in India, Brazil, Indonesia | Short term (≤ 2 years) |
| Financing flight from fossil-linked assets post-ESG mandates | –0.5% | Europe, North America, spillover to APAC | Medium term (2-4 years) |
| Source: Mordor Intelligence | |||
Aggressive LCOE Decline of Utility-Scale Solar-Plus-Storage
Four-hour lithium-ion storage paired with PV reached a global weighted-average levelized cost of USD 56 per MWh in 2025, undercutting new combined-cycle gas in sunny markets. As capacity factors rise beyond 30% in deserts and tropics, utilities are canceling steam contracts in favor of renewable portfolios, trimming near-term addressable demand by almost 1 GW yearly. OEMs emphasize ancillary-service revenue and fast black-start capabilities, but long-duration storage prototypes such as flow batteries and compressed air threaten this advantage after 2028. Consequently, project developers now price gas and coal exposure higher, increasing required equity returns by 200-250 basis points, which compresses the steam turbine market opportunity window.
Water-Stress Regulations Curbing Once-Through Cooling Permits
Thermal power plants account for around 15% of global freshwater withdrawals, prompting regulatory crackdowns in arid basins. The U.S. Section 316(b) revision forces closed-loop cooling, adding USD 50-100 million to a 500 MW plant and shaving 2%-3% net efficiency. China’s ban on once-through cooling for new coal units in the North China Plain affects 40 GW of planned capacity and elevates the levelized cost by USD 4 per MWh. Middle Eastern developers consider desalination brine but face corrosion premiums of 12%-18% on turbine materials. These policies lengthen permitting cycles and shift investment toward air-cooled or renewables alternatives, restraining the steam turbine market trajectory.
*Our forecasts treat driver/restraint impacts as directional, not additive. The impact forecasts reflect baseline growth, mix effects, and variable interactions.
Segment Analysis
By Capacity: Mid-Range Units Anchor Utility Demand
The 300 to 600 MW class contributed 59.8% of 2025 revenue, underscoring its dominance within combined-cycle and ultra-supercritical coal configurations. At this level, economies of scale match common transformer ratings and regional grid codes, ensuring dispatch priority during peak hours. The steam turbine market size for this class is forecast to rise to USD 13.5 billion by 2031 as utilities in India, Egypt, and Saudi Arabia finalize tenders for gas and nuclear baseload. Efficiency records continue to fall: GE’s 9HA.02 notched 62.5% net combined-cycle efficiency in 2025, while Siemens Energy’s SGT6-9000HL demonstrated 50% hydrogen capability without derate.
Below-300 MW units will outpace headline growth at 4.8% CAGR, mirroring an industrial pivot toward on-site cogeneration in Southeast Asia and LatAm pulp, textile, and food clusters. Extraction-condensing variants in the 150-250 MW band are gaining popularity, where process steam drives petrochemical margins upward of 300 basis points compared with grid purchases. At the micro-utility end, <100 MW modular trains address mining camps and island micro-grids that prize fast deployment over top-quartile heat rate. Conversely, the >600 MW bracket remains niche, restricted to new supercritical coal in India and select AP1000 reactor projects, facing stiffer ESG headwinds and limited lender appetite.


By Plant Fuel: Coal Dominates, Biomass and Waste-to-Energy Surge
Coal kept 58.5% of the steam turbine market share in 2025, supported by pipeline projects in China, India, and Indonesia, where domestic resource endowment and grid inertia needs prevail. Yet stricter emission norms push adoption of ultra-supercritical parameters at 600 °C and 250 bar, helping new builds cut CO₂ intensity by nearly 18% versus legacy subcritical fleets.
Biomass-and-waste steam installations will post the fastest expansion at 5.1% CAGR, riding Europe’s circular-economy directives and Japan’s municipal waste subsidies. Finnish, Swedish, and Danish utilities retrofit district-heating plants to burn forestry residues, yielding >85% fuel utilization factors and producing eligibility for renewable-energy certificates. Gas-fired combined-cycle demand remains steady in markets with low LNG import costs and carbon-pricing exemptions, while nuclear projects in the Middle East and South Asia create large-lot orders every three-to-four years. Pilot hydrogen and ammonia co-firing tests underscore a transitional pathway rather than an immediate volume driver, yet specifications for combustor readiness already appear in tender documents across the EU and Japan.
By End-User Industry: Power Generation Leads, Oil and Gas Gains
Power producers absorbed 85.3% of 2025 shipments as utilities balanced coal closures with gas and nuclear additions. These customers prize long-cycle service agreements and grid-code compliance, features that translate into recurring margin for OEMs and shape steam turbine market size projections through 2031.
Oil-and-gas complexes increase share as national companies monetize associated gas and curb flaring fines that can rise to USD 10 per barrel equivalent. Extraction-condensing turbines inside refineries displace separate boilers, raising site energy efficiency 6%-8% and insuring against volatile grid tariffs. Industrial users such as pulp-and-paper mills in Brazil deploy bagasse-fired turbines under feed-in tariff schemes paying USD 70-80 per MWh, stimulating regional niche suppliers like Triveni. Overall, non-utility offtake supports diversity in specification ranges and cushions the steam turbine industry against utility procurement cycles.
Geography Analysis
Asia-Pacific retained 47.6% of 2025 revenue as China’s ultra-supercritical upgrades and India’s coal-plus-nuclear trajectory dominated procurement. Southeast Asia added 15 GW of cogeneration through 2025-2028, reflecting industrial expansion and favorable fuel availability. As a result, the regional steam turbine market continues to generate large frame orders plus an accelerating volume of mid-sized industrial trains.
The Middle East and Africa steam turbine market is poised to grow at 5.3% CAGR, driven by Saudi Arabia’s 30 GW gas-fired independent power projects, the United Arab Emirates’ full Barakah ramp-up, and Egypt’s nuclear and gas blend. Gas availability from Jafurah and other unconventional fields encourages combined-cycle builds that free oil for export. Concurrently, nuclear ambitions across Egypt and Saudi Arabia lock in multi-year turbine demand, elevating the regional contribution from 12% share in 2025 to an expected 15% by 2031.
North America and Europe experience flat-to-modest expansion as coal exits counterbalance repowering and district-heating retrofits. U.S. growth hinges on capacity-market incentives for fast-start synchronous capacity, while European demand centers on hydrogen-ready gas blocks and biomass CHP. South America remains niche, with Brazil’s sugar-bagasse CHP and Argentina’s Vaca Muerta gas development representing most activity. Together, these dynamics maintain global diversification of revenue streams within the steam turbine market.

Competitive Landscape
The top five OEMs, Siemens Energy, GE Vernova, Mitsubishi Heavy Industries, Toshiba Energy Systems, and Doosan Enerbility, control close to 50% of installed capacity, leaving room for regional champions such as Dongfang, Harbin Electric, Bharat Heavy Electricals, and Shanghai Electric to capture domestic mandates. Hydrogen-ready combustors, advanced materials, and predictive analytics form the current innovation frontier. GE’s additive-manufactured nozzles cut production lead time 40% and increase aerodynamic efficiency, winning several retrofit contracts in 2025. Siemens Energy’s remote-monitoring suite demonstrated 20% outage reduction across a 600-turbine fleet, shifting revenue mix toward long-term service.
Patent activity surged, with the U.S. Patent Office logging 340 turbine-related filings in 2025, up 60% from 2023, indicating heightened R&D competition. Smaller specialists differentiate through application focus: Elliott Group for mechanical drives, Triveni for sub-30 MW cogeneration, and WEG for biomass-focused units in Brazil. Strategic alliances also proliferate; GE-Vernova’s 2026 venture with Larsen & Toubro localizes H-class assembly in India, securing logistics advantages and meeting local-content clauses. Overall, pricing pressure persists but is partially offset by premium features tied to decarbonization readiness and digital reliability services.
Steam Turbine Industry Leaders
Siemens Energy AG
Mitsubishi Heavy Industries Ltd
Toshiba Corporation
GE Vernova Inc.
Doosan Enerbility Co Ltd
- *Disclaimer: Major Players sorted in no particular order

Recent Industry Developments
- January 2026: JSW Thermal Energy entered into an agreement with Toshiba JSW to procure two 800-MW steam turbine generators for the 1,600-MW Salboni thermal power project located in West Bengal, India.
- October 2025: Toshiba enhanced its thermal-energy portfolio by deploying EtaPRO™ AI-based monitoring across 165 power plants. This initiative aims to improve operational efficiency for its steam-turbine fleets. Toshiba continues to lead globally in geothermal steam-turbine supply, with over 60 units delivering approximately 3,800 MW of capacity worldwide.
- July 2025: Fermi America secured agreements to acquire equipment with a total capacity exceeding 600 MW. The package includes six SGT800 gas turbines, six HRSG units, and one SST600 steam turbine. This combined-cycle configuration is designed to support reliable and flexible power generation, addressing data-center and AI-driven energy demands.
- June 2025: Malta Inc. initiated the development of a 14 MWh molten-salt thermal-storage pilot project in Spain. The system utilizes a steam-cycle configuration, where stored heat powers a steam turbine for electricity generation. This project highlights the role of steam turbines in long-duration energy storage applications.


Global Steam Turbine Market Report Scope
A steam turbine is simply a metal-constructed rotor motor on an axle, which is one of the essential components of a combined cycle power plant and is used to generate electricity. A mix of compressed air with natural gas fuel is used to run the steam turbine, as well as in the HRSG (heat recovery steam generator). It is also an important component of the coal-based thermal turbine power plant, nuclear-based steam turbine power plant, and geothermal-based steam power plant.
The steam turbine for power generation market is segmented by capacity, plant fuel, end-user industry, and geography. By capacity, the market is segmented into below 300 MW, 300 to 600 MW, and above 600 MW. By plant fuel, the market is segmented into coal, natural gas, nuclear, biomass/waste-to-energy. By end-user industry, the market is segmented into power generation, oil and gas (Up-/Mid-/Down-stream), and industrial and other. The report also covers the market sizes and forecasts across major regions. The market sizing and forecasts are made for each segment based on revenue (USD).
| Below 300 MW |
| 300 to 600 MW |
| Above 600 MW |
| Coal |
| Natural Gas |
| Nuclear |
| Biomass/Waste-to-Energy |
| Power Generation |
| Oil and Gas (Up-/Mid-/Down-stream) |
| Industrial and Other |
| North America | United States |
| Canada | |
| Mexico | |
| Europe | Germany |
| United Kingdom | |
| France | |
| Italy | |
| NORDIC Countries | |
| Russia | |
| Rest of Europe | |
| Asia-Pacific | China |
| India | |
| Japan | |
| South Korea | |
| ASEAN Countries | |
| Rest of Asia-Pacific | |
| South America | Brazil |
| Argentina | |
| Rest of South America | |
| Middle East and Africa | Saudi Arabia |
| United Arab Emirates | |
| South Africa | |
| Egypt | |
| Rest of Middle East and Africa |
| By Capacity | Below 300 MW | |
| 300 to 600 MW | ||
| Above 600 MW | ||
| By Plant Fuel | Coal | |
| Natural Gas | ||
| Nuclear | ||
| Biomass/Waste-to-Energy | ||
| By End-user Industry | Power Generation | |
| Oil and Gas (Up-/Mid-/Down-stream) | ||
| Industrial and Other | ||
| By Geography | North America | United States |
| Canada | ||
| Mexico | ||
| Europe | Germany | |
| United Kingdom | ||
| France | ||
| Italy | ||
| NORDIC Countries | ||
| Russia | ||
| Rest of Europe | ||
| Asia-Pacific | China | |
| India | ||
| Japan | ||
| South Korea | ||
| ASEAN Countries | ||
| Rest of Asia-Pacific | ||
| South America | Brazil | |
| Argentina | ||
| Rest of South America | ||
| Middle East and Africa | Saudi Arabia | |
| United Arab Emirates | ||
| South Africa | ||
| Egypt | ||
| Rest of Middle East and Africa | ||


Key Questions Answered in the Report
What was the steam turbine market size in 2026?
It is valued at USD 19.33 billion in 2026.
Which capacity range dominates current contracts?
Units rated 300-600 MW captured 59.8% of 2025 revenue.
Which fuel segment is growing fastest to 2031?
Biomass and waste-to-energy turbines are projected to advance at a 5.1% CAGR.
Why are repowering projects important now?
Over 120 GW of ageing combined-cycle plants require efficiency upgrades that cost 40%-50% of greenfield builds yet deliver most of the performance gain.
How will hydrogen affect future turbine demand?
Combustor retrofits enabling 30%-50% hydrogen blends create a transition pathway that preserves turbine relevance while meeting decarbonization targets.
Which region shows the highest forecast growth?
The Middle East and Africa are set to expand at 5.3% CAGR through 2031 due to gas and nuclear investments.
Page last updated on:


