Sports Composites Market Size and Share
Market Overview
| Study Period | 2020 - 2031 |
|---|---|
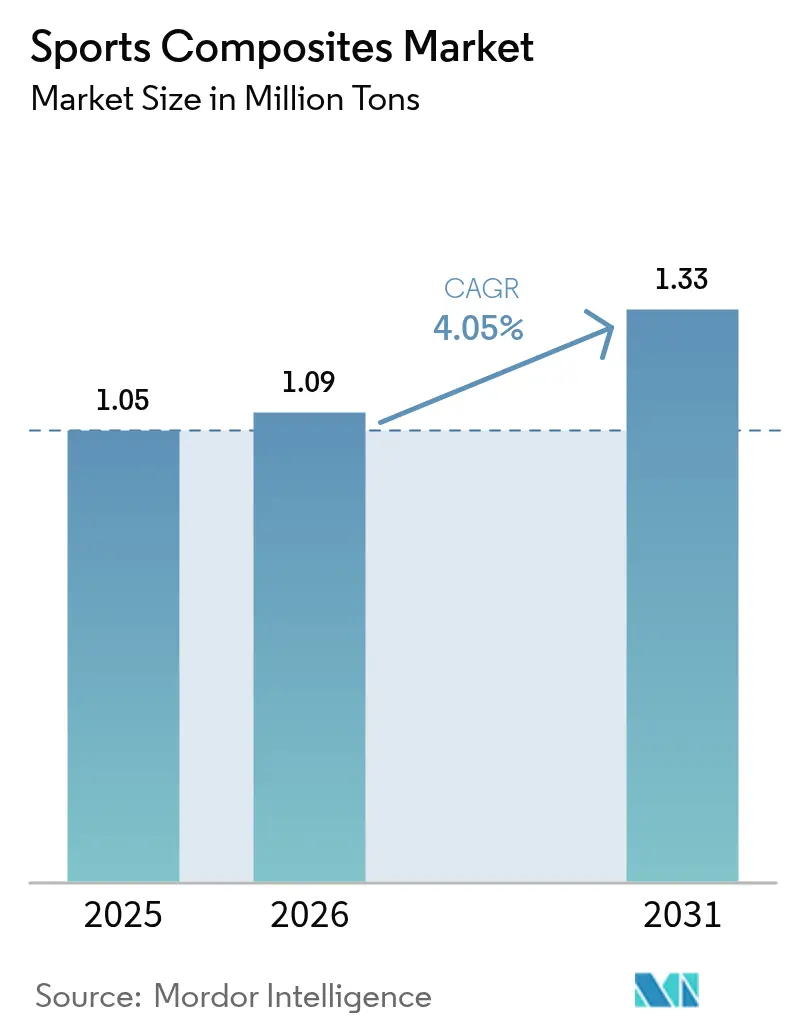
| Market Volume (2026) | 1.09 Million tons |
| Market Volume (2031) | 1.33 Million tons |
| Growth Rate (2026 - 2031) | 4.05% CAGR |
| Fastest Growing Market | Asia Pacific |
| Largest Market | Asia-Pacific |
| Market Concentration | Medium |
Major Players *Disclaimer: Major Players sorted in no particular order Image © Mordor Intelligence. Reuse requires attribution under CC BY 4.0. | |
Sports Composites Market Analysis by Mordor Intelligence
The Sports Composites Market size is expected to grow from 1.05 Million tons in 2025 to 1.09 Million tons in 2026 and is forecast to reach 1.33 Million tons by 2031 at 4.05% CAGR over 2026-2031. Growth rests on the widening preference for lightweight, high-performance equipment that measurably enhances athletic output, a trend showcased by the broad carbon-fiber use at the 2024 Paris Olympics[1]NitPro Composites, “Carbon Fiber Sports Equipment in the 2024 Paris Olympics,” nitprocomposites.com. Rising manufacturing automation, sustained product innovation and a sharpening focus on sustainable materials are further solidifying demand. The Asia-Pacific region anchors volume growth through large-scale production capacity, government-backed cycling initiatives and steadily climbing domestic consumption. Carbon-fiber adoption is accelerating as microwave-assisted processing, automated fiber placement and thermoplastic routes narrow historical cost gaps. Ongoing supply turbulence in PAN feedstock and uneven recycling infrastructure pose near-term hurdles but are unlikely to derail the medium-term expansion pathway.
Key Report Takeaways
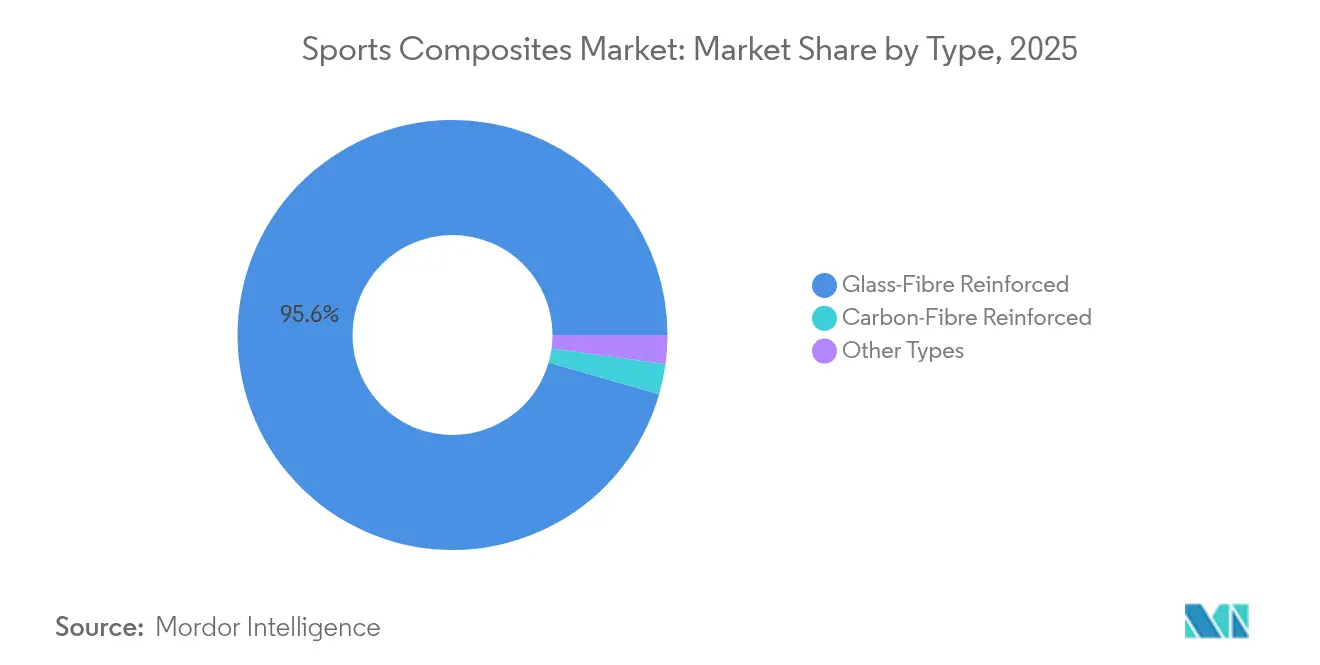
- By type, glass-fibre reinforced composites led with 95.55% of sports composites market share in 2025, while carbon-fibre reinforced products are projected to register the fastest 9.38% CAGR through 2031.
- By resin, epoxy accounted for 39.55% of the sports composites market size in 2025 and is set to advance at a 5.12% CAGR during 2026-2031.
- By manufacturing process, prepreg lay-up held 44.55% share in 2025; resin transfer molding is forecast to expand at a 7.72% CAGR to 2031.
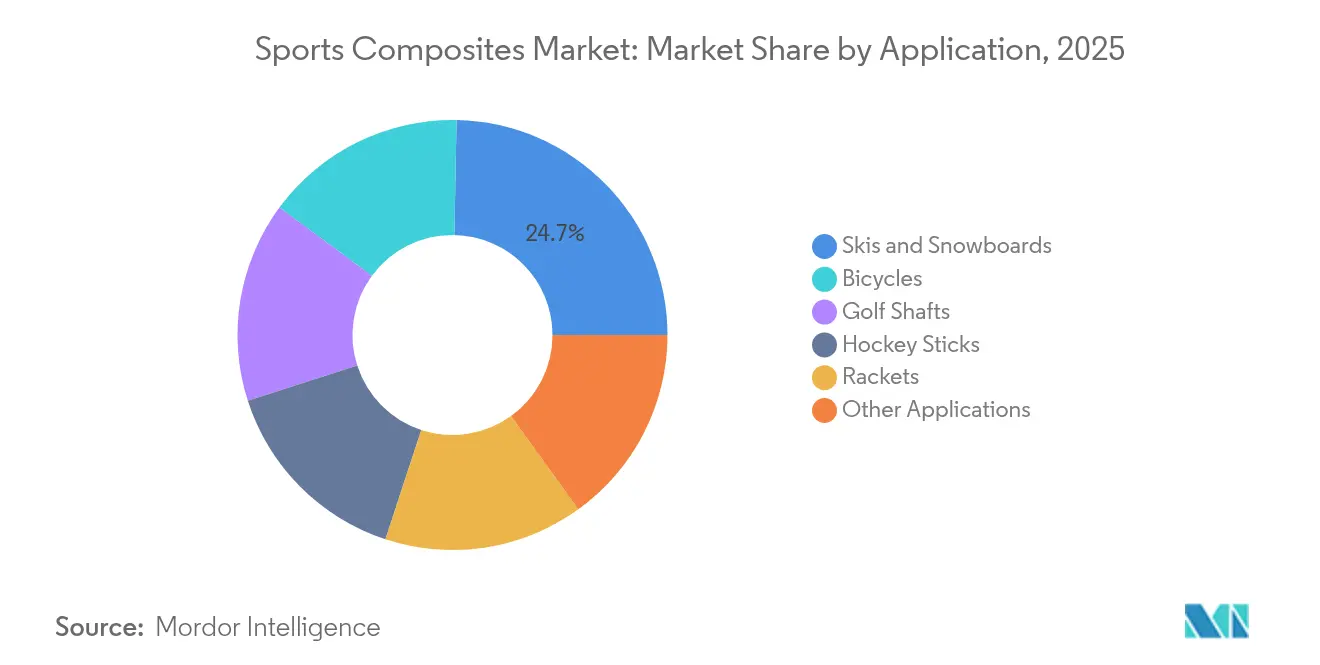
- By application, skis and snowboards commanded 24.70% of the sports composites market size in 2025, whereas bicycles are growing fastest at a 5.68% CAGR.
- By geography, Asia-Pacific captured 55.40% sports composites market share in 2025 and is slated to maintain the highest 4.64% CAGR through 2031.
Note: Market size and forecast figures in this report are generated using Mordor Intelligence’s proprietary estimation framework, updated with the latest available data and insights as of 2026.
Global Sports Composites Market Trends and Insights
Drivers Impact Analysis*
| Driver | (~) % Impact on CAGR Market | Geographic Relevance | Impact Timeline |
|---|---|---|---|
| Rising Adoption of Automated Fiber-Placement for High-End Bicycles in Europe | +1.5% | Europe, with spillover to North America | Medium term (2-4 years) |
| Increasing Demand for Lightweight and High-Performance Sports Equipment | +0.9% | Global | Long term (≥ 4 years) |
| Government-Backed Cycling Infrastructure Boom in Asia Catalyzing Demand for Lightweight Frames | +0.7% | Asia-Pacific, primarily China, Japan, and South Korea | Medium term (2-4 years) |
| Growing Golf Industry | +0.5% | North America, Europe, Asia-Pacific | Medium term (2-4 years) |
| Growing Popularity of Recreational and Professional Sports | +0.3% | Global | Long term (≥ 4 years) |
| Source: Mordor Intelligence | |||


Rising adoption of automated fiber placement for high-end bicycles
Automated fiber placement systems are gaining traction among European frame builders as equipment prices fall and programming tools mature. The technology delivers precise tow placement, cuts scrap rates by 30% and trims lay-up time by roughly 40% compared with hand lay-up. Resulting frames weigh 15-20% less yet meet stringent stiffness benchmarks, allowing brands to tailor ride characteristics for professional racers and demanding enthusiasts. Production repeatability also opens the door to larger batch runs without compromising custom geometries, thereby supporting profitable mid-volume supply contracts across Europe and North America. Wider AFP integration is expected to ripple into other tubular products, including hockey sticks and golf shafts, as machine utilization rates rise and unit costs continue to decline.
Increasing demand for lightweight and high-performance equipment
Across disciplines, athletes now rely on composite gear to secure marginal gains that translate into podium finishes. Carbon-fiber tennis rackets generate up to 30% higher rebound power while dampening frame vibration by 10%, helping players maintain control during extended rallies. In cycling, carbon frames shave up to 40% weight relative to aluminum while preserving torsional rigidity—a combination that improves acceleration on climbs and sprints. Mainstream consumers are adopting these technologies as retail prices drop, widening the customer base for composite goods. Manufacturers are therefore scaling thermoplastic molding and integrating graphene or nanofillers to deliver lighter, tougher and more sustainable product lines without sacrificing profit margins.
Government-backed cycling infrastructure boom in Asia
National and municipal authorities in China, Japan and South Korea are allocating multi-billion-dollar budgets to bicycle lanes, rental schemes and velodromes. Improved infrastructure raises commuting and recreational cycling participation, stimulating demand for both entry-level and premium composite frames. Producers in Fujian and Guangdong have announced double-digit capacity expansions to meet fresh orders, while Japanese material suppliers are promoting locally designed carbon prepregs to capture value within the region. Suppliers anticipate spillover advantages in protective gear and components—such as helmets, handlebar stems and wheelsets—as consumers gravitate toward full composite systems to maximize ride performance.
Expanding golf participation
The global golf landscape is diversifying as younger players, women and emerging-market consumers take up the sport. These demographics demand lighter shafts with precise flex profiles that complement varied swing speeds. Carbon-fiber technology enables extreme wall-thickness control and micro-taper adjustments, supporting mass customization programs run by leading club makers. Producers also highlight vibration dampening and torque stability as key selling points, allowing amateurs to replicate professional shot consistency. As participation grows, shaft volumes rise, reinforcing economies of scale for prepreg production lines dedicated to sporting goods.
Restraints Impact Analysis*
| Restraint | (~) % Impact on CAGR Forecast | Geographic Relevance | Impact Timeline |
|---|---|---|---|
| High Volatility in PAN-Based Carbon-Fiber Feedstock Prices | -1.2% | Global, with higher impact in regions with limited local production | Short term (≤ 2 years) |
| Limited End-of-Life Recycling Ecosystem for Multi-Material Sports Gear | -0.3% | Europe, North America | Medium term (2-4 years) |
| Tariff Barriers on Composite Bicycle Imports in the U.S. | -0.2% | North America, with impact on Asian exporters | Short term (≤ 2 years) |
| Source: Mordor Intelligence | |||
High volatility in PAN-based carbon-fiber feedstock prices
PAN precursor accounts for roughly half of finished carbon-fiber cost, leaving processors exposed to price swings linked to acrylonitrile and energy inputs. Spot quotations surged during 2024 and early 2025, compressing margins for mid-range sporting goods and deterring some bicycle OEMs from all-carbon frame catalogs. Research at the University of Limerick indicates microwave-assisted stabilization and carbonization could cut energy use by 70%, laying groundwork for cost relief, yet commercial roll-out remains two to three years away. In the interim, producers explore lignin-based precursors and scale recycled fiber blends to hedge price risk, but qualification cycles slow uptake in performance-critical gear.
Limited end-of-life recycling ecosystem for multi-material sports gear
Nearly 90% of composite sporting goods disposed in the United Kingdom still reach landfill. Complex lay-ups that combine fiber, resin and metallic inserts hinder straightforward material separation, while geographically dispersed user bases inflate reverse-logistics costs. Recent initiatives like the Carbon Fibre Circular Alliance (CFCA) are beginning to address this gap by developing circularity solutions specifically for carbon fiber sports equipment, with participation from major manufacturers including Scott Sports and Wilson Sporting Goods. Ski recycling trials in Denmark likewise leverage wind-turbine blade shredding expertise to process winter-sport laminates. Until such schemes scale, major brands face mounting sustainability scrutiny and must foot higher eco-design and take-back program expenses.
*Our forecasts treat driver/restraint impacts as directional, not additive. The impact forecasts reflect baseline growth, mix effects, and variable interactions.
Segment Analysis
By Type: Carbon-Fibre Gaining Despite Glass Dominance
Glass-fibre composites retained a dominant position, equal to 95.55% of the sports composites market in 2025. The material’s low cost and adequate mechanical profile suit entry-level skis, hockey sticks and protective shells, which depend on volume throughput and price competitiveness. Nevertheless, carbon-fibre output is projected to climb at a 9.38% CAGR, more than twice the overall sports composites market pace, as manufacturers exploit microwave stabilization, tow spreading and recycled fiber feeds to rein in cost. The sports composites market size tied to carbon-fibre goods is therefore set to rise sharply, propelled by bicycles, golf shafts and professional racket frames where weight savings justify premium pricing.
At application level, the sports composites market shows expanding dual-material architectures that blend carbon skins with glass core plies to balance cost and performance. Broader familiarity with carbon filament winding and automated tape placement shortens development cycles for new tubular products, enabling brands to unveil differentiated road and gravel bike line-ups each season. Niche fibers—aramid for impact resistance and bio-derived reinforcements such as algae-based carbon—remain experimental but attract research grants targeting reduced embodied carbon.


By Resin Type: Epoxy Leads Through Performance Advantages
Epoxy platforms comprised 39.55% of 2025 volume, reflecting their leading stiffness retention, low shrinkage and strong fiber bonding. The segment’s 5.12% projected CAGR keeps it ahead of polyurethane and polyester formulations due to growing demand for high-temperature-capable resins in thermoplastic fusion bonding. Developers are rolling out self-healing epoxy matrices and antibacterial additives for racket handles and helmet liners, broadening the property palette without major retooling. Polyurethane remains prominent in vibration-critical boards and pads, while vinyl ester holds share in marine-exposed surf and paddle gear where hydrolysis resistance is prized.
Future growth stems from fast-curing hot-melt epoxies compatible with high-speed compression presses. These chemistries slash cycle times, making automated short-run production financially viable for mid-market brands. Consequently, epoxy’s slice of the sports composites market size is expected to widen as processing productivity climbs and circularity initiatives repurpose manufacturing scrap into pre-preg stock.
By Manufacturing Process: Advanced Techniques Reshape Production
Prepreg lay-up delivered 44.55% of 2025 tonnage thanks to tight resin control and high fiber-volume fractions that underpin top-tier skis, frames and shafts. Autoclave cure, once the cost bottleneck, is being progressively replaced by out-of-autoclave ovens and rapid-pressure presses, shaving unit energy demand. Meanwhile, resin transfer molding is slated for a 7.72% CAGR because closed-mold tooling produces Class A finishes on both sides and entraps fewer volatiles, aligning with tightening plant emission norms. The sports composites market is also seeing filament winding expand into e-bike frames and trekking poles as multi-axis heads place varying moduli fibers along load paths.
Automated fiber placement is the showpiece innovation: multi-robot cells programmatically lay narrow tows to create variable-thickness laminates that cut inert mass from non-critical zones. Early adopters report 20% laminate weight reduction and rapid amortization of equipment on high-margin race products. As deposition speeds rise, AFP is expected to handle selected mid-volume items, reinforcing its role in future sports composites market growth.
By Application: Performance Demands Drive Diverse Adoption
Skis and snowboards accounted for 24.70% of the sports composites market size. Composite cores balance torsional stiffness with flex for edge grip, while strategic carbon and basalt stringers tune damping. Suppliers now experiment with recycled carbon and flax hybrids to meet resort sustainability targets. Bicycles, expanding at a 5.68% CAGR, rely on high-modulus carbon tubes, monocoque frames and structural rims to transfer rider wattage efficiently. Advanced thermoplastic over-molding merges dropouts and cable guides during cure, trimming secondary assembly labour.
Golf shafts, hockey sticks, and racket frames round out high-volume applications, each pushing lay-up science to fine-tune balance, vibration, and rebound. The sports composites market continues to diversify, with fishing rods, crash helmets and protective padding collectively absorbing meaningful tonnage. Emerging nanofiller-enhanced laminates for park-golf club faces, which demonstrated over 1,000% vibration-damping gains, illustrate the constant expansion of performance envelopes that composites unlock.
Geography Analysis
Asia-Pacific dominated 2025 with 55.40% of global volume. Producer scale, integrated fiber supply, and escalating domestic demand position the region as the key manufacturing and consumption hub. Chinese export data shows sporting goods shipments of CNY 7 billion (USD 992 million) in the first seven months of 2024, up 15.41% year-on-year. Regional policies that encourage urban cycling, winter-sport participation, and green material adoption underpin a forecast 4.64% CAGR to 2031. The sports composites market benefits from favorable trade terms under RCEP, helping Chinese, Japanese, and South Korean brands penetrate ASEAN and Oceania retail channels.
North America follows, supported by high discretionary spending on premium bicycles, golf sets, and winter gear. Domestic sustainability programs accelerate circular-economy pilots that recover carbon fiber from broken rackets and skis, positioning the region as a blueprint for end-of-life solutions. Yet tariff hikes on imported composite bicycles add cost pressures, encouraging some brands to onshore frame production or source from tariff-exempt partners to protect pricing.
Europe maintains a robust base of high-end ski, yacht, and cycling manufacturers who leverage precision AFP and RTM processes. Regional research clusters refine bio-based epoxy and recyclable thermoplastic composites, helping brands cut cradle-to-grave emissions. Development funding and stringent eco-design rules push firms to adopt closed-loop systems, giving European producers an early-mover advantage in circular product portfolios. South America, the Middle East, and Africa remain emerging but promising, with sports participation and infrastructure builds spawning new demand nodes for composite products.


Competitive Landscape
The global playing field combines large resin and fiber conglomerates with specialized sporting goods manufacturers, resulting in a moderately fragmented environment. Hexcel, Toray, and SGL Carbon leverage material-science depth and scale to supply consistent prepregs and tow, while niche firms differentiate through tailored golf shafts and flexible structural textiles. Equipment brands ranging from HEAD to Wilson embed material breakthroughs into popular gear lines, creating vertical integration that secures supply and embeds proprietary know-how into end products.
Innovation remains the decisive competitive lever. Microwave-assisted carbonization, lignin-derived precursors, and graphene-seeded laminates are nearing pilot scale, promising lower cost and enhanced performance. Firms commercializing closed-loop recycling or high-throughput AFP will likely capture a premium share as regulators and consumers demand greener, lighter, and longer-lasting gear. Consequently, the sports composites market is expected to favor agile producers that couple formulation expertise with adaptable manufacturing footprints.
Sports Composites Industry Leaders
TORAY INDUSTRIES, INC
Mitsubishi Chemical Carbon Fiber and Composites, Inc.
Hexcel Corporation
SGL Carbon
Solvay
- *Disclaimer: Major Players sorted in no particular order

Recent Industry Developments
- March 2024: HEAD partnered with Toray to develop prototype racquets using Toray's 100% bio-circular carbon fibers, adhering to the mass balance approach. This collaboration is expected to drive innovation and sustainability in the sports composite market.
- January 2025: ARRIS Composites entered a strategic technology partnership with Henry Repeating Arms to scale high-performance fiber-reinforced composites.


Research Methodology Framework and Report Scope
Market Definitions and Key Coverage
According to Mordor Intelligence, we define the sports composites market as the global supply of carbon- and glass-reinforced plastic laminates, prepregs, and molded parts that become finished sporting equipment, golf shafts, rackets, bicycle frames, skis, snowboards, hockey sticks, fishing rods, kayak paddles, and similar gear sold through OEM and aftermarket channels. Units are tracked in metric tons from first commercial molding to product shipment.
Scope exclusion: Raw fibers, thermoplastic films, and prepregs earmarked for aerospace, automotive, or marine applications fall outside this study.
Segmentation Overview
- By Type
- Carbon-Fibre Reinforced
- Glass-Fibre Reinforced
- Other Types
- By Resin Type
- Epoxy
- Polyurethane
- Other Resin types
- By Manufacturing Process
- Prepreg Lay-up
- Resin Transfer Molding
- Filament Winding
- Pultrusion
- Compression Molding
- Other Processes
- By Application
- Golf Shafts
- Hockey Sticks
- Rackets
- Bicycles
- Skis and Snowboards
- Other Applications
- By Geography
- Asia-Pacific
- China
- Japan
- India
- South Korea
- Rest of Asia-Pacific
- North America
- United States
- Canada
- Mexico
- Europe
- Germany
- United Kingdom
- France
- Italy
- Rest of Europe
- South America
- Brazil
- Argentina
- Rest of South America
- Middle East and Africa
- Saudi Arabia
- South Africa
- Rest of Middle East and Africa
- Asia-Pacific
Detailed Research Methodology and Data Validation
Primary Research
Mordor analysts interviewed resin formulators, composite lay-up contractors, major sporting-goods buyers, and regional trade bodies across North America, Europe, and Asia-Pacific. These discussions validated tonnage conversion factors, clarified end-use growth pockets, and tested early model outputs before final sign-off.
Desk Research
Our desk study started with trade statistics from sources such as UN Comtrade, Eurostat, China Customs, and the U.S. International Trade Commission, which let us reconstruct cross-border flows of carbon- and glass-reinforced sporting goods. Analyst teams then drew ratios from the World Federation of the Sporting Goods Industry, patent filings accessed via Questel, and company financials on D&B Hoovers to benchmark material yield and average selling prices. News and technical papers on epoxy cure cycles, bicycle safety standards, and winter-sport participation trends, gathered through Dow Jones Factiva, rounded out the secondary stack. This listing illustrates the type of publicly available evidence consulted; many other open datasets and journals were tapped for corroboration.
Market-Sizing & Forecasting
A top-down build begins with production and trade data to size volume, which is then stress-tested with bottom-up cues, sampled supplier shipments, OEM channel checks, and average shaft or frame weights. Key variables include carbon-fiber penetration rates, resin price differentials, global cycling unit sales, winter-sport participation indices, and regional composite waste factors; together they explain a significant portion of model variance. Forecasts rely on multivariate regression paired with scenario analysis for resin price shocks, with expert consensus used to bound high-growth outliers. Data gaps on smaller niche products are bridged through proxy ratios from closely related gear categories.
Data Validation & Update Cycle
Before publication, outputs pass a two-step peer review, anomaly checks against independent sport-participation dashboards, and variance reviews with prior editions. Reports refresh every twelve months, and interim recalculations are triggered by material events such as a resin supply disruption or major regulatory change.
Why Our Sports Composites Baseline Commands Reliability
Published estimates often diverge because firms mix revenue and volume metrics, slice differing product baskets, or lock forecasts to outdated participation curves.
Key gap drivers include scope stretch into protective foam gear, inconsistent average selling prices, limited geography coverage, and refresh cycles longer than one year; areas where Mordor's disciplined, annually updated tonnage model stays tightly focused on true composite equipment flows.
Benchmark comparison
| Market Size | Anonymized source | Primary gap driver |
|---|---|---|
| 1.05 million tons (2025) | Mordor Intelligence | - |
| USD 4.04 billion (2024) | Global Consultancy A | Revenue basis, includes protective gear foams, biennial update |
| USD 4.97 billion (2025) | Industry Association B | Combines hybrid fiber boards, five-country scope only |
| USD 4.71 billion (2024) | Trade Journal C | Excludes glass-fiber gear, applies aggressive 7 % CAGR |
Taken together, the comparison shows that Mordor's tonnage-first approach, clear product boundaries, and yearly refresh deliver a balanced baseline that decision-makers can trace to transparent variables and repeatable steps.


Key Questions Answered in the Report
What is the current size of the sports composites market?
The sports composites market stands at 1.09 million tons in 2026 and is projected to reach 1.33 million tons by 2031.
Which material type is growing fastest within sports composites?
Carbon-fibre reinforced composites are expanding at a 9.38% CAGR, outpacing all other reinforcement types.
Why does Asia-Pacific dominate sports composites production?
The region benefits from integrated supply chains, government support for cycling and winter sports, and robust export demand that collectively deliver 55.40% of global volume.
How are manufacturers tackling carbon-fiber cost volatility?
Firms are piloting microwave-assisted carbonization, exploring lignin-based precursors and increasing recycled fiber content to reduce dependence on conventional PAN feedstock.
What role does automated fiber placement play in sports equipment manufacturing?
AFP enables precise tow deposition, cuts scrap, and produces lighter frames and shafts, driving wider adoption in high-end bicycles, hockey sticks and next-generation golf clubs.
Is recycling of composite sports gear commercially viable?
Pilot projects in Europe and North America show recycled fibers retain 60-70% of original strength, yet broader rollout awaits cost-effective collection networks and standardized processing lines.
Page last updated on:


