
Market Overview
| Study Period | 2021 - 2031 |
|---|---|
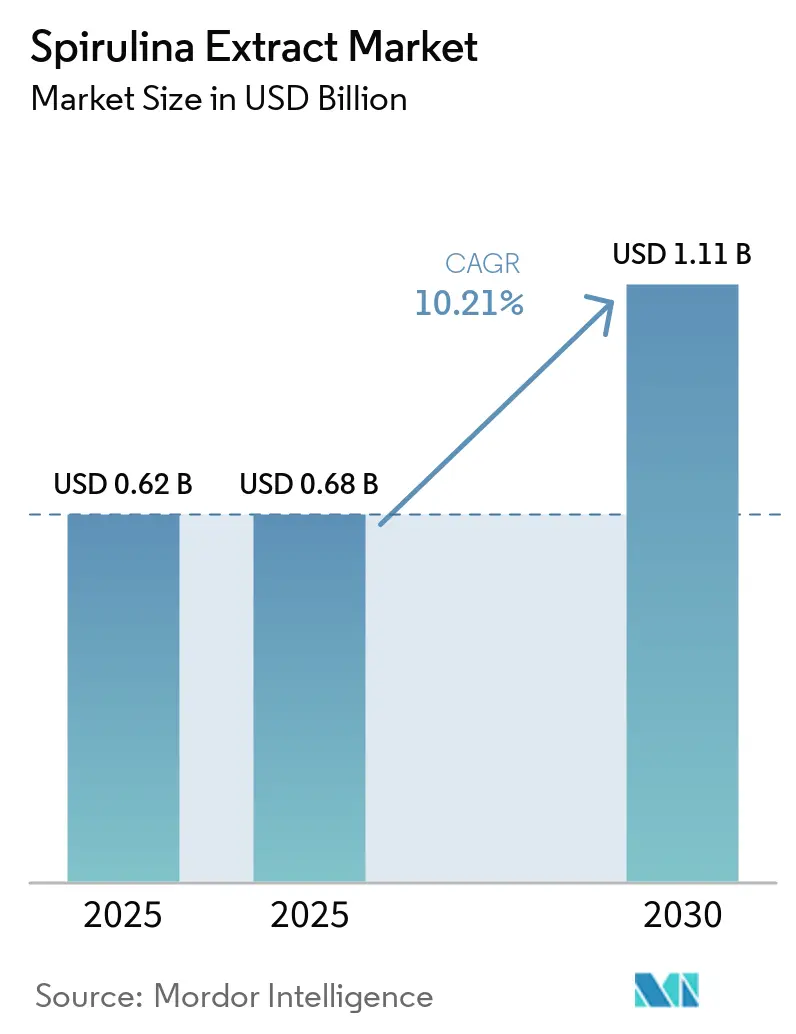
| Market Size (2025) | USD 0.68 Billion |
| Market Size (2030) | USD 1.11 Billion |
| Growth Rate (2026 - 2031) | 10.21 % |
| Fastest Growing Market | Asia Pacific |
| Largest Market | North America |
| Market Concentration | Medium |
Major Players *Disclaimer: Major Players sorted in no particular order Image © Mordor Intelligence. Reuse requires attribution under CC BY 4.0. | |
Spirulina Extract Market Analysis by Mordor Intelligence
The spirulina extract market size is projected to reach USD 0.68 billion in 2026 and USD 1.11 billion by 2031, growing at a CAGR of 10.21% from 2026 to 2031. Market momentum is accelerating as regulatory agencies clear spirulina‐derived phycocyanin for broader use, most recently when the U.S. FDA approved the color additive for carbonated and still drinks in February 2026. Brand owners are paying a 30-40% ingredient premium to meet clean-label commitments, while advances in photobioreactor technology and pulsed electric-field extraction are narrowing the cost gap with synthetic Blue 1. Beverage reformulations by Coca-Cola and PepsiCo compressed the typical 18-month color-switch timeline to fewer than nine months after GNT Group commercialized temperature- and acid-stable powders in 2025. Capital spending by integrated producers such as DIC Corporation underscores the high financial hurdle required to achieve consistent pigment quality at scale.
Key Report Takeaways
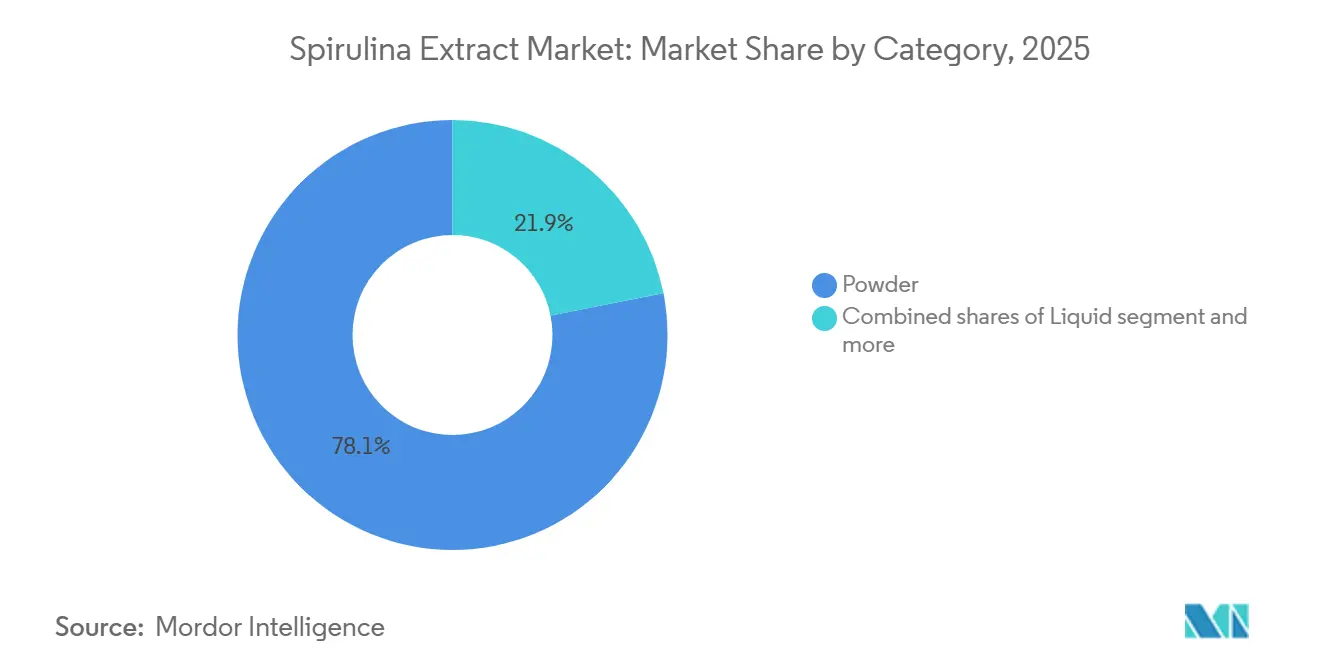
- By category, powder led with 78.11% of spirulina extract market share in 2025, while liquid formats are advancing at an 11.66% CAGR through 2031.
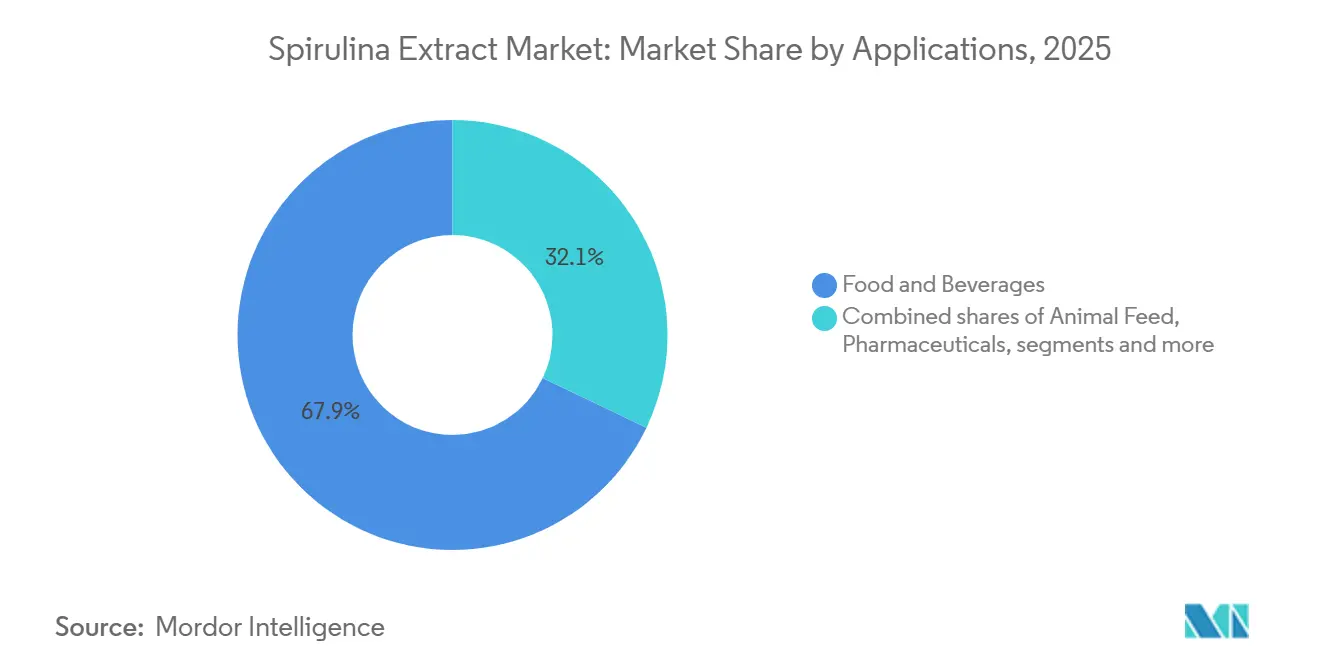
- By application, food and beverages accounted for a 67.91% share of the spirulina extract market size in 2025, and pharmaceuticals are projected to expand at a 10.78% CAGR to 2031.
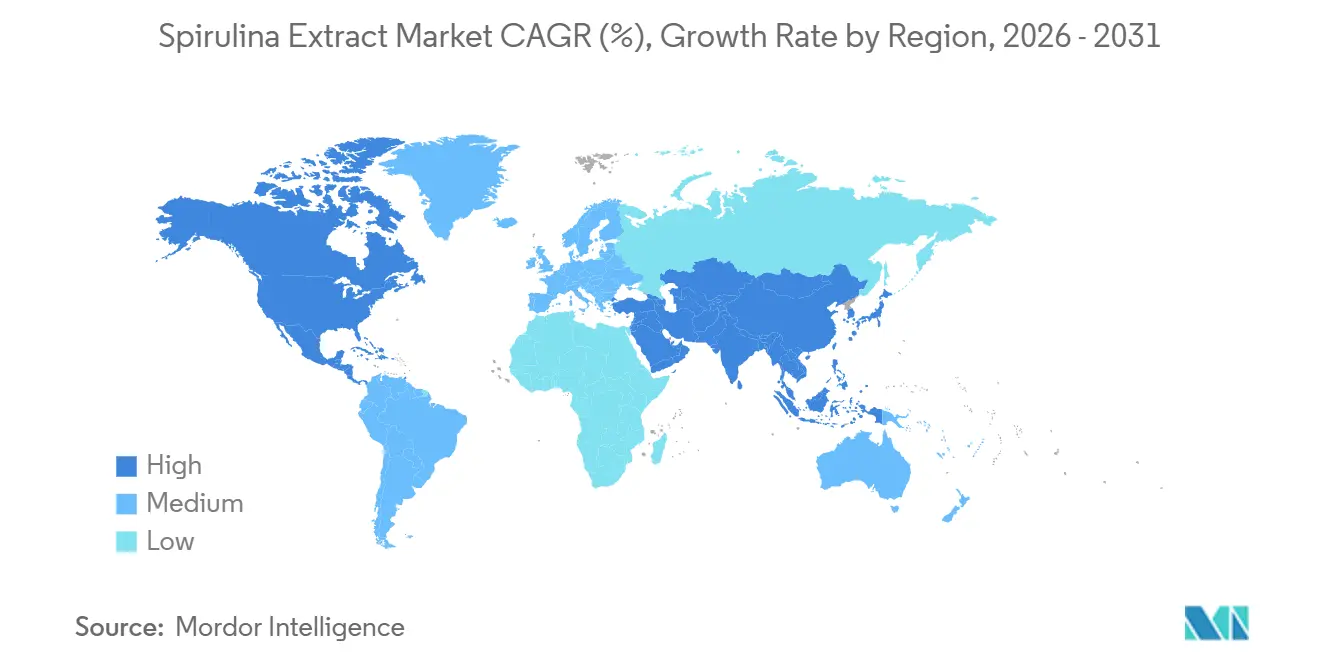
- By geography, North America held a 38.58% share in 2025, whereas Asia-Pacific is forecast to post the fastest growth at an 11.91% CAGR through 2031.
Note: Market size and forecast figures in this report are generated using Mordor Intelligence’s proprietary estimation framework, updated with the latest available data and insights as of January 2026.
Global Spirulina Extract Market Trends and Insights
Drivers Impact Analysis*
| Drivers | (~)% Impact on CAGR Forecasts | Geographic Relevance | Impact Timeline |
|---|---|---|---|
| Growing adoption of spirulina-derived phycocyanin in natural colorant applications | +2.1% | Global, with North America and Europe leading regulatory adoption | Medium term (2-4 years) |
| Rising preference for clean-label and natural ingredients | +1.8% | North America, Europe, with spillover to urban APAC markets | Short term (≤ 2 years) |
| Growing adoption of functional foods and dietary supplements | +1.5% | Global, particularly North America and Asia-Pacific health-conscious segments | Medium term (2-4 years) |
| Growth in pharmaceutical applications | +1.3% | North America, Europe, with emerging clinical research in Asia-Pacific | Long term (≥ 4 years) |
| Microencapsulation for stability and bioavailability | +1.2% | Global, with technology adoption concentrated in developed markets | Medium term (2-4 years) |
| Technological advancements in algae cultivation and extraction | +1.4% | Asia-Pacific core (China, India), with technology transfer to other regions | Long term (≥ 4 years) |
| Source: Mordor Intelligence | |||
Growing Adoption of Spirulina-Derived Phycocyanin in Natural Colorant Applications
The U.S. FDA's February 2026 approval expanding the use of spirulina extract in carbonated and non-carbonated beverages represents a watershed moment, removing a 13-year regulatory bottleneck that confined phycocyanin primarily to confectionery and dairy[1]Source: U.S. Food and Drug Administration, “Color Additives, Spirulina Extract,” FDA.gov. GNT Group's EXBERRY platform capitalized on this shift by launching temperature- and acid-stabilized blue powders in April 2025, enabling beverage formulators to achieve color stability across a pH range of 2.5-4.5, previously accessible only through synthetic alternatives. This technical breakthrough is driving reformulation at scale: major soft drink manufacturers are now replacing FD&C Blue No. 1 in over 200 SKUs globally, a shift that will add an estimated 1,200-1,500 metric tons of annual phycocyanin demand by 2028. European Union regulations under the Novel Food framework continue to favor natural colorants, with EFSA maintaining a positive safety assessment for spirulina extract concentrations up to 500 mg/kg in food matrices. The economic calculus is shifting as well: while phycocyanin remains 30-40% more expensive than synthetic Blue 1 on a per-unit basis, brand owners are absorbing the premium to meet consumer demand for "free-from" labels, particularly in premium and organic product lines where price elasticity is lower.
Rising Preference for Clean-Label and Natural Ingredients
The USDA's 2024 consumer survey revealed that 67% of U.S. households actively avoid synthetic additives, up from 52% in 2020, creating a structural demand tailwind for natural colorants[2]Source: U.S. Department of Agriculture, “Consumer Survey on Natural and Organic Food Preferences 2024,” USDA.gov. FDA's December 2024 update to the "healthy" nutrient content claim, which now explicitly favors minimally processed ingredients, has accelerated reformulation timelines across packaged food categories. Spirulina extract benefits from a dual positioning: it functions as both a colorant and a protein-rich functional ingredient, enabling formulators to consolidate ingredient decks and simplify labels. European markets are further ahead on this trajectory, with Germany and the Netherlands leading in per-capita consumption of clean-label products; the European Commission's Farm to Fork strategy, which targets a 50% reduction in synthetic pesticide use by 2030, is indirectly boosting demand for natural food ingredients, including spirulina. However, the clean-label movement is not without friction: smaller manufacturers struggle to absorb the 15-25% cost increase associated with natural colorants, creating a bifurcated market where premium brands lead adoption while value-tier products lag by 3-5 years.
Growing Adoption of Functional Foods and Dietary Supplements
Spirulina extract's protein density (60-70% by dry weight) and micronutrient profile position it at the intersection of colorant and functional ingredient markets, a dual utility that is expanding addressable demand beyond traditional food coloring applications. The U.S. National Institutes of Health's 2025 dietary guidelines emphasize plant-based protein sources, and spirulina's complete amino acid profile, including all nine essential amino acids, aligns with this recommendation. Japan's Ministry of Health, Labour and Welfare approved DIC Corporation's PHYCONA Skin Moistlifting tablets as a Food for Specified Health Use (FOSHU) in 2020, and subsequent clinical trials published in 2024 demonstrated measurable improvements in skin hydration and elasticity, validating spirulina's efficacy in beauty-from-within applications. The global dietary supplement market's shift toward multi-functional ingredients is creating white-space opportunities: formulators are increasingly combining spirulina extract with adaptogens, probiotics, and omega-3s to create "stack" products targeting immune support, cognitive function, and metabolic health. Regulatory clarity is improving as well, with FDA issuing 14 GRAS notices for spirulina-derived ingredients between 2024 and 2025, covering applications in beverages, bars, and encapsulated supplements. However, bioavailability remains a technical challenge: phycocyanin's absorption rate in the human gut is estimated at 20-30%, necessitating higher dosages or encapsulation technologies to achieve therapeutic thresholds.
Technological Advancements in Algae Cultivation and Extraction
Photobioreactor systems are displacing open-pond cultivation in regions where land and water costs are high, offering 3-5 times higher biomass productivity per square meter and eliminating contamination risks from airborne microorganisms. China's Ministry of Agriculture and Rural Affairs reported in 2025 that closed-system spirulina production increased by 34% year-over-year, driven by government subsidies covering 40% of capital expenditure for photobioreactor installations[3]Source: Ministry of Agriculture and Rural Affairs (China), “Spirulina Production Statistics 2025,” moa.gov.cn. DIC Corporation's zero-water-emission facility in Hainan, operational since January 2023, recycles 98% of process water through membrane filtration, reducing freshwater consumption from 4,000 liters to 80 liters per kilogram of dry spirulina, a breakthrough that addresses water scarcity concerns in arid cultivation regions. Extraction technology is advancing in parallel: pulsed electric field (PEF) processing, which disrupts cell membranes through high-voltage pulses, increases phycocyanin yield by 18-22% compared to conventional freeze-thaw methods while reducing energy consumption by 40%. Ultrasound-assisted extraction (UAE), commercialized by several Chinese producers in 2024, achieves similar yield improvements at lower capital cost, making it accessible to mid-sized manufacturers. These innovations are compressing the cost gap between spirulina extract and synthetic colorants: industry estimates suggest that at-scale photobioreactor production combined with PEF extraction can reduce phycocyanin costs to USD 80-100 per kilogram by 2028, down from USD 150-180 in 2025, positioning natural colorants within 10-15% of synthetic alternatives on a cost-per-application basis.
Restraints Impact Analysis*
| Restraints | (~)% Impact on CAGR Forecasts | Geographic Relevance | Impact Timeline |
|---|---|---|---|
| High production and processing costs | -1.6% | Global, with acute pressure in price-sensitive emerging markets | Short term (≤ 2 years) |
| Stability and formulation challenges | -1.1% | Global, particularly in high-temperature and low-pH applications | Medium term (2-4 years) |
| Regulatory hurdles and approval processes | -0.9% | Asia-Pacific, Latin America, Middle East with fragmented frameworks | Medium term (2-4 years) |
| Supply chain and cultivation limitations | -0.8% | Global, with concentration risk in China and India production hubs | Long term (≥ 4 years) |
| Source: Mordor Intelligence | |||
High Production and Processing Costs
Spirulina cultivation requires controlled environments with precise temperature (30-35°C) and pH (9-11), and requires balancing nutrients, translating to energy costs of USD 0.40-0.60 per kilogram of dry biomass, 2-3 times higher than terrestrial crops on an energy-per-protein basis. Phycocyanin extraction adds another layer of expense: freeze-thaw cycles, enzymatic lysis, and chromatographic purification collectively account for 30-40% of total production costs, and pharmaceutical-grade material requiring >95% purity can reach USD 300-400 per kilogram. Labor costs in the United States and Europe further compress margins: Cyanotech Corporation's 2024 annual report disclosed that labor and overhead accounted for 48% of cost of goods sold, compared with 22% for synthetic colorant manufacturers. This cost structure limits spirulina extract's penetration in price-sensitive categories such as mass-market confectionery and bakery, where synthetic Blue 1 remains 60-70% cheaper per application. Currency volatility compounds the challenge for exporters: the 12% depreciation of the Chinese yuan against the U.S. dollar in 2024-2025 eroded profit margins for Chinese producers serving North American markets, forcing several mid-sized players to exit or consolidate. Automation and process optimization offer partial relief. DIC Corporation's Hainan facility achieved a 23% reduction in per-unit costs through automated harvesting and drying systems, but the capital intensity of such upgrades (USD 5-8 million for a 100-ton annual capacity line) remains prohibitive for smaller entrants.
Stability and Formulation Challenges
Phycocyanin's chromophore structure degrades rapidly under acidic conditions (pH < 4.0) and at elevated temperatures (> 70°C), limiting its use in carbonated soft drinks, fruit juices, and baked goods without protective encapsulation. A 2024 study in Food Research International found that unencapsulated phycocyanin lost 62% of color intensity after 30 minutes at 85°C, a temperature commonly encountered in pasteurization and hot-fill processes. Light exposure accelerates degradation further: products stored in clear PET bottles exhibited 40% color loss after 90 days under retail lighting, compared to 8% loss in amber glass, necessitating packaging adjustments that add USD 0.02-0.04 per unit. These stability constraints force formulators into trade-offs: they can either accept shorter shelf lives (6-9 months versus 12-18 months for synthetic colorants), invest in encapsulation (adding 15-25% to ingredient costs), or reformulate entire product matrices to accommodate spirulina's pH and temperature sensitivities. Sensient Technologies noted in May 2025 that 30% of reformulation projects involving spirulina extract required secondary adjustments to buffering systems, preservatives, or processing protocols, extending time-to-market by 3-6 months. The technical complexity creates an adoption barrier for small and mid-sized food manufacturers lacking in-house R&D capabilities, effectively concentrating spirulina extract use among multinational corporations with dedicated application labs and longer product development cycles.
*Our forecasts treat driver/restraint impacts as directional, not additive. The impact forecasts reflect baseline growth, mix effects, and variable interactions.
Segment Analysis
By Category: Powder Dominates on Logistics and Shelf Life
Spirulina powder formats held 78.11% market share in 2025, underpinned by their 18-24 month ambient shelf life, ease of bulk shipping, and compatibility with existing dry-blending infrastructure in food manufacturing facilities. Liquid spirulina extract, though accounting for a smaller share, is expanding at 11.66% CAGR through 2031 as beverage manufacturers prioritize ready-to-use formats that eliminate reconstitution steps and reduce in-plant handling time. GNT Group's liquid EXBERRY solutions, launched in April 2025, offer pre-stabilized phycocyanin suspensions with viscosity profiles tailored for high-speed beverage filling lines, cutting formulation time from 6-8 weeks to under 3 weeks. Powder remains the workhorse for confectionery, dairy, and dietary supplement applications where dry mixing is standard practice, and its lower freight costs, liquid formats weigh 4-5 times more per unit of phycocyanin due to water content, preserving margin in export-heavy supply chains.
The "Others" category, encompassing paste and granular forms, serves niche applications in artisanal food production and cosmetics, where formulators value the concentrated pigment load and minimal processing. Microencapsulated powders, a subcategory gaining traction, commanded a 15% price premium in 2025 but delivered 2-3 times longer color retention in acidic matrices, making them economically viable for premium juice and functional beverage brands. Regulatory alignment is smoothing category expansion: FDA's February 2026 approval explicitly covers both powder and liquid spirulina extract in beverage applications, eliminating the need for separate petitions and accelerating product launches. The shift toward liquid formats is most pronounced in North America and Europe, where labor costs favor pre-mixed ingredients, while Asia-Pacific manufacturers continue to prefer powder for its lower working capital requirements and compatibility with small-batch production runs common in regional food enterprises.



By Application: Food and Beverages Lead, Pharmaceuticals Accelerate
Food and beverage applications captured 67.91% of market share in 2025, driven by reformulation mandates in carbonated soft drinks, sports nutrition, and plant-based dairy alternatives, where synthetic colorant bans are most stringent. The pharmaceutical segment, though smaller in absolute volume, is growing at 10.78% CAGR through 2031 as phycocyanin's anti-inflammatory and antioxidant properties transition from preclinical research to commercial nutraceutical formulations. FDA's issuance of 14 GRAS notices for spirulina-derived ingredients between 2024 and 2025 has de-risked pharmaceutical investment, with three biotech firms initiating Phase II trials of spirulina extracts for metabolic syndrome and neurodegenerative disease indications. DIC Corporation's PHYCONA tablets, approved as FOSHU in Japan, generated USD 12 million in sales in 2024, validating consumer willingness to pay premium prices for clinically substantiated spirulina products.
Animal feed applications are expanding in aquaculture, where spirulina's carotenoid content enhances pigmentation in farmed salmon and shrimp, commanding USD 4-6 per kilogram premiums at wholesale. European aquaculture producers are increasingly adopting spirulina to meet organic certification standards under EU Regulation 2018/848, which restricts synthetic pigments in organic seafood. The "Others" category, including cosmetics and textile dyes, remains nascent but is attracting interest from sustainability-focused brands seeking biodegradable colorants; L'Oréal's 2025 pilot program testing spirulina extract in hair care formulations signals potential for cross-industry adoption. Beverage applications within the food and beverage segment are the fastest-growing subsegment, propelled by the February 2026 FDA approval that unlocked carbonated soft drink reformulations at Coca-Cola, PepsiCo, and regional bottlers. Confectionery and dairy applications, while mature, are seeing incremental growth as manufacturers reformulate legacy SKUs to meet clean-label demands in European and North American markets, where synthetic colorant usage declined by 18% between 2022 and 2025 according to USDA data.
Geography Analysis
North America commanded 38.58% market share in 2025, anchored by the United States' early regulatory clarity and Canada's robust natural products sector. FDA's progressive stance on spirulina extract, culminating in the February 2026 beverage approval, has positioned U.S. manufacturers as first movers in reformulation, with major beverage brands launching over 150 spirulina-colored SKUs in 2025 alone. Cyanotech Corporation's Kona facility in Hawaii remains the largest single-site producer in the region, supplying pharmaceutical-grade phycocyanin to nutraceutical brands and commanding 30-40% price premiums over imported material due to its GRAS-certified production protocols. Canada's Natural Health Products Directorate has maintained a streamlined approval pathway for spirulina-based supplements, enabling faster market entry than the United States for dietary products, though food colorant applications still require case-by-case assessment. Mexico's emerging spirulina cultivation sector, concentrated in Baja California, is targeting export to U.S. food manufacturers, leveraging lower labor costs and proximity to West Coast distribution hubs, though quality consistency remains a barrier to premium market penetration.
Europe's regulatory environment, governed by EFSA's Novel Food framework, requires pre-market safety assessments for new spirulina extract applications, a process that typically spans 18-24 months but provides harmonized approval across all 27 member states once granted. Germany and the Netherlands lead regional consumption, driven by high per-capita demand for organic and clean-label products; German retailers reported in 2025 that 42% of new food launches featured natural colorants, up from 28% in 2022. The United Kingdom's post-Brexit regulatory divergence has created friction, with spirulina extract approvals now requiring separate submissions to the Food Standards Agency, delaying product launches by 6-9 months for manufacturers serving both EU and UK markets. France and Spain are emerging as cultivation hubs, with photobioreactor installations increasing by 27% in 2024-2025, supported by EU agricultural subsidies covering 35% of capital costs under the Common Agricultural Policy's green transition pillar, according to the European Commission[4]Source: European Food Safety Authority, “Novel Food Catalogue, Spirulina,” EFSA.europa.eu.
Asia-Pacific is forecast to grow at 11.91% CAGR through 2031, propelled by China and India's rapid scaling of photobioreactor capacity and domestic demand for functional foods. China's Ministry of Agriculture reported in 2025 that spirulina production reached 8,200 metric tons, representing 45% of global output, with Zhejiang Binmei Biotechnology and Nan Pao International Biotech leading capacity expansions. India's spirulina sector, concentrated in Tamil Nadu and Gujarat, benefits from year-round cultivation conditions and government incentives for algae-based protein production under the National Mission on Sustainable Agriculture. Japan's mature market, characterized by high consumer acceptance of spirulina in supplements and functional foods, is shifting toward pharmaceutical applications following FOSHU approvals for DIC Corporation's PHYCONA line. Australia's Therapeutic Goods Administration maintains stringent purity standards for spirulina supplements, creating a quality tier that commands 20-25% premiums in export markets but limits participation to well-capitalized producers. South America, Middle East, and Africa collectively represent emerging opportunities, with Brazil's expanding plant-based food sector and UAE's investment in controlled-environment agriculture positioning these markets for accelerated adoption post-2028, contingent on regulatory framework development and supply chain localization.

Regulatory Landscape
Spirulina extract regulation is tied to color-additive and novel food frameworks that shape where phycocyanin can be used and the required quality specifications. In the United States, spirulina extract is listed as a color additive exempt from certification, and FDA expanded permissions for beverage use through a final rule published in February 2026, which broadened adoption in carbonated and still drinks under defined conditions of use.
Internationally, Codex lists spirulina extract (INS 134) in the General Standard for Food Additives under GMP, supporting cross-border formulation where local requirements align to Codex references. Quality and contaminant controls have also become more explicit: JECFA updated specifications in 2022, including identity tests and total microcystin testing, which increases the documentation and testing burden for exporters and contract manufacturers supplying regulated food and supplement applications.
Value Chain Analysis
The value chain starts with strain selection and cultivation (open ponds or closed photobioreactors), then moves to harvesting and dewatering, drying into biomass, and follows with aqueous extraction and downstream clarification, concentration, and packaging into powder or liquid formats. From there, ingredient distributors and application labs support brand owners and contract manufacturers serving food and beverages, dietary supplements, cosmetics, and animal feed. Integrated producers and formulation specialists influence specifications for stability, taste masking, and labeling.
Cost and quality bottlenecks concentrate in cultivation control and extraction yield, including energy-intensive drying, biomass losses during harvesting, and batch variability driven by temperature and water quality. Those factors affect both phycocyanin concentration and contaminant risk. Technology choices such as photobioreactors, pulsed electric-field extraction, and microencapsulation increasingly fall within the midstream processor layer, while compliance tasks, including aligning to FDA color additive requirements and the microcystin specifications referenced by JECFA, add testing, traceability, and lot-release steps that tend to favor suppliers with established QA/QC and regulatory affairs capabilities.
Competitive Landscape
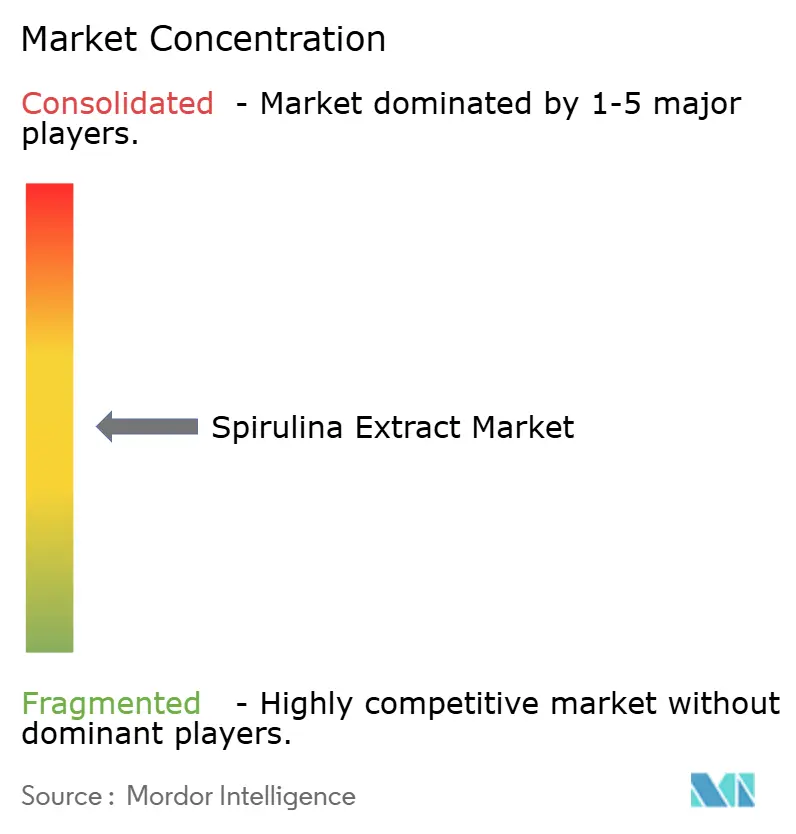
The spirulina extract market is moderately fragmented, with no dominant players and 15-20 commercially significant producers across North America, Europe, and Asia-Pacific. Strategic patterns cluster around three axes: vertical integration into cultivation and extraction, geographic expansion into high-growth regions, and technology partnerships to solve stability challenges. DIC Corporation's USD 9 million investment in its Earthrise and Hainan facilities exemplifies the capital intensity required to achieve cost competitiveness, while GNT Group's focus on application-specific formulations, evidenced by its temperature- and acid-stabilized EXBERRY powders, demonstrates the value of technical differentiation in a market where raw material quality alone is insufficient.
White-space opportunities exist in pharmaceutical-grade production, where demand for >95% phycocyanin purity exceeds supply by an estimated 30-40%, and in encapsulation technologies that can extend shelf life without prohibitive cost increases. Smaller Asian producers, particularly in China and India, are disrupting pricing structures by offering spirulina extract at 20-30% discounts to established Western brands, though inconsistent phycocyanin concentration and contamination risks limit their penetration into regulated pharmaceutical and infant nutrition segments.
Patent activity is concentrated in extraction and stabilization methods: a review of USPTO filings from 2024-2025 reveals 18 patents related to microencapsulation and 12 covering photobioreactor design, signaling that process innovation rather than raw material sourcing is the primary competitive battleground, according to The United States Patent and Trademark Office (USPTO). Regulatory compliance remains a differentiator, with FDA GRAS certification and EFSA Novel Food approval serving as de facto barriers to entry that favor incumbents with established regulatory affairs capabilities over new entrants lacking the resources to navigate multi-year approval processes.
Spirulina Extract Industry Leaders
Cyanotech Corporation
Dohler Group
Chr Hansen A/S
DIC Corporation
Givaudan SA
- *Disclaimer: Major Players sorted in no particular order

Market Opportunities and Future Outlook
FDA expansion in February 2026 for spirulina extract in beverages widens the reformulation lane for natural blues, especially for multinational beverage portfolios that previously relied on FD&C Blue No. 1 in low-pH products. Because stabilized spirulina formats have already shortened color-switch timelines for major brand owners, demand is clustering around application-ready systems, including acid and heat stability and light protection, as well as liquid solutions that reduce plant handling time and speed line trials.
On the supply side, opportunity shows up in capacity additions and contract manufacturing as producers aim to deliver consistent pigment quality at scale. Recent signals include 2026 partnerships and controlled-environment build-outs focused on geographic diversification beyond legacy hubs, such as Arborea and Vita Actives collaboration to scale BioSolar Spirulina for food and beverage uses, and the staged build-out of a spirulina facility in Bao Loc, Vietnam (phase one completed, with further capacity planned). As buyers tighten contaminant and consistency requirements, suppliers offering validated testing, including microcystin controls, pharma-grade purification, and encapsulation and packaging solutions that extend shelf life can differentiate beyond commodity biomass.
Recent Industry Developments
- June 2026: DIC Corporation launched SACRANEX Powder globally, a high-molecular-weight polysaccharide derived from Aphanothece sacrum for skincare and cosmetic formulations. While this is not a spirulina pigment, the release highlights DICs broader algae-derived ingredient platform and reinforces its downstream reach into personal care. This can support cross-industry scale-up and processing know-how relevant to spirulina extract operations.
- April 2026: Cyanotech Corporation signed a commercial-scale manufacturing agreement with ZIVO Bioscience to cultivate and process proprietary algal biomass at Cyanotechs Kona, Hawaii facility. The contract manufacturing model improves asset utilization and shows how established microalgae producers are monetizing cultivation and processing capabilities that are adjacent to spirulina biomass and extract production.
- April 2025: DIC Corporation, through its subsidiary Earthrise Nutritionals, commenced operations at a new edible algae cultivation facility in California to advance smart farming for spirulina production. The facility strengthens domestic supply and process control for food-grade spirulina inputs, supporting customers that prioritize traceability and consistent quality.


Research Methodology Framework and Report Scope
Market Definition and Coverage
For this study, the spirulina extract market is defined as revenue earned from spirulina-derived extracts sold as ingredients. The coverage includes the common commercial forms used for coloring and functional use across end applications.
Scope exclusions: It excludes finished consumer branded products where spirulina extract is only one of many ingredients, and it also excludes raw spirulina biomass sold without extract processing.
Segmentation Overview
- By Category
- Powder
- Liquid
- Others
- By Application
- Food and Beverages
- Pharmaceuticals
- Animal Feed
- Others
- By Geography
- North America
- United States
- Canada
- Mexico
- Rest of North America
- Europe
- Germany
- United Kingdom
- Italy
- France
- Spain
- Netherlands
- Rest of Europe
- Asia-Pacific
- China
- India
- Japan
- Australia
- Rest of Asia-Pacific
- South America
- Brazil
- Argentina
- Rest of South America
- Middle East and Africa
- South Africa
- United Arab Emirates
- Rest of Middle East and Africa
- North America
Data Sources, Market Sizing, and Validation
Desk Research
Desk work started with building a clean view of supply, demand, and rules that influence spirulina-derived extracts, then mapping these signals to the ingredients value chain. Public sources were used to anchor context, such as food additive and labeling information from regulators like the US FDA, agriculture and trade statistics from sources such as FAOSTAT and UN Comtrade, and scientific literature that explains extraction yields and pigment stability (for example, peer-reviewed journals).
We also reviewed company annual reports, investor decks, and reputable press to understand capacity additions, application launches, and pricing direction by form. For cross-checking totals, we relied on paid subscriptions for company financials and intelligence, patent databases, and shipment-level trade views where relevant. This helped validate the pace of new product activity and trade movement. The desk research sources listed here are illustrative only, and many other public references were also consulted to collect, validate, and clarify data points.
Primary Interviews and Surveys
Primary work focused on interviews and structured questionnaires with ingredient suppliers, distributors, formulators, and procurement or quality teams from end users, so key assumptions could be validated in plain terms. Since demand is global, inputs were gathered across major consuming and producing regions, and follow-ups were done when pricing, yield, or application mix assumptions showed wide variance.
Distribution of primary research fieldwork respondents
| Company type | Respondent position | Region |
|---|---|---|
| Top tier: 25% | CXOs: 13% | APAC: 38% |
| Mid tier: 61% | Functional/Unit leaders: 42% | EMEA: 35% |
| Smaller Players: 14% | Managers: 45% | Americas: 27% |
Market-Sizing & Forecasting
Sizing was built using a mix of top-down and bottom-up logic. The top-down layer reconstructs the demand pool from application-level adoption and ingredient usage, then converts it into value using observed pricing ranges. To keep the model practical, we relied on market fingerprints such as the split of demand across food and beverages, pharmaceuticals, and animal feed, the share of powder versus liquid formats, typical inclusion rates by application, and the price spread driven by purity and color intensity.
Those totals were then corroborated using selective bottom-up approximations, such as sampling supplier and distributor revenues where disclosures exist. We used volume-to-value conversions with realistic ASP bands and ran channel checks on how much is sold as pigment-led extract versus broader extract mixes. When supplier disclosure was limited, gaps were handled using regional trade movement and capacity signals as guardrails, then pressure-testing the same assumptions through primary feedback. Forecasts were developed using scenario analysis tied to application penetration, regulatory acceptance for natural colors, capacity additions, and expected ASP progression, with the final path aligned to what interviewees considered realistic over the forecast window.
Data Validation & Update Cycle
Validation was done in steps, starting with checking internal consistency across volume, price, and application mix, then comparing outputs against independent signals like trade direction, capacity announcements, and observed pricing movements. Outliers were reviewed by a second analyst, and follow-up calls were triggered when a single assumption moved the total market materially.
Reports are refreshed on an annual cycle, and interim updates are made when major events occur, such as regulatory changes or meaningful capacity shifts. Before delivery, we run a fresh review pass to confirm the latest data points are reflected and that the story and numbers still align with current market reality.
Mordor Intelligence's Spirulina Extract Market Estimate Compared With Other Published Estimates
Published market sizes for spirulina extract do not always match because different studies count different things, use different base years, and apply different pricing logic across extract grades and forms. The spread also increases when one estimate leans heavily on a single end-use narrative, while another balances several demand pools.
The main gap comes from whether revenue is counted at the ingredient extract level or whether parts of finished-product value are folded in. Mordor Intelligence treats the market as ingredient sales tied to extract forms and application usage rather than retail product turnover. Differences also come from how purity-driven ASPs are progressed, how quickly regulatory-driven adoption is assumed to move into beverages and supplements, and whether currency timing and inflation are applied consistently across regions.
Benchmark comparison
| Source | Market Size | Gaps in Research Methodology |
|---|---|---|
| Mordor Intelligence | USD 0.68 B (2025) | |
| Industry Report A | USD 0.53 B (2024) | Uses a different base year and appears to apply a narrower value pool, which can happen when food color use cases or non-food applications are underweighted, and when price bands are kept conservative across grades. |
| Market Study B | USD 0.53 B (2024) | Uses a 2024 base and likely includes a different mix of extract definitions and pricing assumptions by channel, which can shift totals when liquid versus powder splits and purity premiums are treated differently. |
Overall, the comparison shows that scope choices (ingredient value versus downstream value), base-year selection, and the way ASP and application mix are modeled explain most of the difference. By tying the market total back to clear use-driven volume logic and realistic price bands, the estimate stays traceable and easier to recreate when assumptions are updated.


Key Questions Answered in the Report
What was the global spirulina extract market size in 2026?
The spirulina extract market size is valued at USD 620 million in 2025.
Which category leads current demand for spirulina extract?
Powder formats dominate with 78.11% revenue share thanks to long shelf life and logistics efficiency.
Which region is growing fastest in demand?
Asia-Pacific is forecast to expand at an 11.91% CAGR through 2031 as China and India scale photobioreactor output.
Why are beverage makers switching to spirulina extract?
The February 2026 FDA approval removed regulatory barriers, and new stable powders allow vivid color in low-pH drinks without synthetic additives.
What is the main cost challenge for producers?
Cultivation and high-purity extraction drive operating expenses, keeping natural pigment 30-40% above synthetic Blue 1 on a per-application basis.
Page last updated on:


 Your data is secure and never sold or shared.


