Soybean Derivatives Market Size and Share
Market Overview
| Study Period | 2021 - 2031 |
|---|---|
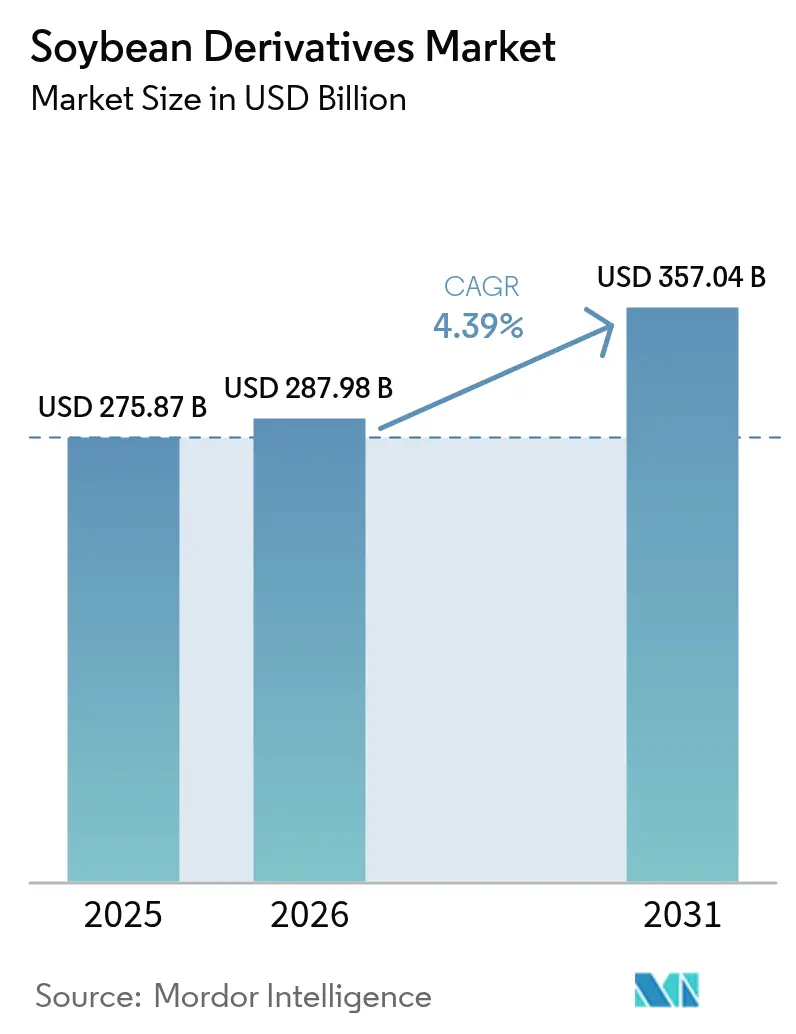
| Market Size (2026) | USD 287.98 Billion |
| Market Size (2031) | USD 357.04 Billion |
| Growth Rate (2026 - 2031) | 4.39% CAGR |
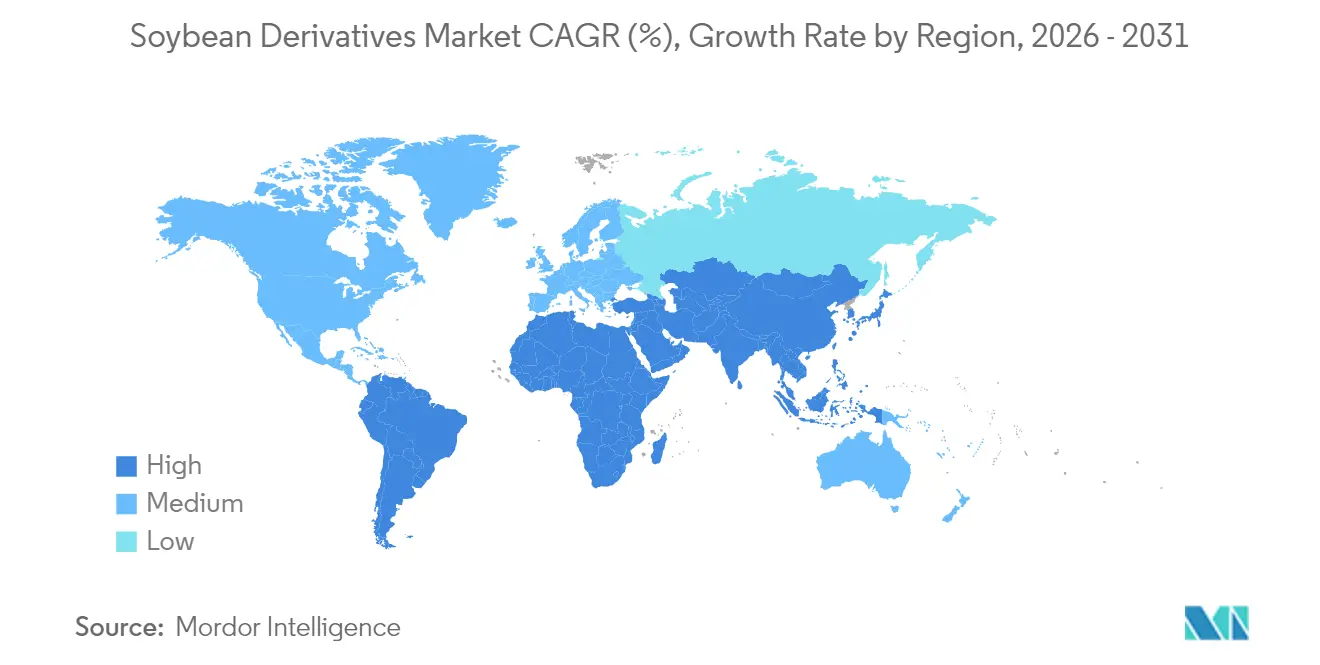
| Fastest Growing Market | Middle East and Africa |
| Largest Market | Asia Pacific |
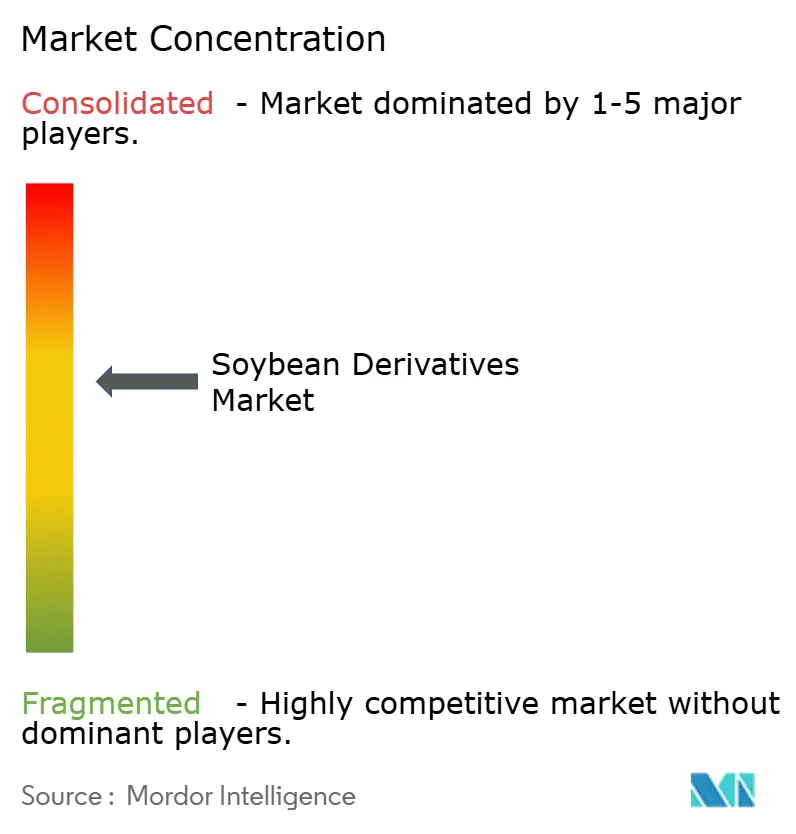
| Market Concentration | Medium |
Major Players
*Disclaimer: Major Players sorted in no particular order Image © Mordor Intelligence. Reuse requires attribution under CC BY 4.0. |
|
Soybean Derivatives Market Analysis by Mordor Intelligence
Soybean derivatives market size in 2026 is estimated at USD 287.98 billion, growing from 2025 value of USD 275.87 billion with 2031 projections showing USD 357.04 billion, growing at 4.39% CAGR over 2026-2031. The market growth reflects adaptation to changing demand patterns, particularly in renewable diesel production, which has altered traditional soy oil distribution[1]Source: USDA, "U.S. Renewable Diesel Production Growth Drastically Impacts Global Feedstock Trade"fas.usda.gov. Food, feed, and functional applications continue to expand. The Asia-Pacific region maintains the largest market share, driven by increased livestock production and protein consumption, while the Middle East and Africa region shows the highest growth potential due to expanding poultry production and food security initiatives. Soy meal remains the primary derivative due to consistent livestock demand, while soy protein sales increase with growing plant-based food consumption. Liquid soy formulations are gaining traction among beverage manufacturers seeking nutritious ingredients. While production capacity increases in the United States, Brazil, and Argentina ensure sufficient raw material supply, the market faces challenges from price fluctuations, deforestation regulations, and competition for sustainable feedstock sources.
Key Report Takeaways
- By product type, soy meal led with 62.55% revenue share in 2025, while soy protein is projected to expand at a 5.97% CAGR through 2031.
- By nature, conventional cultivars held 82.60% of the soybean derivatives market share in 2025; organic variants are forecast to grow at 7.66% CAGR.
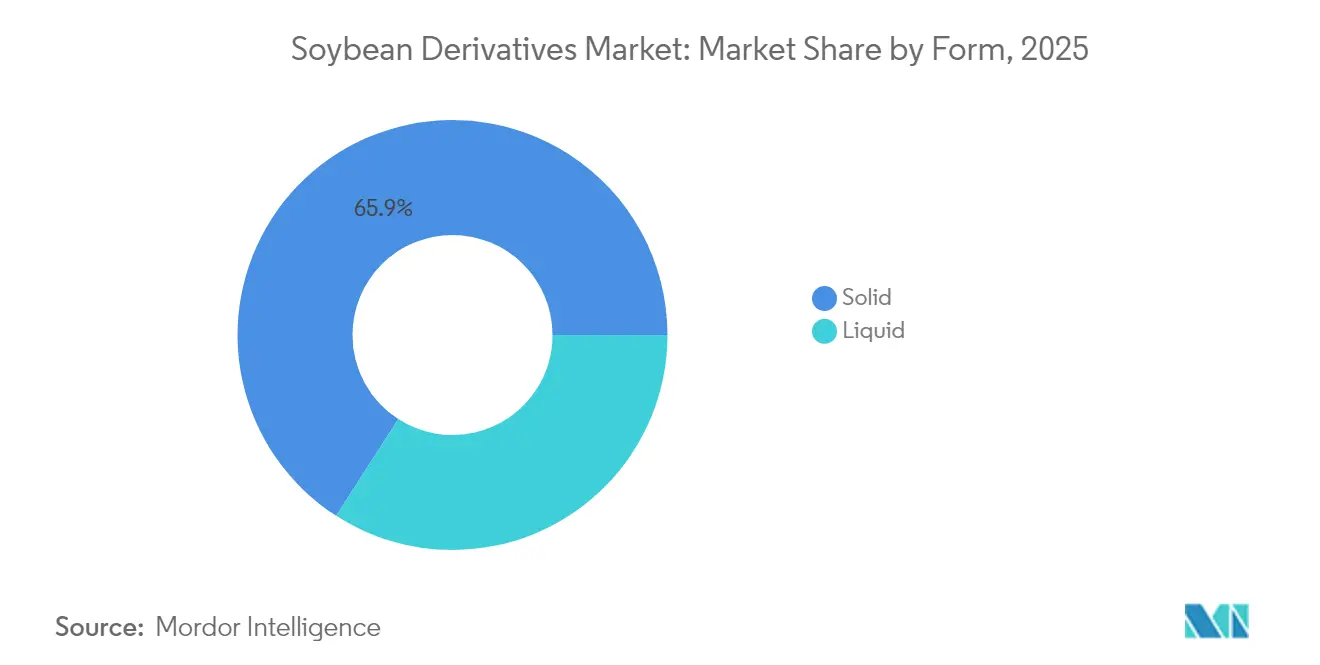
- By form, solid derivatives accounted for 65.90% of the 2025 soybean derivatives market size, whereas liquid forms are expected to post a 7.16% CAGR by 2031.
- By application, animal feed captured 59.50% of the 2025 soybean derivatives market size; biofuel usage is pacing fastest at an 7.99% CAGR.
- By geography, Asia-Pacific commanded 42.10% of 2025 revenues, while the Middle East and Africa region is poised for a 6.73% CAGR through 2031.
Note: Market size and forecast figures in this report are generated using Mordor Intelligence’s proprietary estimation framework, updated with the latest available data and insights as of 2026.
Global Soybean Derivatives Market Trends and Insights
Drivers Impact Analysis*
| Driver | (~) % Impact on CAGR Forecast | Geographic Relevance | Impact Timeline |
|---|---|---|---|
| Rising demand for plant-based proteins | +0.8% | Global, with concentration in North America and Europe | Medium term (2-4 years) |
| Growing adoption of soy-based ingredients in animal feed | +1.2% | Asia-Pacific core, spill-over to MEA | Long term (≥ 4 years) |
| Increasing demand from the biodiesel industry | +1.5% | North America and EU, expanding to Brazil | Short term (≤ 2 years) |
| Easy and abundant availability of raw materials | +0.6% | Global, with advantages in South America | Long term (≥ 4 years) |
| Rising use in food fortification | +0.4% | Global, with early gains in developed markets | Medium term (2-4 years) |
| Expanding applications in personal care and cosmetic industry | +0.3% | North America and EU, expanding to Asia-Pacific | Medium term (2-4 years) |
| Source: Mordor Intelligence | |||
Rising Demand for Plant-Based Proteins
The growing consumer preference for plant-based foods is increasing the use of soy protein in food and beverage products. The shift is particularly evident in developed markets, where health consciousness and environmental concerns drive consumption patterns. Soy protein applications now extend beyond meat alternatives to include functional beverages and meal replacements, utilizing soy's complete amino acid composition. Research shows that nanoparticles combining vitamin E, calcium, and soy protein isolate improve nutrient absorption in beverages. This development benefits liquid soy products as companies create convenient, nutrient-rich options for health-focused consumers. The enhanced bioavailability of nutrients in these formulations addresses consumer demands for more effective nutritional solutions. The FDA's revised guidelines on plant-based milk alternatives strengthen soy's market position, as it remains the only plant-based beverage recognized in the dietary guidelines' dairy category[2]Source: FDA, "Plant-Based Milk and Animal Food Alternatives", fda.gov. This regulatory recognition provides manufacturers with additional opportunities to develop innovative soy-based products that meet both nutritional requirements and consumer preferences.
Growing Adoption of Soy-Based Ingredients in Animal Feed
The expansion of the livestock sector in developing markets is driving the demand for high-quality protein sources, with soybean meal emerging as a crucial ingredient in animal nutrition due to its comprehensive amino acid composition. In Saudi Arabia, the increasing adoption of compound feed demonstrates this trend, as farmers utilize soybean meal to improve livestock productivity and feed conversion rates and address growing protein requirements in their animal populations. The development of double-fermented soybean meal has significantly reduced anti-nutritional factors while enhancing digestibility and amino acid absorption in broiler chickens, creating new premium product segments in the animal feed market. According to data from the USDA, U.S. soybean meal exports are anticipated to reach 17.3 million short tons in the market year 2024-2025, reflecting increased global demand, particularly in Asia-Pacific markets where intensive livestock production continues to grow, despite strong competition from South American producers. Processing advancements, including fermentation techniques and enzyme treatments, are elevating soybean meal from a basic commodity to a specialized nutrition product, driving sustained demand across various livestock applications.
Increasing Demand from the Biodiesel Industry
The U.S. renewable diesel industry has increased soybean oil consumption substantially, with production capacity projected to grow rapidly. The Inflation Reduction Act of 2022 extended biomass-based diesel tax credits through 2024, supporting industry expansion, as reported by the U.S. Energy Information Administration. The Federal Renewable Fuel Standard mandates and state biodiesel blending requirements have created stable demand, driving increased soybean oil usage in renewable diesel production. This development has altered global trade dynamics. U.S. soybean crush increased to produce more oil, supported by high soybean oil prices that generated strong crush margins. While domestic demand increased, U.S. soybean exports decreased due to expanding Brazilian supplies and slower global import demand growth. According to data from the USDA, U.S. soybean oil prices rose significantly above global vegetable oil prices, causing exports to decrease sharply, making the United States a net soybean oil importer in 2023. Used cooking oil and corn oil, with their superior carbon intensity scores, have reduced soybean oil's proportion in biomass-based diesel production. The shift to producer tax credits will influence feedstock economics, potentially affecting soybean oil's growth trajectory while maintaining its role in meeting renewable fuel requirements.
Easy and Abundant Availability of Raw Materials
According to USDA data, global soybean production is expected to reach 420.78 million metric tons in the market year 2024-2025. Brazil leads production with 169 million metric tons, followed by the United States at 118.84 million metric tons and Argentina at 49 million metric tons. South American expansion provides substantial feedstock for derivative processing, despite regional supply chain variations and logistical challenges. The United States maintains competitiveness through its logistics infrastructure and proximity to processing facilities, with new crush plants adding 300,000 bushels per day of capacity to meet market demand. Climate adaptation strategies are improving yield stability across production regions, with ERS research models indicating sustained production capabilities despite environmental pressures. However, Brazil faces financing constraints that affect production and infrastructure investment. Trade policy changes present supply chain risks that may impact raw material availability and pricing. These factors influence derivative pricing and processing margin optimization across the global market, necessitating risk management strategies.
Restraints Impact Analysis*
| Restraint | (~) % Impact on CAGR Forecast | Geographic Relevance | Impact Timeline |
|---|---|---|---|
| Fluctuating raw material prices | -0.7% | Global, with highest volatility in commodity-dependent regions | Short term (≤ 2 years) |
| Growing consumer preference for alternatives | -0.5% | North America & EU, spreading to urban Asia-Pacific | Medium term (2-4 years) |
| Stringent government regulations on genetically modified soybeans | -0.4% | EU core, expanding to other developed markets | Long term (≥ 4 years) |
| Health concerns related to soy allergies | -0.3% | Global, with regulatory focus in developed markets | Medium term (2-4 years) |
| Source: Mordor Intelligence | |||
Fluctuating Raw-Material Prices
According to USDA data, the U.S. season-average farm price for soybeans in 2024/25 is forecast at USD 11.20 per bushel, down from USD 12.55 per bushel in MY 2023/24. Soybean meal prices are expected to decrease to USD 330.00 per short ton, and soybean oil prices are projected to decline to USD 0.42 per pound. These substantial price fluctuations have created considerable margin pressure throughout the derivatives value chain, compelling processors to implement more sophisticated and dynamic pricing strategies to maintain profitability. Transportation costs increased substantially due to drought-related delays at the Panama Canal and escalating security issues in the Red Sea route, which forced merchants to seek alternative shipping paths, resulting in higher operational expenses and logistical complexities. In Brazil, the sharp rise in input costs effectively doubled operating expenses, leading producers to significantly reduce their chemical applications. This reduction in agricultural inputs has subsequently impacted crop yield consistency, overall production quality, and potentially long-term soil health, raising concerns about future harvest outcomes and market stability.
Stringent Government Regulations on Genetically Modified Soybeans
Government regulations on genetically modified (GM) soybeans restrict the soybean derivatives market through increased compliance costs, limited market access, and consumer shifts toward non-GMO alternatives. These regulations include comprehensive safety assessments, detailed labeling requirements, and specific restrictions on cultivation and imports, which increase production and distribution costs for companies. The regulatory framework requires extensive documentation, testing protocols, and certification processes that impact operational efficiency. While in June 2024, China's new GM corn and soybean variety registration lists suggest growing acceptance of biotechnology, varying regulations across markets affect global supply chains and create additional operational complexities. The FDA's bioengineered food disclosure standards create additional compliance requirements through mandatory reporting, documentation, and verification processes while enabling consumer choice in GM-sensitive markets. These standards necessitate investment in tracking systems, label modifications, and regular audits to maintain compliance.
*Our forecasts treat driver/restraint impacts as directional, not additive. The impact forecasts reflect baseline growth, mix effects, and variable interactions.
Segment Analysis
By Product Type: Meal Dominance Faces Protein Innovation
Soy meal accounted for 62.55% of the soybean derivatives market in 2025, driven by its essential role in animal feed production. The growing poultry and aquaculture industries in Asia-Pacific and Middle East, and Africa regions sustain the demand for soy meal products. Improved fermentation techniques have enhanced soy meal digestibility, enabling manufacturers to increase prices for broiler feed formulations. The enhanced digestibility has established soy meal as a primary protein source in animal nutrition, particularly in commercial poultry operations where feed efficiency is essential.
The soy protein market is projected to grow at a 5.97% CAGR through 2031, driven by increased production of textured vegetable protein, nutritional bars, and dairy alternatives for flexitarian consumers. Enhanced liquid formulations benefit from both convenience and improved bioavailability through nano-encapsulation technology. The soy oil market is increasingly influenced by renewable diesel demand, with the share of U.S. soybean oil used for biofuel rising from less than 1% in 2001/02 to 46% in 2022/23, according to data from the USDA. While soy milk maintains consistent demand in Asia, new fortified beverage launches in North America and Europe contribute to market growth.


By Nature: Organic Premium Amid Supply Constraints
Conventional soybeans hold an 82.60% market share in 2025, while organic variants grow at a 7.66% CAGR. Conventional production benefits from technological advances, including genetically engineered seeds and precision agriculture, with seeding rate optimizations improving yield efficiency and cost competitiveness. Farmers implementing these technologies report increased productivity and reduced input costs per hectare. The organic segment faces challenges, including limited herbicide options and complex pest management requirements.
Organic producers must rely on crop rotation, biological controls, and mechanical weed management strategies to maintain crop health. However, increasing consumer demand for non-GMO products supports its growth despite supply constraints. The premium pricing for organic soybeans often offsets the lower yields and higher production costs. Contract production dominates the organic segment, providing price stability and quality assurance for producers and buyers. These contracts typically include specific production protocols and delivery schedules, ensuring consistent supply chain management.
By Form: Liquid Applications Drive Innovation
Solid derivatives maintained a 65.90% market share in 2025, driven by bulk meal and protein shipments to the feed and processed food industries. These products provide enhanced shelf stability, which is essential for extended transportation to Asian markets. The dominance of solid derivatives is further reinforced by their ease of handling, storage efficiency, and lower transportation costs compared to liquid alternatives. Liquid derivatives are projected to grow at 7.16% annually through 2031, supported by functional beverage introductions and clinical nutrition applications.
Research shows vitamin E, calcium, and soy protein nanoparticle combinations improve mineral absorption in beverages, creating potential therapeutic applications. The versatility of liquid derivatives extends beyond beverages into pharmaceutical formulations and specialized dietary supplements. In non-food segments, liquid soy phospholipids serve as emulsifiers in natural cosmetics products, aligning with clean-label requirements. Their increasing adoption of personal care products is driven by consumer preference for plant-based ingredients and sustainable manufacturing processes.
By Application: Biofuel Disrupts Traditional Patterns
Animal feed accounted for 59.50% of soybean revenues in 2025, driven by Asia's increasing demand for high-protein feed. This demand originates from the region's growing livestock industry and rising meat consumption. In the Middle East, Saudi Arabia and Oman's increased compound feed usage demonstrates the wider adoption of soy meal as countries pursue poultry self-sufficiency. These nations are developing domestic poultry production facilities and implementing modern feeding practices to decrease their reliance on meat imports.
The biofuel segment is growing at 7.99% CAGR, emerging as the fastest-growing application. The United States has experienced a doubling of renewable diesel capacity, while new projects in Brazil and Canada indicate increasing demand. The sustainable aviation fuel sector presents additional opportunities for soy oil, subject to carbon-intensity requirements. Food and beverage manufacturers continue to expand soy applications in plant-based meats, baked goods, and fortified snacks, while personal care products incorporate soy lecithin and sterols to meet natural ingredient requirements.
Geography Analysis
Asia-Pacific accounted for 42.10% of the market revenue in 2025, primarily due to China's extensive feed industry. The region's dominance is further strengthened by its robust agricultural infrastructure and growing livestock population. Regional processors are increasing their capacity in Vietnam, Thailand, and Indonesia to optimize supply chains and enhance crush margins. These expansions aim to meet the rising demand from local markets and reduce dependency on imports. South Asia, with India at the forefront, is experiencing double-digit growth in poultry production, driving up the demand for soybean meal. The growth in India is supported by increasing consumer preference for protein-rich diets and government initiatives promoting agricultural development.
The Middle East and Africa region shows the highest CAGR at 6.73%, supported by investments in the poultry sector. Saudi Arabia increases compound feed usage to enhance broiler weights. In February 2025, Almunajem's Balady Poultry Trading Co. planned to invest USD 304 million in poultry operations expansion in Saudi Arabia. Europe is preparing for the implementation of the Deforestation Regulation in 2025, which will influence sourcing patterns toward zero-deforestation certified suppliers. South American producers increase cultivation area but face challenges from higher interest rates and logistics constraints, limiting their market advantages.
North America's integrated farm-to-fuel supply chain has reshaped domestic soybean distribution. The growing demand for renewable diesel has compelled traders to balance domestic oil requirements with export meal commitments, leading the United States to become a soybean oil importer in 2023. This shift reflects the region's increasing focus on sustainable fuel alternatives and environmental regulations. The transformation has created new market dynamics, affecting both domestic production patterns and international trade relationships. Processors are adapting their operations to accommodate these changes while maintaining efficiency in their supply chains.

Competitive Landscape
The soybean derivatives industry maintains moderate concentration, with Cargill, ADM, and Bunge holding significant crush capacity, which affects entry barriers and competitive dynamics. Processors are actively securing low-carbon feedstock contracts with renewable diesel partners. The market is experiencing processing capacity expansion, as demonstrated by South Dakota Soybean Processors, LLC (SDSP)'s February 2025 announcement to build a multi-seed processing plant near Mitchell, South Dakota. The facility will process 35 million bushels of soybeans annually, equivalent to 1.0 million tons of hi-oilseed crops.
Traceability investments are becoming key differentiators in the market. Bunge has achieved full monitoring coverage of indirect suppliers in Brazil's priority regions, meeting EU and U.K. due diligence requirements. Industry participants are implementing satellite imaging, blockchain, and mass-balance audits to verify deforestation-free compliance and secure premium pricing in risk-conscious markets.
Product diversification is reshaping market dynamics. Processors are developing premium fermented meals, organic and non-GMO proteins, and cosmetic-grade lecithin to counter reduced crush margins. Strategic investments in soy protein isolates for plant-based meat production and sterol-rich fractions for nutraceuticals offer improved profitability during unfavorable commodity cycles.
Soybean Derivatives Industry Leaders
-
Archer Daniels Midland Company
-
Bunge Limited
-
CHS Inc.
-
Cargill Incorporated
-
Louis Dreyfus Company BV
- *Disclaimer: Major Players sorted in no particular order

Recent Industry Developments
- May 2025: Bunge introduced soy protein concentrates at the IFFA trade show, containing approximately 70% protein and 17% fiber content on a dry basis. The concentrates are available in conventional and non-GMO formats, offered in both powdered and textured forms for applications in snacks, baked goods, plant-based meats, and beverages.
- November 2024: Beck's announced plans to establish a soybean processing facility in New Madrid, Missouri. The 60,000-square-foot facility, situated on 105.5 acres, will process 3 million units of soybeans annually when it becomes fully operational in fall 2026.
- July 2024: ADM introduced fully traceable soybean meal and oil products to Europe through a North American initiative. This program supplies European markets with verified soybean products that comply with EU deforestation regulations.
- November 2023: Cargill completed an expansion and modernization project at its integrated soybean crush and refined oils facility in Sidney, Ohio. The project doubled the facility's previous crush capacity, increasing market opportunities for local farmers and feed customers by enhancing soybean demand and improving access to soybean meal and hulls.


Global Soybean Derivatives Market Report Scope
Soybean derivatives are ingredients obtained from soybean either by crushing, drying, or other processing methods. The soybean derivatives market was segmented by type and application. The food and beverage segment is further segmented into bakery, breakfast cereals, pasta and noodles, meat and meat products, beverages, and other food and beverage segments. The study analyzes the soybean derivatives market in the emerging and established regions globally, including North America, Europe, Asia-Pacific, South America, and Middle-East and Africa. The report offers market size and forecast for soybean derivatives in value (USD million) for all the above segments.
| Soy Meal |
| Soy Oil |
| Soy Protein |
| Soy Milk |
| Others |
| Conventional |
| Organic |
| Solid |
| Liquid |
| Animal Feed | |
| Food and Beverage | Bakery and Confectionary |
| Beverages | |
| Other Food and Beverages | |
| Biofuel | |
| Personal Care and Cosmetics | |
| Other Applications |
| North America | United States |
| Canada | |
| Mexico | |
| Rest of North America | |
| Europe | Germany |
| United Kingdom | |
| Italy | |
| France | |
| Spain | |
| Netherlands | |
| Rest of Europe | |
| Asia-Pacific | China |
| India | |
| Japan | |
| Australia | |
| South Korea | |
| Rest of Asia-Pacific | |
| South America | Brazil |
| Argentina | |
| Rest of South America | |
| Middle East and Africa | South Africa |
| Saudi Arabia | |
| United Arab Emirates | |
| Rest of Middle East and Africa |
| By Product Type | Soy Meal | |
| Soy Oil | ||
| Soy Protein | ||
| Soy Milk | ||
| Others | ||
| By Nature | Conventional | |
| Organic | ||
| By Form | Solid | |
| Liquid | ||
| By Application | Animal Feed | |
| Food and Beverage | Bakery and Confectionary | |
| Beverages | ||
| Other Food and Beverages | ||
| Biofuel | ||
| Personal Care and Cosmetics | ||
| Other Applications | ||
| By Geography | North America | United States |
| Canada | ||
| Mexico | ||
| Rest of North America | ||
| Europe | Germany | |
| United Kingdom | ||
| Italy | ||
| France | ||
| Spain | ||
| Netherlands | ||
| Rest of Europe | ||
| Asia-Pacific | China | |
| India | ||
| Japan | ||
| Australia | ||
| South Korea | ||
| Rest of Asia-Pacific | ||
| South America | Brazil | |
| Argentina | ||
| Rest of South America | ||
| Middle East and Africa | South Africa | |
| Saudi Arabia | ||
| United Arab Emirates | ||
| Rest of Middle East and Africa | ||


Key Questions Answered in the Report
How large is the soybean derivatives market today?
The soybean derivatives market size stands at USD 287.98 billion in 2026 and is projected to reach USD 357.04 billion by 2031.
What is driving rapid growth in soy protein?
Demand for plant-based foods, fortified beverages and meat analogues is pushing soy protein sales at a 5.97% CAGR through 2031, supported by its complete amino-acid profile and FDA recognition within the dairy group.
Which is the fastest growing region in Soybean Derivatives Market?
The Middle East and Africa leads with a 6.73% CAGR, driven by poultry-sector expansion and new regional soy-meal plants.
Which region has the biggest share in Soybean Derivatives Market?
In 2025, the Asia-Pacific region accounts for the largest market share in Soybean Derivatives Market.
Page last updated on:


